
Did you know that 89% of businesses compete solely based on customer experience?
You might think they are foolish not to prioritize other marketing aspects, but believe us, these businesses focus on the mightiest thing here.
With thousands of options, customer experience is still the foremost thing to let any business sustain itself in today’s dynamic market.
Talk about the likes of Apple, Microsoft, and Airbnb - they all leverage customer experience, and you will resonate with us if you use their products or services.
So how can your business improve on customer experience?
In this article, we’ll walk you through the basics of customer experience KPIs and the 11 most important metrics that can help you monitor, analyze, and enhance customer experience.
But first, let’s talk a little about the basics of customer experience.
What is Customer Experience?
Customer experience is the impression people have of your brand before and after going through all aspects of the buyer's journey.
It results in your brand's goodwill, and thus any change in your customer experience directly impacts your main pillars - finance, marketing, sales, and loyalty.
With the advent of the world wide web - it's the customers who are in power, not the sellers. It's a matter of time before a frustrated customer switches to your competitor.
They are just a google search away!
What are Customer Experience KPIs?
Customer experience KPIs are quantifiable measurements that help you identify your customers' loyalty or satisfaction.
Basically, it measures the level of interaction between a company and its customers.
By tracking these key performance indicators, you can calculate how fast you lose customers, how effectively you retain them, their lifetime value, and their overall experience with your business.
Importance of Measuring KPIs For Customer Experience
#1. Determining Customer Loyalty Rate
Loyal customers are the ones who are more likely to continue purchasing from your business. They don't owe you anything, so why do they do so?
It’s because of the ‘customer experience.’
93% of customers are likely to repeat purchases with brands that offer excellent customer experience. Not only this, but they are also willing to spend 5X times more on your products.
Customer experience KPIs help you track various metrics, such as Net Promoter Score (NPS) and customer lifetime value, to determine and identify your loyal customer base and estimate future sales performance.
#2. Identifying Areas of Improvement
Businesses can use these KPIs to identify the lagging and leading areas of customer experience.
To do so, you can monitor customer service procedures and sales service. This way, you can figure out whether your employee's knowledge gap or high customer expectations are making you lose customers.
Likewise, if a customer encounters a poor experience with your support team, you can also identify the cause behind it and modify your service protocol to ensure optimum customer satisfaction.
#3. Keeping Performance Aligned with the Objectives
Every business has its set goals and objectives. In the same context, the customer experience provided by the brand might also have some pre-defined expectations. Right?
For example, if a retail store sets an objective to increase customer satisfaction by 25% in 3 months, it can use various customer experience KPIs to measure the staff's progress in reaching that goal.
Businesses commonly use KPIs such as CSAT, bounce rate, and more to measure objectives that improve customer experience.
Let's now dive deeper into consumer experience KPIs and explore the 11 most important KPIs to track.
11 Customer Experience KPIs Every Business Owner Should Track
KPI #1. Net Promoter Score [NPS]
Let's start with the most common metric for measuring customer experience. Net Promoter Score (NPS) refers to the number of customers who are willing to recommend your product or service to their network.
Why Is It Important?
The first thing that strikes our mind is word-of-mouth marketing. A good net promoter means people are highly likely to recommend your product, and hence, more people get exposure to your brand.
Secondly, and surprisingly, the metric is not uncommon among most Fortune500 companies, including Apple, Airbnb, and more. So, how do we measure it?
NPS is typically measured with surveys that ask customers whether they'd recommend a company's products to a friend or colleague. Typically, these surveys have a scale from 0 to 10.
To ease the measurement, we can categorize the scores into three kinds of voters:
-
Detractors: People who vote between 0-5
-
Passives: People who use your product but won’t be recommending it to anyone, 6-7
-
Promoters: People who vote above 7
To calculate your final NPS, use this equation:
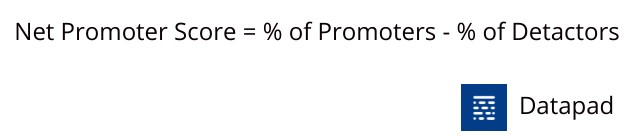
Note: NPS might tell you the numbers but doesn't answer the 'Why' for both parties. Apart from the survey question, you can add your personalized question to get better-informed data.
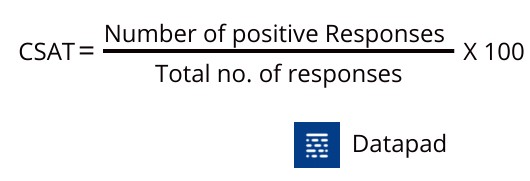
KPI #2. Customer Satisfaction Score [CSAT]
CSAT, with a mix of NPS, is a popular combination every business owner must track.
CSAT is a comprehensive KPI that allows you to gather up-to-date customer feedback after using your product or service.
Why Is It Important?
This KPI is commonly used in Google or Facebook review systems. Unlike net promoter score, CSAT can be for a specific product or service and can have many forms and scales.
The CSAT survey is taken immediately after a customer has made a purchase.
Pro Tip: Under-promising and over-delivering can lead to a positive customer satisfaction score.
In fact, most companies boast about their excellent CSAT on their website to attract more customers.
Evidently, a high CSAT demonstrates a customer-centric culture and also caters to an improved retention rate. Now, to measure customer satisfaction score, ask customers to rate their level of satisfaction on a scale of:
-
Very satisfied
-
Satisfied
-
Not Satisfied
And then, divide the number of satisfied respondents by the total number of respondents.
KPI #3. Customer Retention Rate [CRR]
Where NPS and CSAT give you a brief understanding of your retention efforts, customer retention rate specifically tells you where your retention efforts stand.
Customer retention rate, or CRR, measures the number of returning customers during a specific time period.
Why Is It Important?
80% of customers say that a company's experience is as important as its product or services. No wonder your retention rate is a prolific indicator of the overall customer experience.
Besides, the probability of selling to an existing customer is more than a new customer, while acquiring a new customer costs you 7X more.
In one way or another, retained customers are more beneficial for your business.
CRR is also directly related to customer churn rate. You see, a higher retention rate depicts that less number of customers are leaving your business, leading to a lower churn rate.
To determine your customer retention rate, you just need three numbers:
-
Customers at the start of a given period
-
Customers at the end of that period
-
New customers acquired during that period
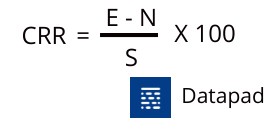
Here,
E refers to the number of customers at the end of a period.
N is the number of new customers gained during the same period.
And S is the number of customers at the beginning of the period.
For example, if you have 100 customers at the beginning of the month, and you lose 20 customers but gain 40 more during the month. Your CCR equals to:
0.8 X 100 = 80%
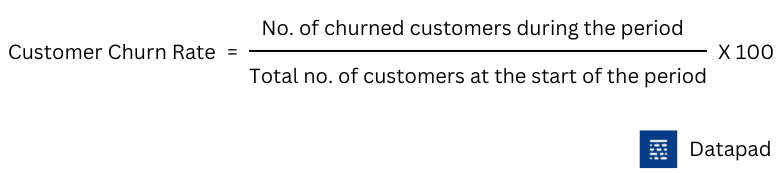
KPI #4. Customer Churn Rate
Customer churn rate measures how quickly customers leave or cancel their service subscription within a given period. Simply put, it measures the number of customers lost by your business during a specific period.
Why Is It Important?
Commonly measured as a percentage, churn rate is a critical metric to measure when it comes to customer experience. You may ask why?
The reason why people stop interacting with your business are directly or indirectly related to your overall customer experience. A low churn rate indicates that customers are satisfied with your services, while a high churn rate goes the other way around.
Moreover, when you combine churn rate insights with operational insights, you can identify areas that lag behind expected customer experience and can build strategies to improve the same.
Here's a simple formula to calculate the customer churn rate:
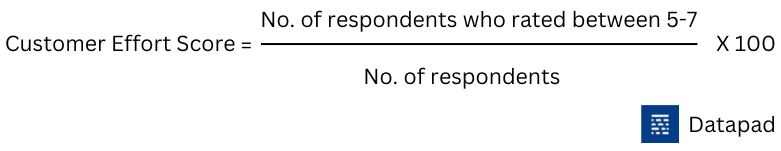
KPI #5. Customer Effort Score [CES]
Customer effort score measures the amount of effort required by a customer to complete an activity with your company. The action can be anything like looking for a product, making a purchase, or resolving a ticket.
Why Is It Important?
Your customer effort score is directly interlinked with the churn rate. You see, the more efforts customers require to interact with you, the more frustrated they get, and the more chances are of them being churned.
94% of customers are likely to make a purchase when they have an effortless experience with your brand.
It's just how freely and quickly things work for them!
Like NPS, the CES is also measured using a survey that asks customers questions about their engagement with the business. The survey can use a rating scale from 1 to 7.
Here, anything greater than 4 indicates an effortless customer experience.
Now, to calculate CES as a percentage, use the below formula:
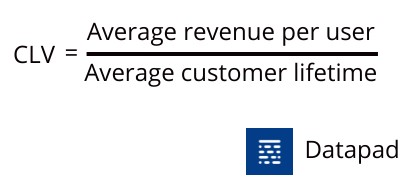
KPI #6. Customer Lifetime Value [CLV]
Customer lifetime value is a crucial metric to track as part of the customer experience program. It refers to the amount of revenue a customer generates during his relationship with the business.
Why Is It Important?
We may count CLV as a predictive metric, as it predicts the net profit obtained from a customer during the entire future relationship.
Factually, CLV goes hand in hand with certain KPIs such as acquisition cost, retention rate, and churn rate. Here's how they are related:
-
If CLV is more than acquisition costs, you are running high on profits
-
A high CLV demonstrates a promising retention strategy in place
-
While a low CLV accounts for an increase in customer churn rate
Besides, CLV is a great metric to use when you deal with a multi-year relationship with a customer – say, for a subscription-based service.
You can use the insights to forecast future revenue and identify pain points where customers stop using your services, thereby building better retention strategies.
Here's how you can measure CLV:
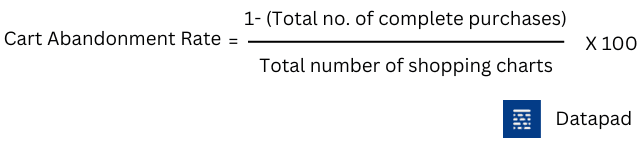
KPI #7. Cart Abandonment Rate
Cart abandonment rate refers to the number of times people added products to their cart but didn't complete the purchase.
Why Is It Important?
The average cart abandonment rate worldwide is just below 70%. That means 70% of visitors add a product to their cart but don’t complete the transaction.
They simply switch from making a purchase to ghosting you. Frustrating, isn't it?
This also costs brands approx $18 Bn annually. So even if you slightly improve your customer experience, you can earn a significant portion of the value.
However, many ways exist to improve customers' shopping experience and decrease cart abandonment rates. Here're a few:
-
Optimize your checkout process to increase conversion
-
Avoid adding hidden costs, and be transparent with your customers
-
Don't force customers to create an account until necessary
-
Make available all the popular modes of payments during checkout
Here's how you can calculate the cart abandonment rate:
KPI #8. Average Resolution Time
Average resolution time measures the time it takes for a customer service executive to resolve a customer issue. A good resolution time can be in the bracket of 5 to 6 minutes.
Why Is It Important?
Apart from the product or services you offer, customers are sensitive about the response they get from your customer support executives.
It might be they are stuck in the middle of a transaction and want quick assistance, or maybe they have raised a ticket - in both scenarios, your resolution time defines customer satisfaction.
Customers feel more prioritized and supported when you quickly answer their queries.
On another note, back in their subconscious mind, they feel that even if something goes wrong or they hinder another problem, you are there to help them.
For SaaS companies, the resolution time typically revolves around support tickets. While for other businesses, it can be from any channel the customer raised a query.
A low average resolution time means your customer support is very responsive, which results in happy customers.
Here's how you can calculate it:

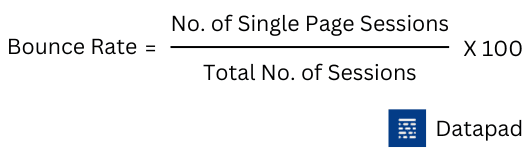
KPI #9. Bounce Rate
Bounce rate is a CX metric that refers to the percentage of visitors leaving a webpage without taking action. The action can be as simple as clicking a link or as complex as going through the checkout process.
In general, bounce occurs due to several factors, such as:
-
Slow page loading time
-
Poor UI/UX
-
Shaggy copywriting
-
Unstructured page layout
Note: Not every customer that bounces leads to a negative CX, so bounces might be planned, for example, taking a customer from your blog page to a product page.
Why Is It Important?
Let's take it this way, when you stop a visitor from bouncing, you are more likely to increase your conversion rate. Moreover, bounce rates are also considered a significant factor impacting your website's Google search ranking.
In context to customer experience, a higher bounce rate indicates that customers are not blending in well with the content of your website. Or maybe:
-
They didn't find what they were looking for
-
They didn't like the design of your landing page
-
They weren't persuaded enough by your copywriting
A higher bounce rate indicates a poor customer experience and impacts your conversion rate and revenue side-by-side.
The average bounce rate is between 41% to 51% but varies based on the industry and nature of the business.
However, getting close to or below this number can help you improve your overall customer experience.
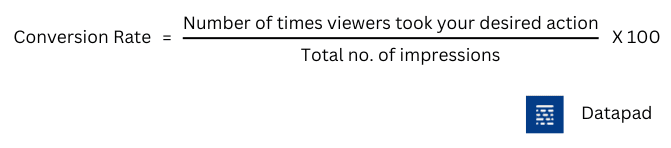
KPI #10. Conversion Rate
Conversion rate refers to the percentage of website visitors that complete an intended action - click a link, fill up a form, or make a purchase.
Why Is It Important?
The conversion rate is highly dependent on the customer experience. Optimizing the experience across the customer journey can significantly help you boost conversion rates.
An increase in conversion rate means that prospects are moving along the buyer funnel incentivized by the customer experience.
Conversion rate, however, is measured for advertisements and marketing campaigns. They help you figure out how well people resonate with your ads and if your ads cater to the right audience.
Here's how you can measure the conversion rate:
KPI #11. Customer Service Satisfaction [CSS]
Finally, the last but one of the most important customer experience metrics is customer service satisfaction. This KPI measures how satisfied your customers are with your after-sale service.
Why Is It Important?
At this point, we all know customer experience isn't limited to the sale of goods; it goes beyond that.
The return, warranties, exchanges, and 24/7 support promises - you need to deliver them all. Here's when CSS comes into play.
You can measure CSS by asking your clients for feedback whenever they interact with your customer support executives.
It can be through any medium, such as forms, live chats, pop-ups, ratings, and online surveys.
Keeping these surveys consistent will help you understand your customer service department's leading and lagging areas. Thereby allowing you to allocate resources effectively.
How to Track Customer Experience KPIs in Datapad?
Datapad is a mobile-friendly KPI tracking and dashboarding platform that allows business owners to collect, monitor, and analyze customer experience KPIs from their fingertips.
Our tool does so with its highly responsive mobile app. The Datapad app comes along with all the features that a typical desktop dashboarding tool provides. From automatic data import to drag-and-drop customizations - Datapad has it all.
Plus, creating dashboards in Datapad is no more than a 3-step process. Let's see how we can do it:
Step 1: Download Our App
Our app is available for both iOS (App Store) and Android (Play Store) devices. Plus, we tested the compatibility of our tool with all known small-screen devices. And guess the results?
Datapad is pixel-perfect for all screen sizes.
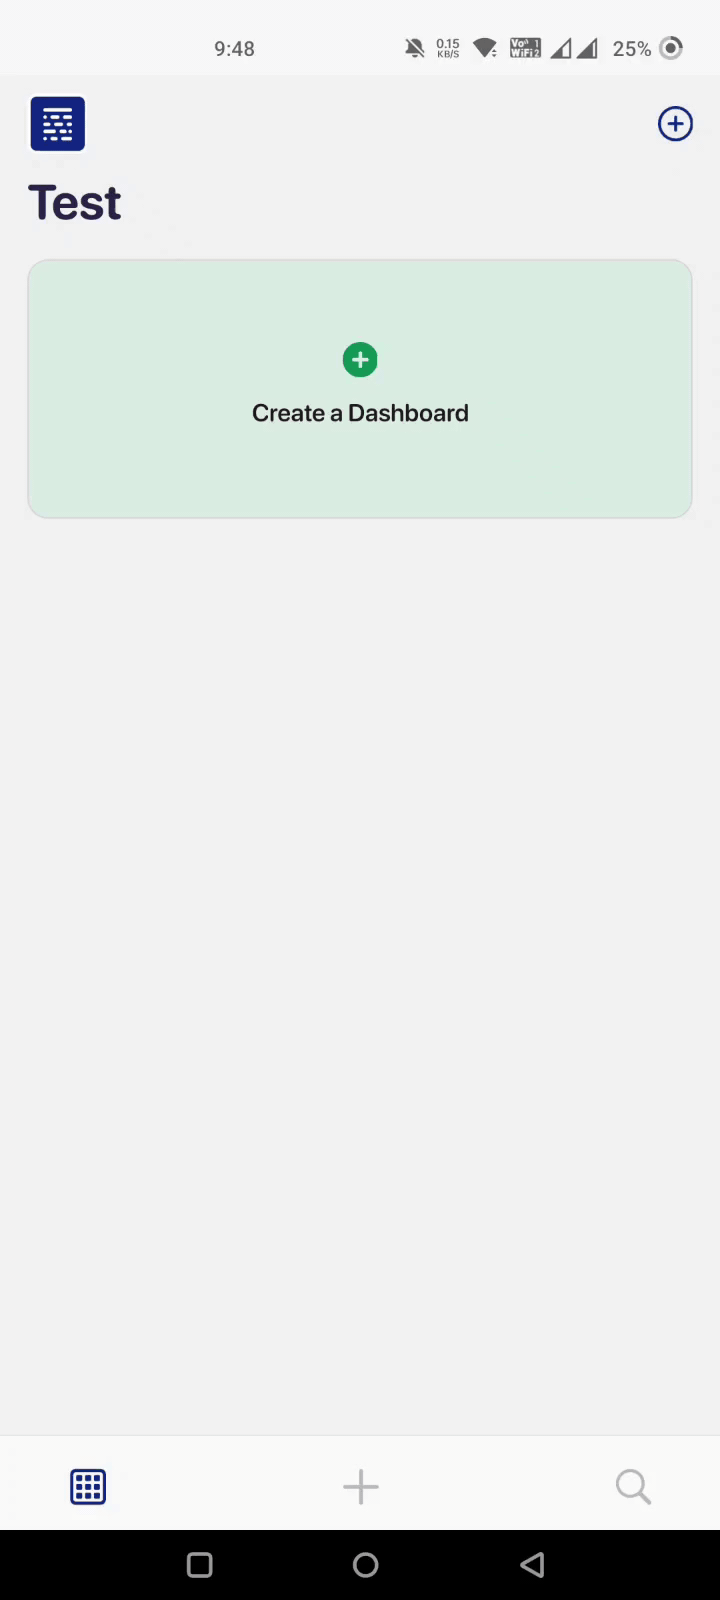
To begin the dashboard creation process, open the app and sign up with your preferred email address.
Wait for a few seconds until we verify your email, and then press the '+' sign in the top right corner.
Give a name to your dashboard, choose an emoticon and click on Create.
Your dashboard has been created automatically.
Step 2: Import Data to Your Dashboard
You might have tons of customer-centric data waiting to be visualized, so we eased the process a bit. With Datapad, you import data both automatically and manually.
Generally, customer reviews, ratings, and feedback are kept in Google Sheets. You can easily import data within minutes by using our one-click integration to popular data points such as Google Analytics, Google Sheets, and many more databases.
Here's how you can leverage Datapad to import data automatically:

In case of data mishandling or missing data pieces, you can always switch to a manual process to enter data manually. Here's how you can do it:

Step 3: Bring Your Team Onboard
Your customer service executives and sales reps would be excited to see how they are serving the customers. So let's bring them on board.
With Datapad, you can simply enter the emails of your team members and send them email invites to get them onboard. Rest assured, Datapad has a flat learning line. It's a complete no-code platform, so you can get started as soon as your team gets on board.

Apart from this, Datapad has much more to offer:
-
Customize KPIs and dashboards to fit your brand color, mission, and vision
-
Search specific KPIs when short on time and track them on the go
-
Comment under KPIs to start a discussion in real-time
-
Set permissions for who can view and edit specific KPIs and dashboards
And much more.
So sign up for our free-to-use mobile app, create a dashboard, and track customer experience KPIs like a pro!