
‘Romeo and Juliet,’ ‘Love and hate,’ ‘Profit and loss,’ ‘Health and Wealth.’
These are a few words that go hand in hand. From a business perspective, ‘health and wealth’ are close allies. If one goes down, it has the other with it, and the consequences aren’t great.
Financial KPIs are something that helps you monitor both business health and business wealth simultaneously.
In this article, we will walk you through financial KPIs, how they differ from operational metrics, and the best 30 financial metrics every business owner should track.
What are Financial KPIs?
Financial KPIs (Key Performance Indicators) are metrics organizations use to measure their financial health. These KPIs don't just stick to core finances like revenue or profits; they measure every data that has an essence of finance in it.
Financial KPIs, generally, are classified into four categories, namely:
-
Profitability
-
Liquidity
-
Solvency
-
Efficiency
-
Valuation
By understanding these KPIs, you are in a better mindset to analyze your business's financial performance. Moreover, you can use the knowledge to iterate your strategies and objectives at any point.
Why Are Financial KPIs Important?
-
🩺 Monitoring Business health: Financial KPIs measure your business's overall health and monitor your present revenue and profits, compare past results, and forecast future revenue accumulation. Moreover, they dive deeper into your business's operating cash flow to see if things are running smoothly. Under time-sensitive situations, with the help of financial KPIs, you can foresee any campaigns or strategies hampering your company's health and improvise on them.
-
🤔 Decision-Making: Progressive decisions are made with adequate capital in hand. Among the various uses of financial KPIs, perhaps one of the most important functions is that they help keep the business objectives the primary focus when making decisions.
-
📈 Projecting Growth: Undoubtedly, revenue and profits are the best ways to measure a company's growth over time. But there's more; financial KPIs convey critical information under sensitive situations, such as when you're deviating from the plan or signs of a negative trajectory. You can use this information to mold your strategies as per market needs.
-
🚧 Creating Budgets: Annual budget meetings would be havoc if core financial data were missing. Therefore, certain KPI dashboarding tools, like Datapad, allow you to collect, measure, and present financial data via beautiful dashboards to stakeholders.
-
💸 Measuring ROI: What did your business gain from investing money into something? May it be a campaign, advertisement, assets, or employees. Certain KPIs like Return on Equity, Return on Investments, Return per Share allow you to measure the capital gains you receive from multiple investments.
What is the Difference Between An Operational KPI and a Financial KPI?
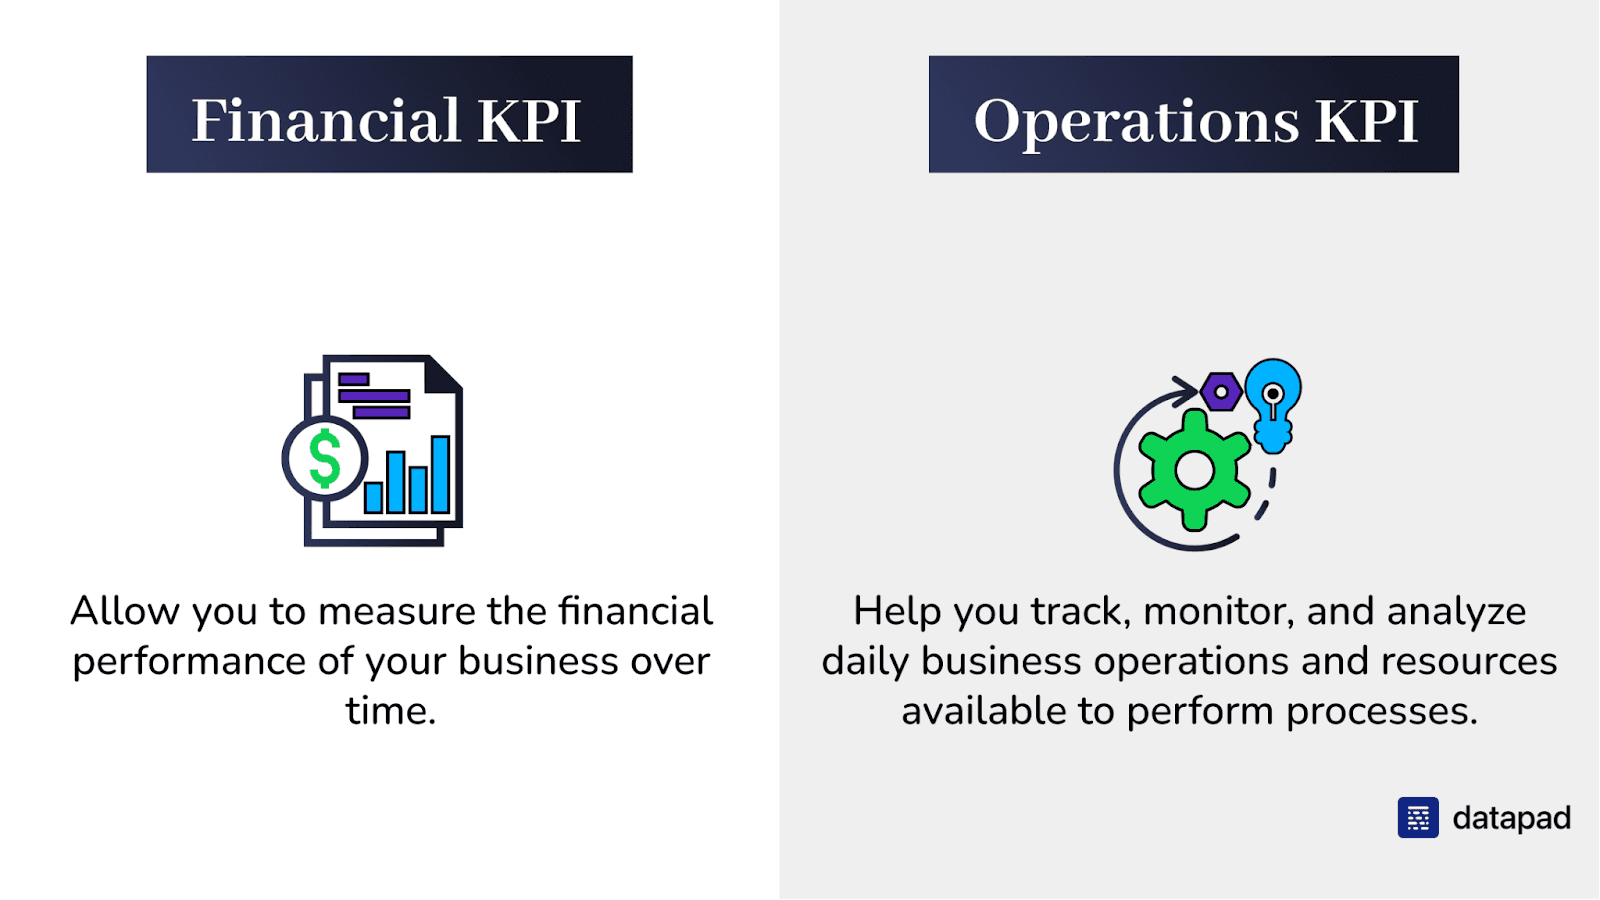
Finance and operations are part of core business functioning. While financial metrics provide information necessary for the survival of a business. The operations KPIs, on the other hand, oversee the execution of day-to-day tasks.
Now, while both KPIs are directed toward the well-being of different departments, some organizations tend to correlate the two.
Let's get this straight.
Operation KPIs might include financial figures, such as working capital, operating cash flows, and cash conversion cycle.
But on the other hand, they also include non-financial data such as employees, customers, supply chain, leads, etc.
While financial KPIs help you determine your operational achievements from a financial perspective, operational KPIs are generally measured for the short term.
The goals and objectives of these KPIs are clearly poles-apart:
-
Financial KPIs focus on the profitability, liquidity, and valuation of a business
-
Operational KPIs focus on productivity, efficiency, and smooth functioning of operations
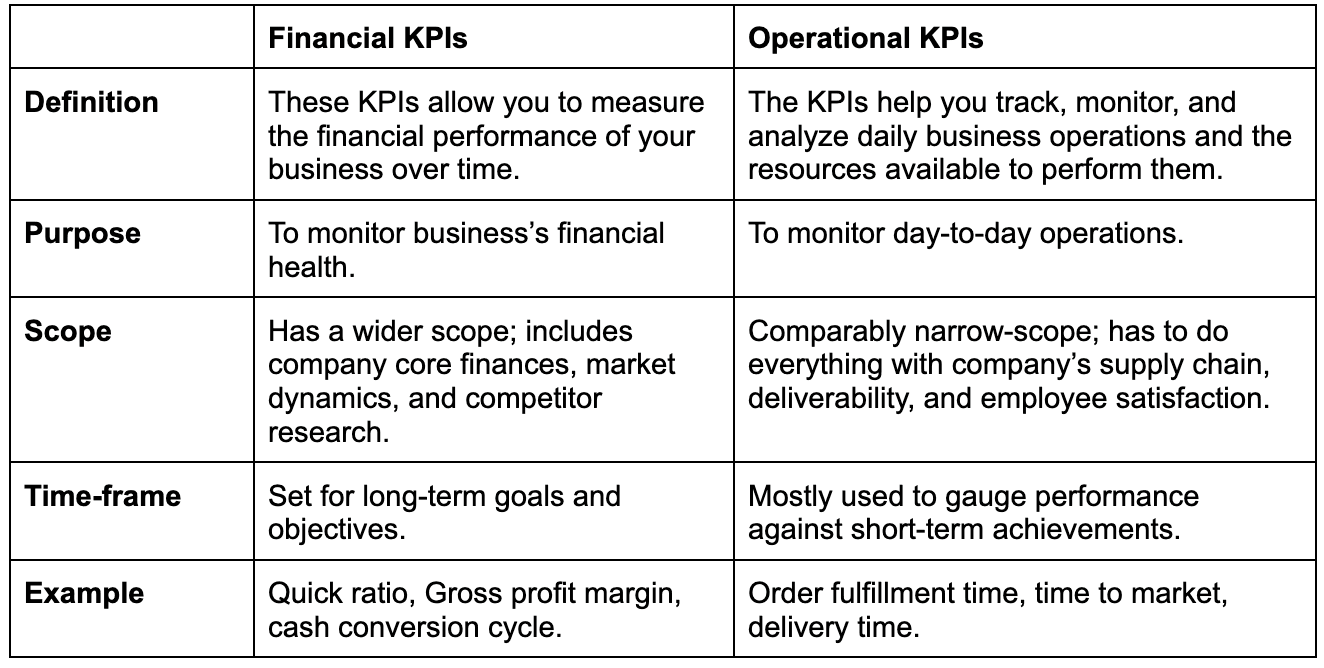
To summarize our thoughts on operational and financial KPIs, here's a quick overview:
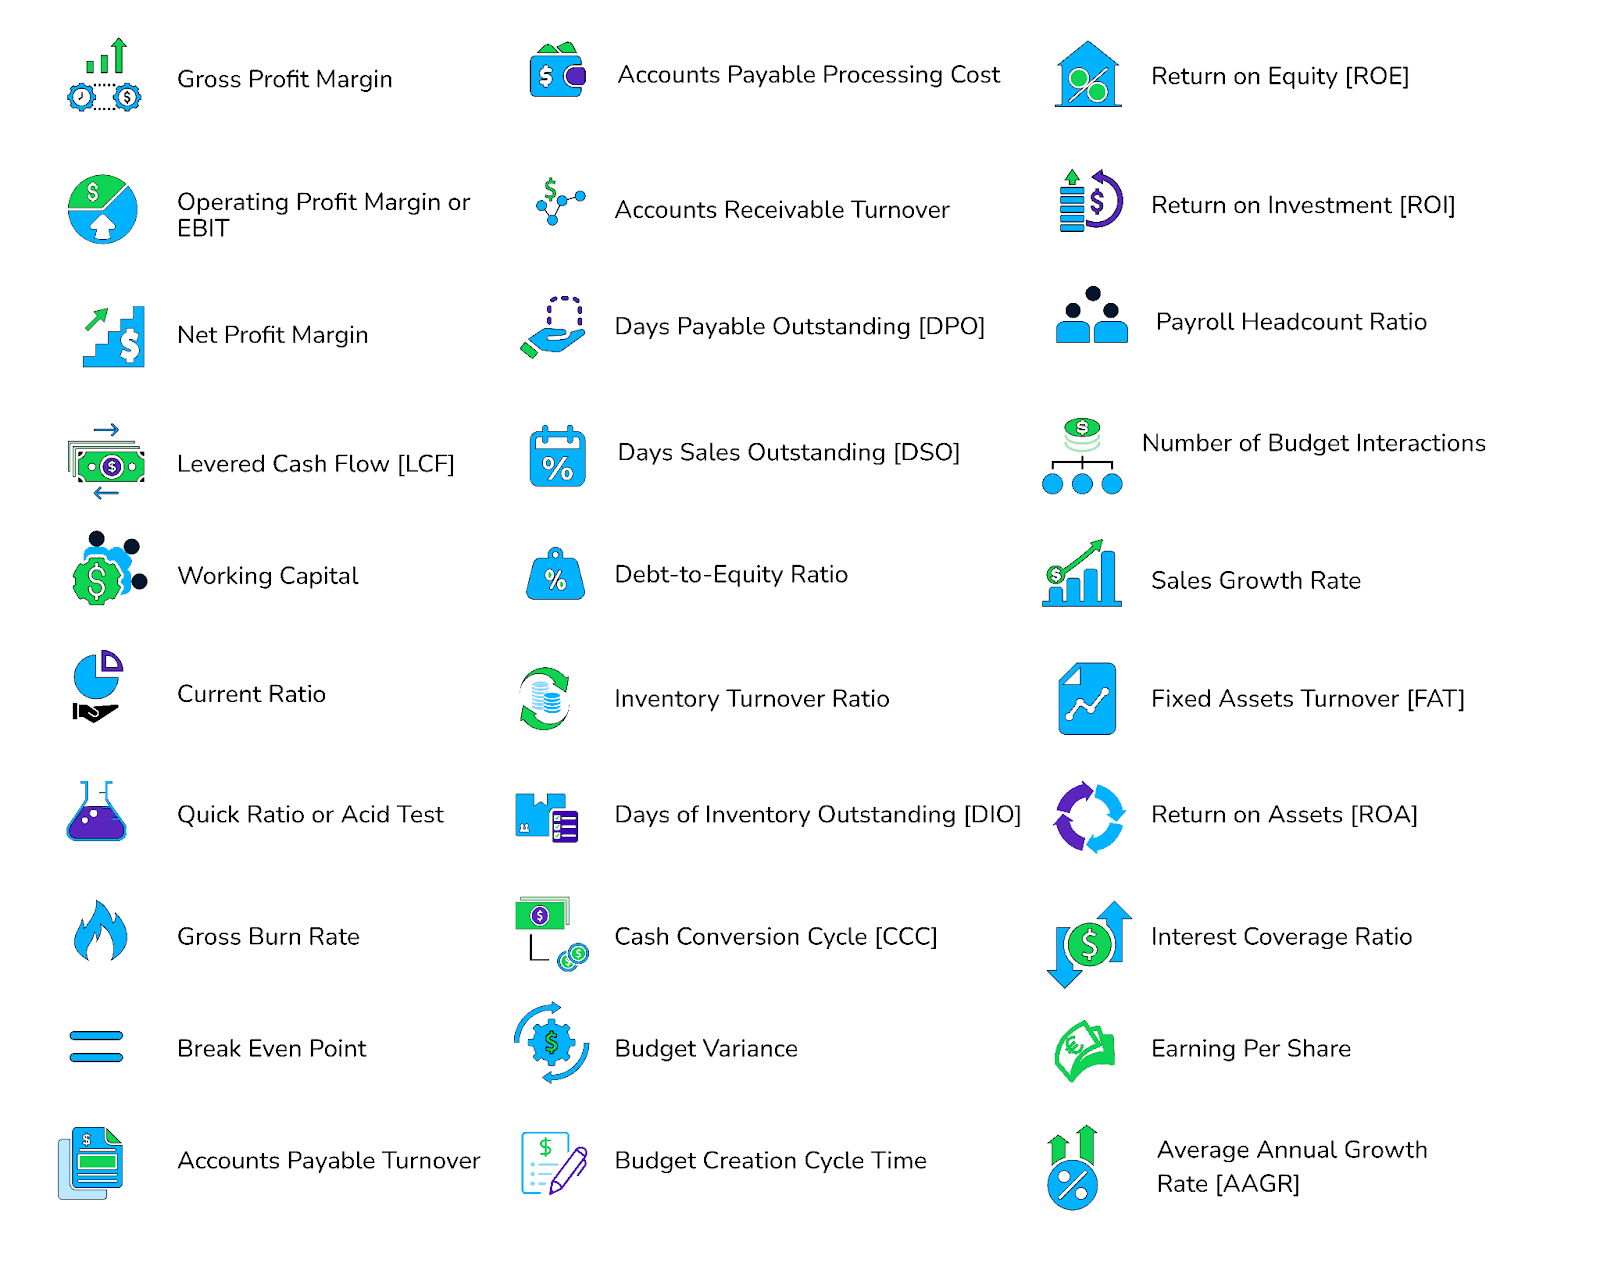
What Are the 30 Financial KPIs You Should Track to Stay on Top of Your Financials?
KPI #1. Gross Profit Margin
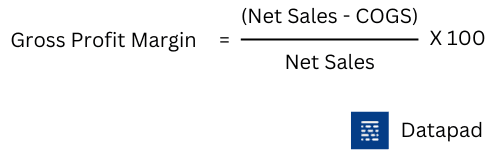
Gross profit margin, commonly referred to as gross margin, is a profitability KPI that measures the amount of revenue left during a given accounting period after deducting labor and material expenses.
Why Is It Important?
As said, this metric measures the profitability of a business. It calculates the profit earned from each dollar of sales.
Moreover, the metric is an excellent indicator of a company's financial health. It indicates whether the business is capable of handling its operating expenses while retaining money for growth.
KPI #2. Operating Profit Margin or EBIT
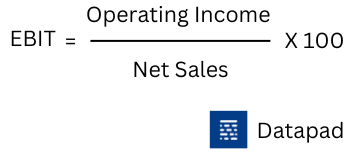
Operating profit margin, popularly known as earning before interest or taxes (EBIT), measures the revenue earned by the company after deducting operating expenses, excluding interests and taxes.
Why Is It Important?
Operating profit is also a profitability metric; it calculates the leftover profit after deducting operating expenses. The higher the EBIT, the more profitable your company is likely to be.
If this trajectory declines over time, you might need to identify the pain points and work on improvements quickly.
KPI #3. Net Profit Margin
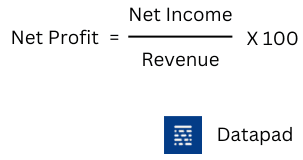
This KPI measures the sum of revenue left with the company after accounting for all its expenses; this includes short-term and long-term debts, operating expenses, and interests and taxes.
Why Is It Important?
Net profit margin is the ultimate profitability metric. You see, it's the money that stays with you after you've cleared out all your debts and liabilities.
Also, it's a popular metric that helps you compare your business's efficiency to convert sales into profits. As a rule of thumb, a net profit margin above 10% is considered acceptable.
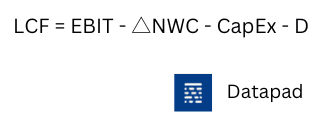
KPI #4. Levered Cash Flow [LCF]
Where,
-
EBIT refers to earnings before interest and taxes
-
NWC means a change in net working capital
-
CapEx refers to capital expenditure
-
D equals mandatory debt payments
Levered cash flow is the amount of money left after all the company's financial obligations are met.
Why Is It Important?
LCF defines a company's ability to expand its operations and pay returns to stakeholders. A higher levered cash flow means a higher dividend for shareholders and maximum capital retention for business expansion.
However, even if the levered free cash flow is negative (for a while), it doesn't necessarily mean the company is failing.
As long as the company holds the necessary cash to survive, a negative LCF is both survivable and acceptable.
KPI #5. Working Capital

Working capital measures the surplus of current assets available to meet short-term financial obligations, specifically day-to-day company operations. The current assets can be available cash, investments, accounts receivable, and more.
Why Is It Important?
Working capital is a liquidity metric, i.e. it measures the ability of a business to generate cash quickly. This cash is not based on assumptions; it's hard-core cash ready to be put to work.
A cash-deficit company may find it hard to survive in the market. Hence, a high working capital demonstrates a healthy business.
However, a surprisingly higher working capital may indicate that your assets are not being utilized to the fullest or the firm is not investing surplus money.
KPI #6. Current Ratio
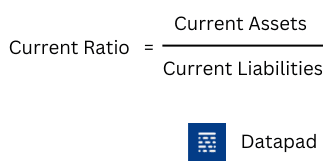
The current ratio measures an organization's ability to pay its short-term liabilities within a year. Unlike working capital, this KPI expresses itself in ratios instead of dollars.
Why Is It Important?
A Current Ratio of less than one indicates that your company will not be able to fulfill all financial obligations for the year unless there's an additional cash flow.
Financial experts say a healthy current ratio is between 1.5 and 3. Moreover, stakeholders generally use the current ratio to evaluate a company's operating cash flow.
KPI #7. Quick Ratio or Acid Test
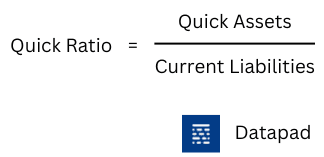
Another ratio defining the liquidity of a company is the quick ratio.
This KPI measures the amount of current assets that can be quickly converted into cash to meet short-term financial obligations. Unlike the current ratio, which considers payments for the year, the quick ratio focuses on immediate cash.
Why Is It Important?
Quick assets are the ones that can be quickly converted into cash. In other words, quick assets are current assets like inventory.
The metric also demonstrates the company's ability to generate quick cash if experiencing cash flow problems.
KPI #8. Gross Burn Rate
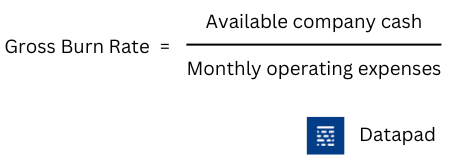
The gross burn rate reflects the rate at which a company uses its available cash to cover its operating expenses.
Why Is It Important?
This is a common KPI among loss-generating startups. You see, as a startup founder, the foremost thing you measure is the amount of cash available to carry out daily business operations. It's a fundamental metric for small firms that do not undertake heft financial analysis.
A higher burn rate indicates a shortage of funds to cover daily expenses unless additional finance is brought into the business. Being said that, investors often consider a company's gross burn rate to decide whether to provide funding or not.
KPI #9. Break Even Point
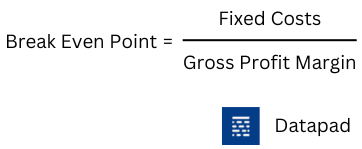
The Break-even point represents that stage of a business where the total revenue generated equals the total cost incurred.
Why Is It Important?
The Break-even point is a situation of no profit or loss. Here, all your costs have been recovered in full. Whatever you earn after this point is considered as profits.
Businesses generally measure it by how many units of products they need to produce and sell to break even.
KPI #10. Accounts Payable Turnover
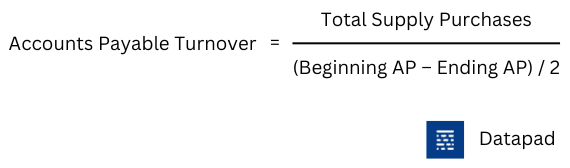
Accounts payable measures the pace at which you pay your suppliers. It basically measures a company's ability to clear out short-term debts.
Why Is It Important?
This KPI is best for measuring financial stability. It measures the efficiency of financial teams and the business's reputation with its suppliers.
An increase in the AP ratio indicates you have surplus cash in hand and are paying your suppliers faster and faster.
Down the lane, this will help increase your rapport with vendors, and you may be privileged to discounts based on quick payments.
KPI #11. Accounts Payable Processing Cost
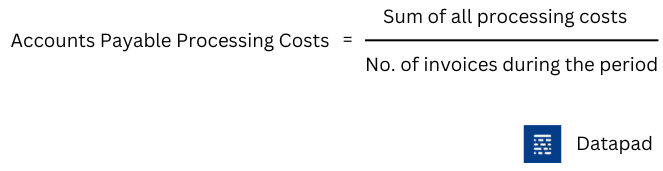
Accounts payable processing cost, popularly known as cost per invoice, measures the processing cost incurred on paying bills to suppliers.
Why Is It Important?
Business finance is not just about overall revenue and profits. It's an establishment built on several bricks of minimal transactions. Thus, cost-cutting is significant whenever and wherever possible.
Generally, processing costs include bank charges, mailing costs, labor, and overheads. Since cash out-flow is something a business can’t ignore, this KPI is preferably measured on a weekly or monthly basis.
As of today, several businesses have switched to email invoices or e-billing to decrease invoice processing charges.
KPI #12. Accounts Receivable Turnover
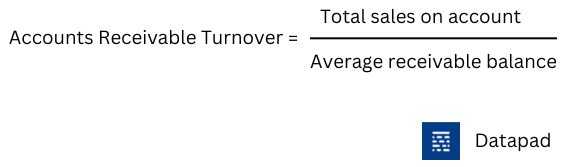
Accounts receivable turnover measures how efficiently a business collects payments from customers.
Why Is It Important?
A book filled with credits is nothing more than interest-free loans, which you could otherwise use to expand your business. Besides, a positive AR ratio strengthens a company's operating expenses.
KPI #13. Days Payable Outstanding [DPO]
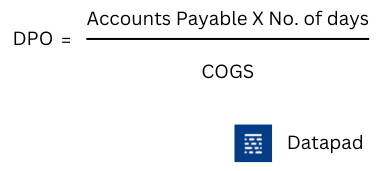
Days payable outstanding is a financial ratio that measures the number of days it takes for a company to pay out its suppliers.
Why Is It Important?
DPO is a somewhat granular metric as it tells you exactly the time (in days) it takes for you to pay your debts. Indirectly, these insights provide a glimpse into your company's financial health.
A high DPO can be a good or bad indicator for you; it can mean:
-
Your business is retaining capital for long enough to make investments and expand business
-
Your business doesn't have the required capital and thus requires additional finance to pay off the debts
KPI #14. Days Sales Outstanding [DSO]
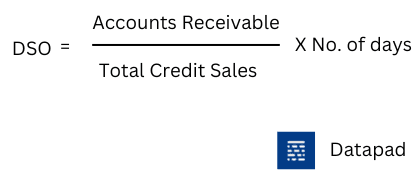
Days sales outstanding (DSO) measures the average number of days it takes to collect payments for a sale.
Why Is It Important?
Now, this metric is essential if you're lending products on credits or on an EMIs or subscription basis, requiring monthly evaluation.
Besides, given the operating expenses of a company, it's in their best interest to speed up the collection process to maintain healthy operational cash flow.
KPI #15. Inventory Turnover Ratio
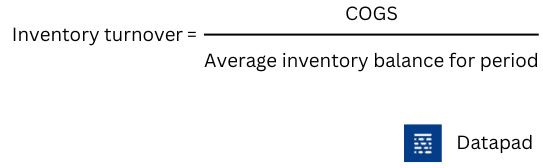
The inventory turnover ratio measures the number of times your company clears out all its inventory during a given period.
Why Is It Important?
Insights driven by this KPI can help you make better pricing, production, marketing, and purchasing decisions. Generally, the higher the ratio, the better.
A lower ratio might indicate weak sales strategies or inventory pile-up. It can also mean you’re not purchasing the product that's in demand; hence, you're unable to sell it.
KPI #16. Days of Inventory Outstanding [DIO]
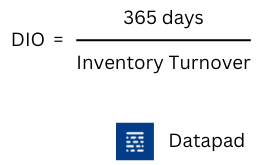
While inventory turnover calculates the number of times inventory was turned over, DIO measures the number of days it takes to turnover inventory, typically in a fiscal year.
Why Is It Important?
This metric explicitly measures the average time it takes to sell off your inventory. As a result of this, allowing you to schedule new orders before D-day. Moreover, since you know a time frame, you can get prepared with order lists and purchase cash beforehand.
For e-commerce industries, this metric can help with better inventory management and also prevent them from receiving orders for out-of-stock items.
KPI #17. Cash Conversion Cycle [CCC]
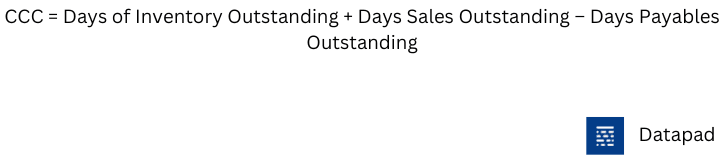
The cash conversion cycle measures the time a company takes to convert its inventory investment back into cash.
Why Is It Important?
It's a crucial metric to evaluate the efficiency of your operational and managerial departments. The longer it takes for a company to convert its inventory into cash, the longer the money is tied up in the inventory, and neither can it be used nor counted as revenue.
KPI #18. Budget Variance
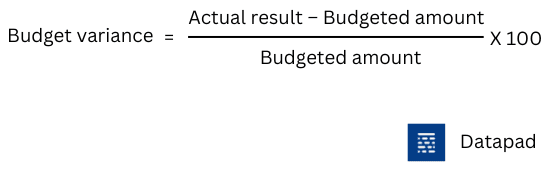
Budget variance, as the name indicates, compares the project budgets to the actual budget total to identify any surplus or deficit in allocated budgets.
Why Is It Important?
Budgets are set for a purpose, and that is to complete a particular task under the forecasted expense and resources.
In case, intentionally or unintentionally, there is a variation from the forecasted budget, it must be accounted for.
This metric evaluates whether the budgeted or baseline amount of expenses or revenue meets the expectations. A lower budget variance indicates that the actual expenses are lower or equal to the allocated budget. In contrast, a higher budget variance goes the other way around.
KPI #19. Budget Creation Cycle Time

This pretty straightforward metric measures the time taken to create a company's budget.
Why Is It Important?
The time taken to create a budget is idle for stakeholders or financial teams. It indicates the time taken to research, plan, and agree on a final budget. The longer the time frame, the more resources you're exhausting in terms of staffing, business hours, and brainstorming meetings.
KPI #20. Return on Equity [ROE]
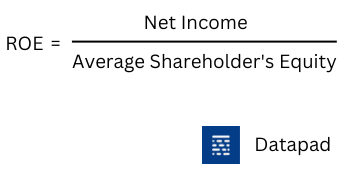
Return on equity is a profitability ratio that measures a company's net income to its shareholder's equity.
Why Is It Important?
This metric determines a company's efficiency in utilizing its shareholder's equity. A low ROE indicates that the company is not effectively using the shareholders' investments.
It also demonstrates that a shareholder can get a better ROE investing elsewhere. Therefore, a company always aims for a higher ROE to retain maximum shareholders.
KPI #21. Return on Investment [ROI]
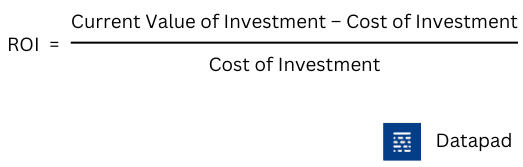
This KPI measures the amount of money an investment generates to the cost of investment.
Why Is It Important?
As a business owner, every investment you make must yield results. This is because you're making an investment as a company, and every investment is answerable to stakeholders and should thrive on revenue gains or business expansion.
KPI #22. Payroll Headcount Ratio
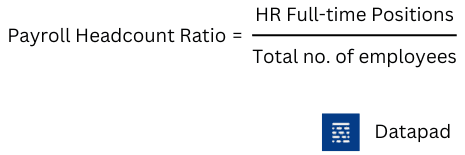
The KPI is specific to the HR department of the organization. It measures the total no. of full-time employees involved in payroll processing to the number of employees.
Why Is It Important?
Typically, organizations track this KPI to measure the efficiency and productivity of the HR department. In a scenario where the number of employees per HR specialist becomes more, the company can lay out strategies and resources to delegate workload.
KPI #23. Sales Growth Rate
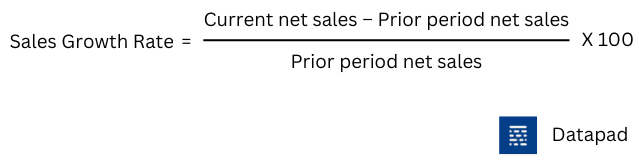
Sales growth rate refers to the net change in total sales during a given period of time. It's a typical revenue metric that can gauge your sales growth over time.
Why Is It Important?
Sales are a vital part of the company finance ecosystem; thus, they always aim toward growth. However, a company's sales might take a hit due to internal or external factors. Therefore, sales team managers are keen on measuring and comparing sales time after time.
KPI #24. Fixed Assets Turnover [FAT]
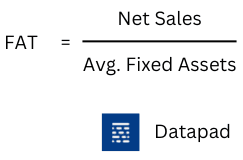
Fixed assets turnover is an efficiency metric representing how well a company uses its mixed assets to generate sales.
Why Is It Important?
This KPI is essential to companies that invest in PPE (property, plants, and equipment). A higher FAT indicates that the company is efficiently utilizing its fixed assets to generate more sales, while a lower FAT goes the other way around.
KPI #25. Return on Assets [ROA]
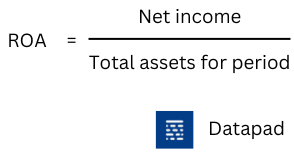
Return on assets is a broader concept than fixed assets turnover. The KPI measures the efficiency of a company's management to generate profits from its assets (current and fixed).
Why Is It Important?
Suppose you purchase two cars each for your top executives. Although it's an asset to the company, the return on this investment doesn't feel great. That’s because a car is a depreciating asset.
Likewise, the profit you can generate from revenue collected from accounts receivables, days of sales payables, and equipment utilization – everything accounts for the overall return on assets.
KPI #26. Interest Coverage Ratio
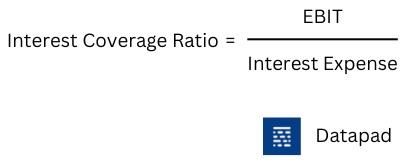
The interest coverage ratio measures the ability of a company to pay off the interest on its debts.
Why Is It Important?
The ‘coverage’ here stands for the time frame. Investors and lenders typically use this ratio to determine the company's uncertainty on current debts or future borrowings.
A lower ICR represents the company's inability to pay interest on loans and debts. For the most part, the company's capital strength becomes questionable if the ICR drops below 1.5.
KPI #27. Earning Per Share
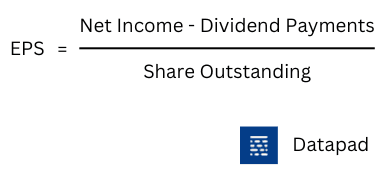
Earning per share refers to the amount of money a company makes from each share of its stock.
Why Is It Important?
You might have heard of EPS quite often; after all, it's the most quoted financial metric. Lenders, investors, and creditors often use EPS as a measurement of a company's profitability and also as a way to estimate its market valuation.
KPI #28. Debt-to-Equity Ratio
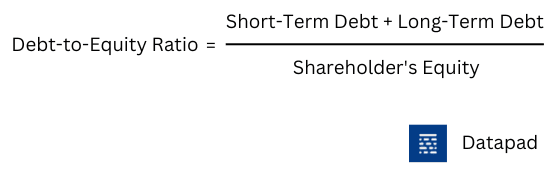
Like Return on Equity, this KPI measures how effectively a company uses investments to increase revenue and drive profits.
Why Is It Important?
The debt-to-equity ratio typically measures the company's liabilities against the shareholder's equity. A ratio greater than one indicates that the company is losing investments and accumulating debt, which might worsen during downtime.
KPI #29. Average Annual Growth Rate [AAGR]
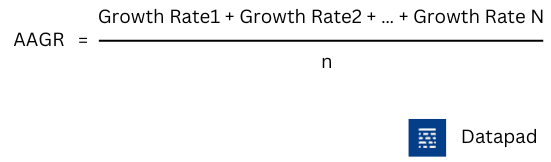
Where,
n is the number of years over which the growth occurred
The average annual growth rate, or AAGR, calculates the average annual return of an asset, investment, or any growth that is measurable.
Why Is It Important?
Generally, investments and assets pay acceptable returns over many years. So, certain KPIs such as ROI, ROE, and more are not the best metrics to track long-term returns. AAGR is the best replacement as it calculates annual growth.
KPI #30. Number of Budget Interactions
Lastly, a pretty simple KPI, but one that can tell you a lot about your management. Number of budget interactions measures the number of times a set budget is iterated or changed due to external or internal factors.
Why Is It Important?
Frequent interactions in budgets can promote unhealthy culture in the organization. Even employees might feel distracted due to often budgetary changes for marketing, remunerations, or salary hikes.
How to Track Your Financial KPIs For Free with Datapad?
Datapad is a mobile-friendly KPI dashboarding tool that allows data-driven leaders and finance enthusiasts to collect, analyze, and present overall financial performance via easy-to-understand dashboards.
Unlike typical desktop dashboarding platforms, our tool gets everything done on your mobile. That's right, you don't need to sit and stare at your desktop for hours.
All you need is our mobile app and a working internet connection to get all your financial data under one roof.
We tested Datapad for resolution, responsiveness, and compatibility before giving it into your safe hands, so you don’t need to worry about the UX.
Besides, our tool has much more to offer. With Datapad, you can easily:
-
Comment and collaborate under KPIs in real-time
-
Enable role-based management to control who can view/edit/access dashboards
-
Invite team members via emails and assign tasks and duties
-
Import data via manual and one-click integrations
-
Comes with pre-built data visualization elements to quickly design dashboards
-
Use intuitive drag-and-drop functionality for hassle-free customizations (absolutely no coding required)
Creating your first financial dashboard has now become easier than ever. Just scan the QR code below, and start using Datapad like a pro!
