Are you tired of searching for perfect KPIs for your business needs?
Well, we understand KPIs and metrics vary from business to business. But yet, there are ample amounts of KPIs that cater to every business need.
No wonder they are so common for small businesses, mid-sized companies, or large enterprises.
So here in this article, we will walk you through Key Performance Indicators (KPIs) and their importance. We'll also tell you how you can escape the mirage of vanity metrics and discover the best 30 KPIs that your teams can track in 2022 and beyond.
But first, let’s answer a more basic question…
What Is a KPI?
Key Performance Indicators, popularly termed KPIs, are quantifiable measurements used by businesses to gauge their overall performance.
A KPI adds a numeric value to anything you measure – company finances, operations, growth, customer experience, and employee productivity.
Here’s one example of how you can leverage KPIs:
Suppose you're a lead generation company, you can set specific KPIs that act as small targets for your employees to achieve during a period. These KPIs can later be used for three significant purposes:
-
To measure progress and streamline processes
-
To evaluate the performance of employees
-
To demonstrate your achievement to clients
Why are KPIs important?
From measuring performance to presenting data in an easy-to-understand format, KPIs do it all. Here are the three reasons every business nowadays tracks KPIs.
Reason #1. Comparing Performance and Measuring Progress
With the help of KPIs, you can quickly pivot to both phases of your business, which are:
-
How well are you doing as compared to your past performance?
-
What does your performance in the coming years look like?
Since you have the historical data of your performance, you can always compare them to measure improvements. Meanwhile, you can gauge your progress toward set goals and business objectives in real time.
Reason #2. Boost Employee Morale
KPIs are not limited to outlining the company's performance. Instead, they have roots deeper into your organization.
They help you set goals for your team. While your team is aware of why they are doing what they are doing; they are more productive and determined to achieve the set business goals.
This keeps your team intact and motivated in the long run.
Reason #3. Make Better Data-Driven Decisions
Key performance indicators provide real-time snapshots of your business’s performance. Since you're part of a highly competitive market, measuring your growth and strategies would be vital to 'beat' the competition.
Besides, insights generated from tracking KPIs are highly accurate (if measured perfectly) and can be used to forecast future revenue and iterate strategies.
Now that you know the basics of KPIs, it’s time to understand vanity metrics.
What KPIs Are Considered Vanity Metrics?
"One rotten apple can spoil all the remaining ones in the fruit basket."
This fits best when talking about KPIs' relationship with vanity metrics. You see, vanity metrics are data that seem impressive at a glance but don't really provide actionable insights to boost business productivity or ROI.
For example, consider a website's landing page for an eBook download. Measuring the number of page views is a metric, but it doesn't qualify or help you make any specific decisions.
On the other hand, measuring the weekly or monthly download rate might help you set goals or test different tactics for improving it.
In context with the above example, there are a ton of vanity metrics, such as the number of likes, shares, views, unique visitors, etc.
So should you stay completely away from vanity metrics?
The answer is both no and yes.
If you're just a small business, you should stay away from vanity metrics and focus on more specific KPIs.
For example, instead of tracking the traffic on your website, track the number of signups or the number of people who are taking a free trial of your app/software.
You can track vanity metrics when you are a significantly big organization and are already tracking specific KPIs. Tracking vanity metrics at that point makes complete sense.
To avoid vanity metrics, ask the questions when setting KPIs:
-
What business decision can we make with the metric?
-
What can we do to reproduce the results intentionally?
-
Is the data a real reflection of the truth?
Or even better, a tried-and-tested way to escape the vanity metric pitfall is by keeping your KPIs SMART - Specific, Measurable, Attainable, Relevant, and Time-Bound.
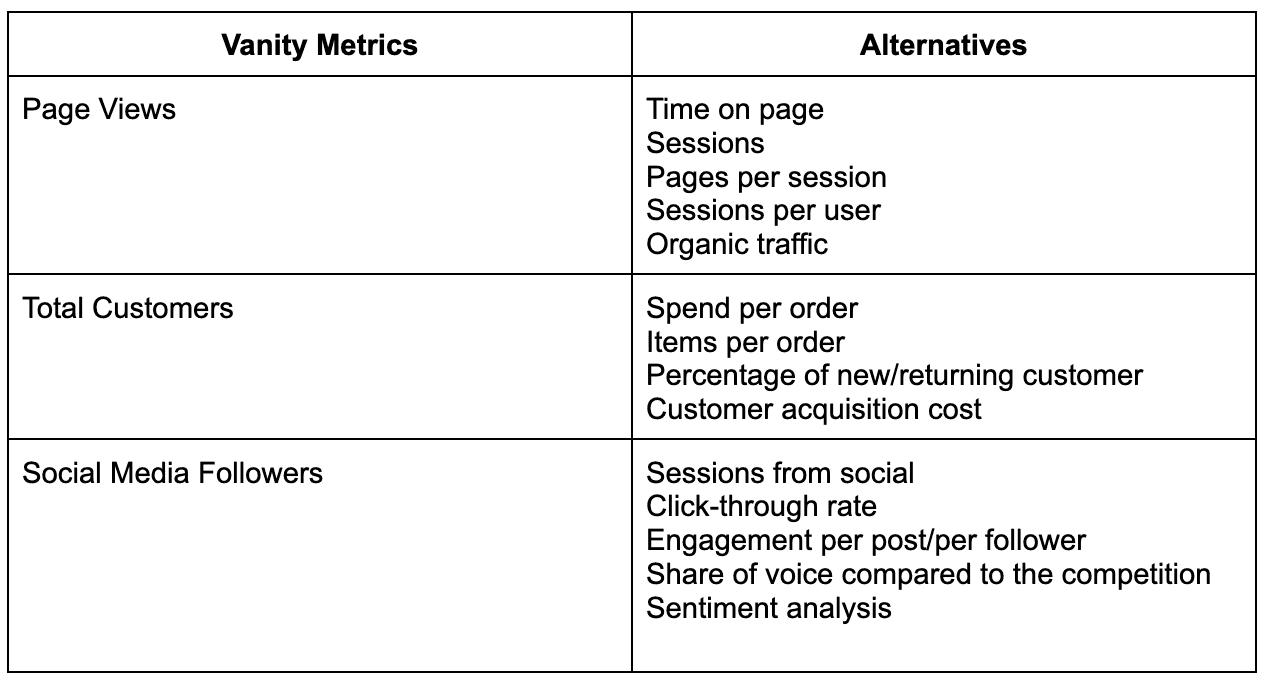
Examples of Vanity Metrics (And What to Track Instead)
30 Common KPI Examples for Every Vertical
A business has so many verticals; tracking KPIs for every vertical is tough. But you can’t just ignore it because it's tough, right?
So here are the 30 best KPIs you should track for verticals like business, sales, marketing, operation, CX, and finance.
Business KPI Examples
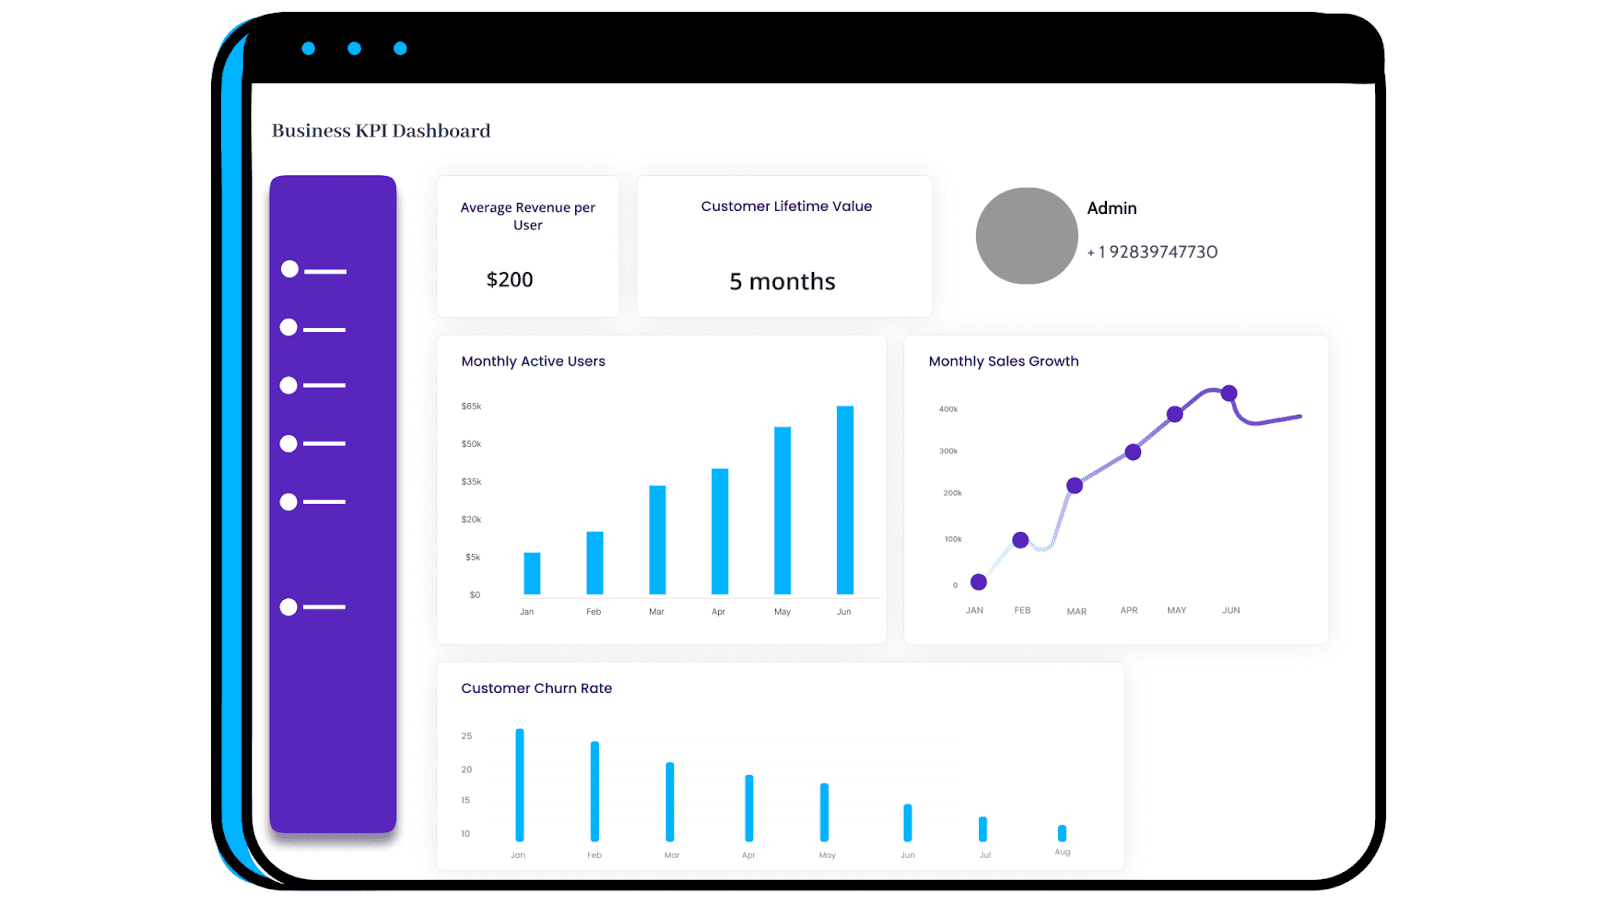
#1. Average Revenue Per User (ARPU)
The average revenue per user calculates the amount of revenue you're generating from every active customer. Although Monthly Recurring Revenue (MRR) is a great metric to track, ARPU kicks things up a notch and lets you dive deeper into your user's persona.
ARPU = Monthly recurring revenue / Number of active customers
Where,
MRR = Number of customers X Average billed amount
#2. Monthly Active Users
This KPI calculates the number of customers actively using your product during the said month.
This can help you calculate your MRR, ARPU, and performance of marketing campaigns.
While an increase in MAU is excellent, a sudden decrease in MAU can be due to several factors, such as technical issues, price hikes, or lack of reactivation campaigns.
#3. Monthly Sales Growth
As the name suggests, monthly sales growth lets you compare your sales month-over-month. It also lets you find leakages on the spot and work on improvements without awaiting the annual sales results.
Monthly sales growth = [(Sales for the current month - Sales for the prior month) / Sales for the prior month] x 100
#4. Customer Lifetime Value
Customer lifetime value refers to the revenue generated from a customer during his relationship with the business.
CLV = (TM x OV x GM x LT) / Total number of customers for the period
Where,
TM refers to the average transactions per month
OV is the average order value
GM stands for average gross margin
And LT is the average customer lifetime in months
#5. Customer Churn Rate
The churn rate refers to the percentage at which customers stop making purchases from you over a given period of time. It's a vital metric for SaaS or subscription-based companies.
Churn Rate = (Lost Customers / Total number of customers at the start of the period) X 100
Where,
Lost customers equal the total customers at the start of the period minus the total customers at the end.
Sales KPI Examples
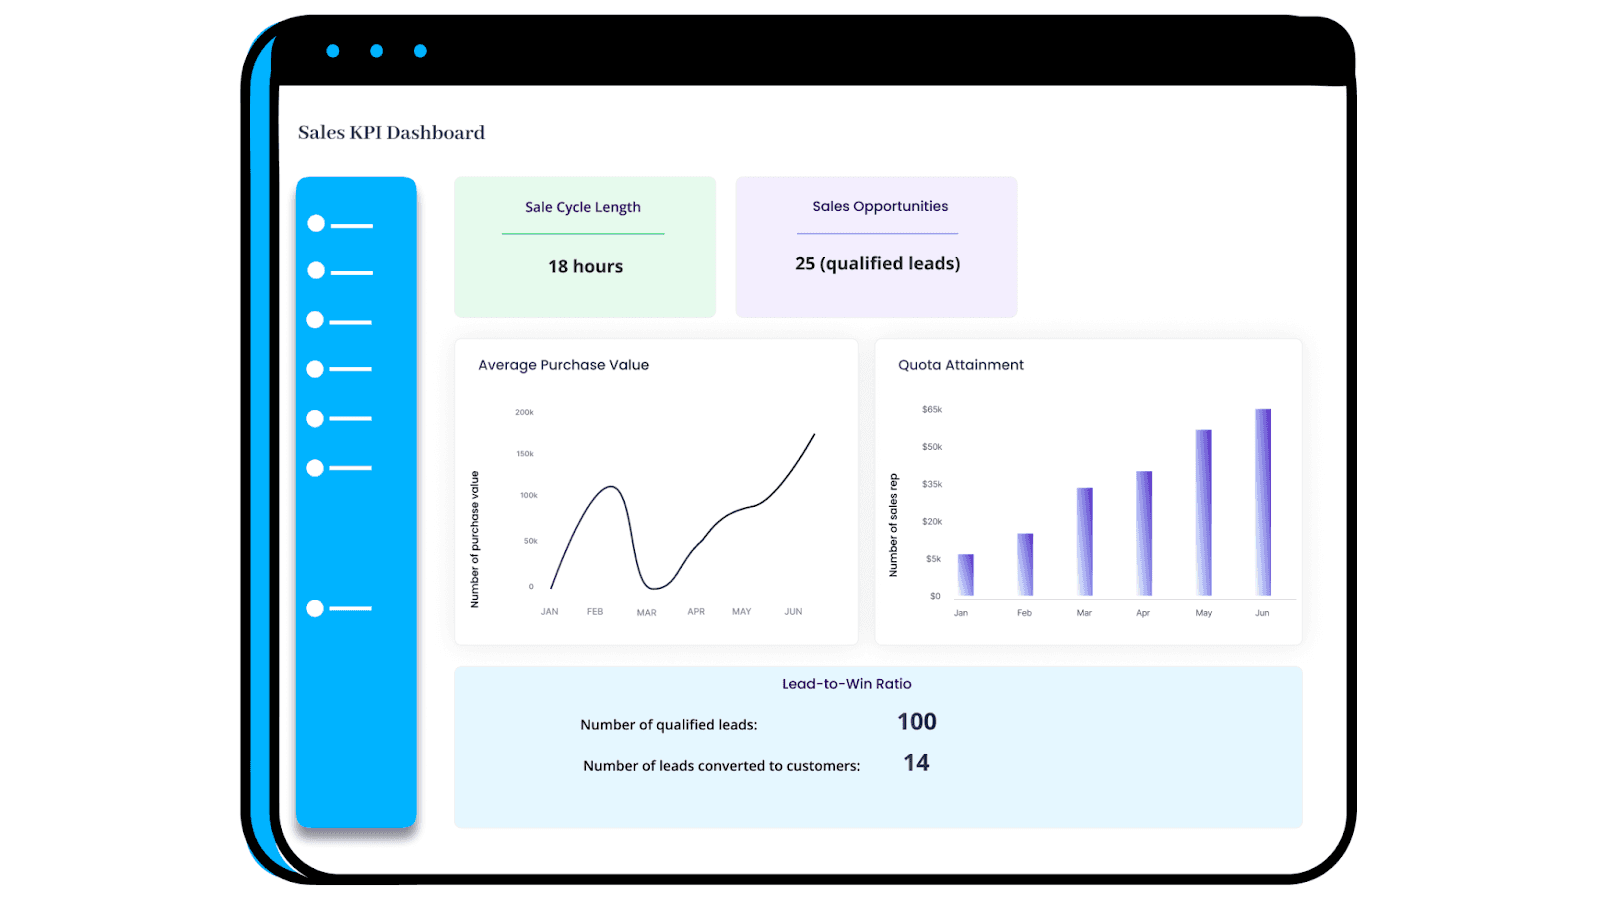
#6. Sale Cycle Length
This KPI measures the time taken from initial interaction with the prospect to closing the sale.
Sales managers can use this metric to evaluate sales rep performance, i.e., who closes deals quickly while who needs improvements.
Secondly, you can set specific benchmarks using these insights and work on optimizing the process and making it more efficient.
Average sales cycle length = Total number of days to close all sales / Total number of new deals
#7. Sales Opportunities
This metric calculates the estimated sales value of a lead, based on the probability of closing the deal.
To measure this KPI, you need to assign an opportunity value to every stage of the sales journey, namely:
-
Proposal (0.2)
-
Qualified (0.5) and
-
Negotiation (0.8)
Sales Opportunity = Sales Value X Opportunity value
#8. Quota Attainment
Quota attainment measures the proportion of deals (either numbers or revenue) a sales rep has closed with respect to the set target for a given period.
Quota attainment = Number of closed deals or revenue in a given time period / Quota for that time period
#9. Average Purchase Value
As the name suggests, this KPI measures the average amount a customer spends on your product or services. An excellent way to improve average purchase value is to strengthen upsell or cross-sell opportunities.
Average purchase value = Total sales / Number of transactions
#10. Lead-to-Win Ratio
The lead-to-win ratio, or lead conversion ratio, calculates how many of the total prospects or qualified leads convert into actual sales.
The KPI helps sales managers understand crucial things, such as:
-
Product-market fit
-
Pricing structure
-
Convincing power of sales reps
And much more.
You can determine which sales practices provide results and which seek improvisations.
Lead-to-win ratio = Total number of sales / Total number of leads
Marketing KPI Examples
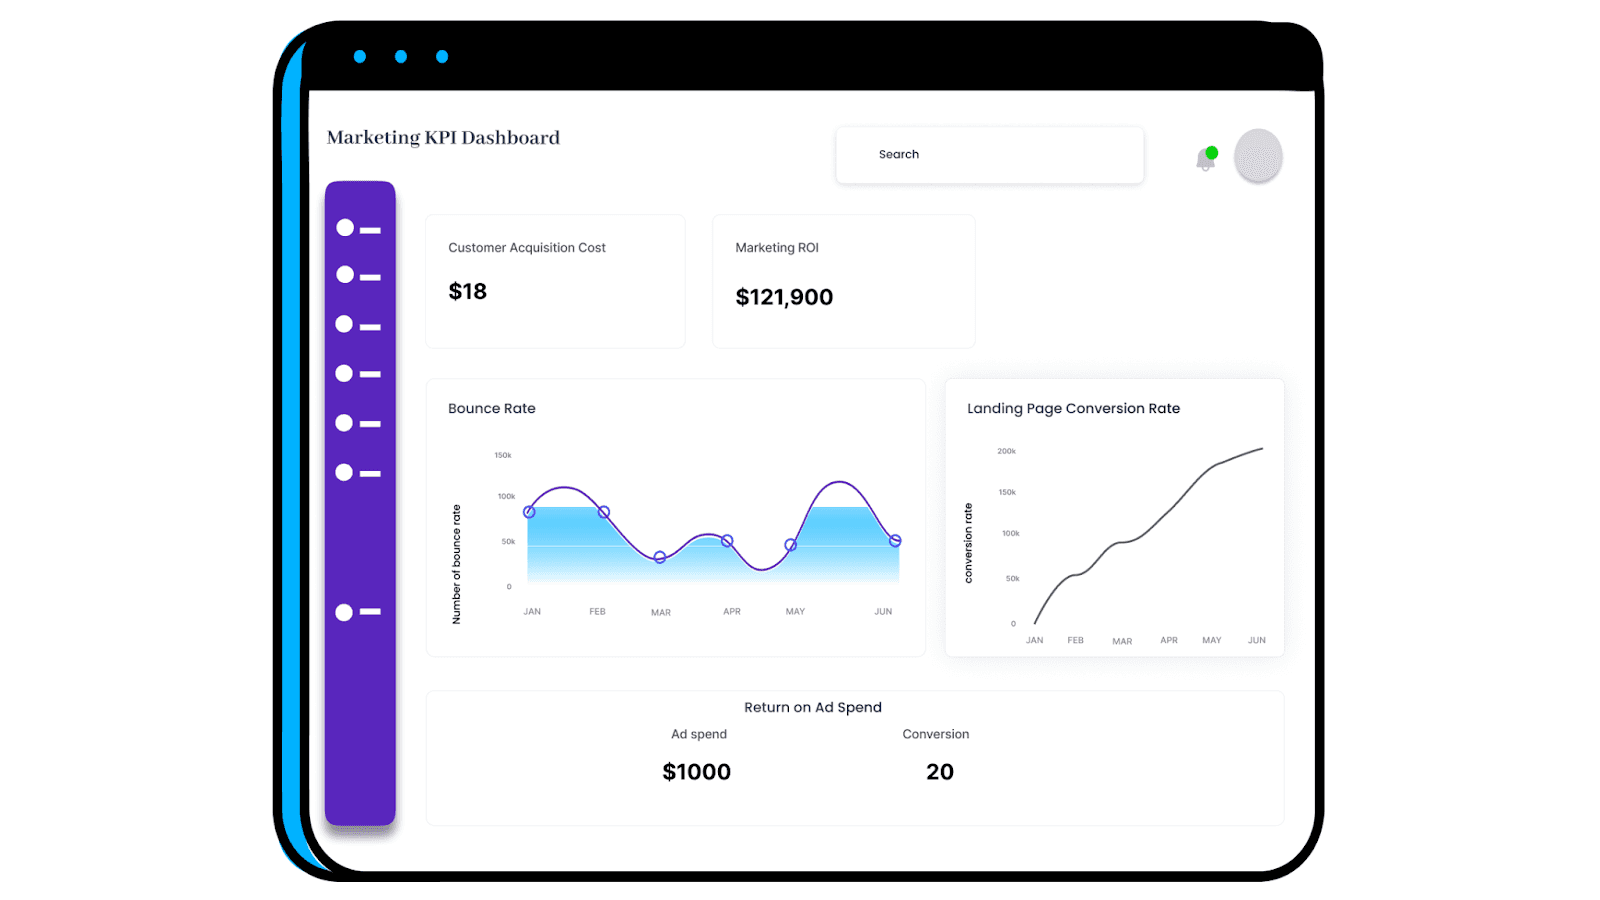
#11. Customer Acquisition Cost
Customer acquisition cost, or CAC, refers to the total cost incurred on acquiring a new customer. This includes the cost of advertising, technology, remunerations, and overheads.
If CAC > CLV, the business might soon run out of funds as the cost of acquiring customers is more than what they spend on your business.
CAC = Total money spent on marketing / Number of customers acquired
#12. Marketing ROI
Return on Investment in marketing refers to the amount of money gained from the overall marketing cost incurred.
Marketing ROI = (Sales revenue - Marketing Cost) / Marketing Cost
Calculating your marketing ROI determines how effective your marketing activities and campaigns are running.
An ROI of 5:1 is considered good, while a ratio of 10:1 is excellent. However, anything below 2:1 is considered non-profitable.
#13. Return on Ad Spend (ROAS)
Typically measured to determine the success of your ad campaigns, ROAS defines the revenue generated for each dollar spent on advertisements.
A standard ROAS benchmark is the 4:1 ratio - $4 in revenue to $1 in ad spend.
ROAS = Total revenue generated from ad campaigns / Total money spent on ads
#14. Bounce Rate
Bounce rate measures the percentage of visitors that leave a web page or landing page without taking action. Generally, this occurs due to the following:
-
Slow page loading speed
-
Unattractive page design
-
Poorly drafted content
-
Visitor-by-mistake
Bounce Rate = Single-page sessions / Total sessions
#15. Landing Page Conversion Rate
This KPI is like the traffic-to-lead ratio. It measures the number of visitors that took action on a specific landing page to the total number of visitors the page received.
Insights derived from this KPI can be used to perform A/B testing on landing pages and improve text, design, or CTAs to generate higher conversions.
Landing Page Conversion Rate = (Number of conversions during a period / Total visitors during the same period) X 100
Related: 11 Marketing KPIS every Marketing Team Should Track
Operations KPI Examples
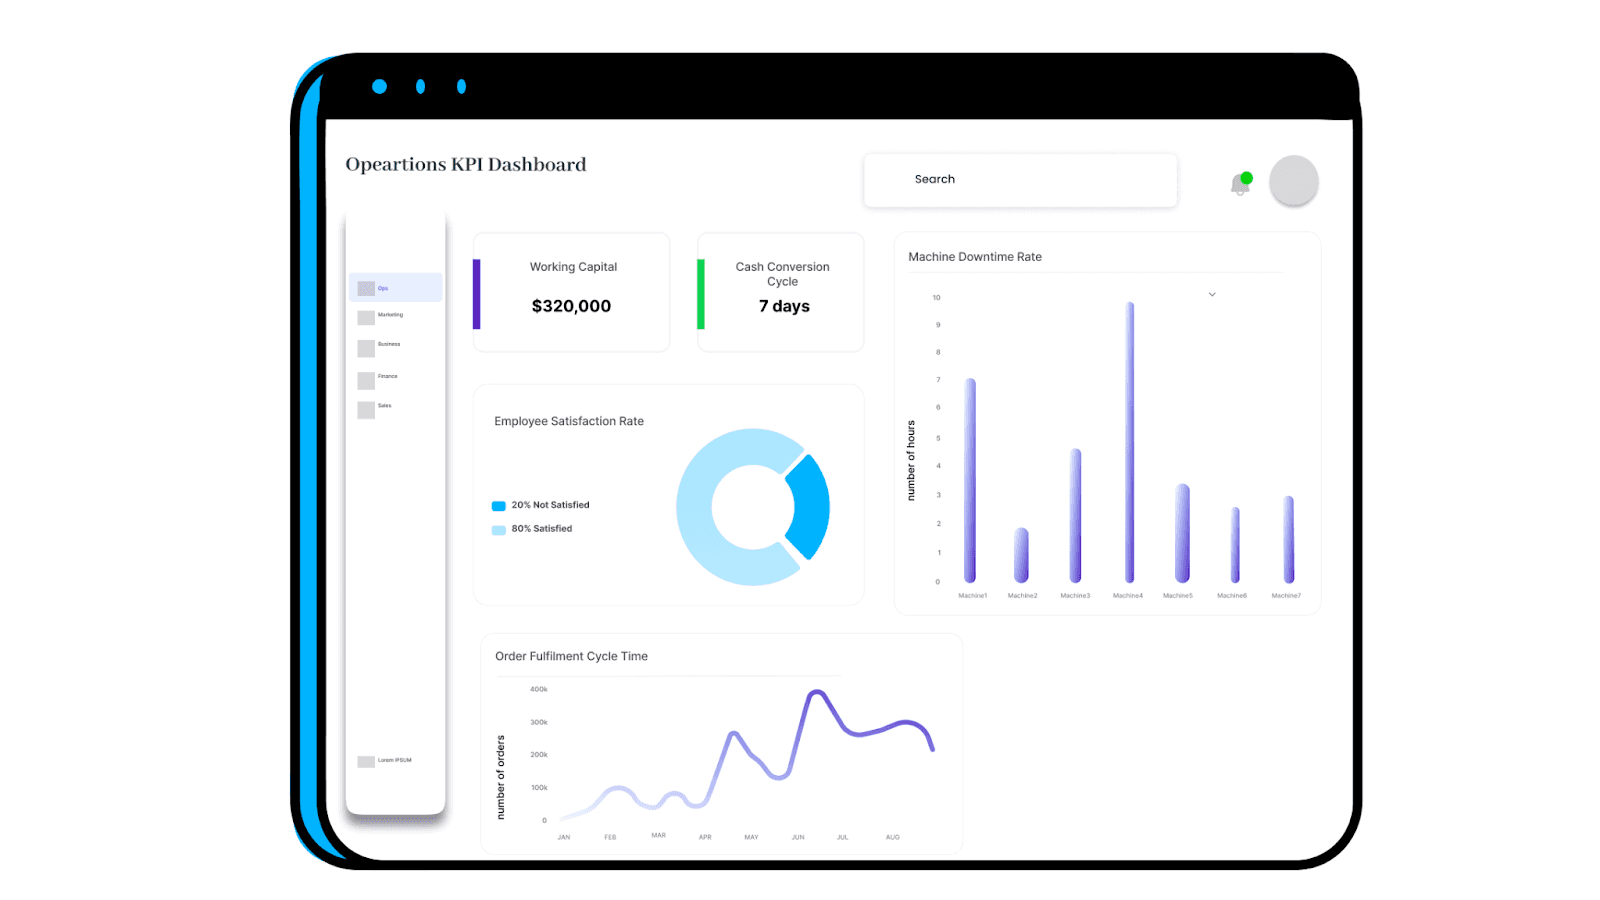
#16. Working Capital
Working capital refers to the available capital of the business that can be used for day-to-day operations. It's calculated by subtracting the current assets from the current liabilities.
Working Capital = Current assets - Current liabilities
#17. Order Fulfillment Cycle Time
This KPI measures the time it takes from receiving an order to getting it delivered to the customer. It provides insights into the inbound team's efficiency in processing the order and the effectiveness of your supply chain to manufacture, pack, and deliver it.
Order Fulfillment Cycle Time = Source Cycle Time + Production Cycle Time + Delivery Cycle Time
#18. Cash Conversion Cycle
The cash conversion cycle measures how long it takes for a company to convert its available inventory into cash. Basically, it measures how quickly you can sell your stock to gain back the money incurred to purchase it.
This KPI is comprised of three other KPIs:
-
Days Inventory Outstanding (DIO)
-
Days Sale Outstanding (DSO)
-
Days Payables Outstanding (DPO)
Cash Conversion Cycle = DIO + DSO - DPO
#19. Machine Downtime Rate
This KPI calculates the time an asset or equipment is not working. It can be due to planned (repair, servicing) or unplanned (malfunction) reasons. However, any downtime will affect your production, so this KPI is vital for operation managers.
Machine Downtime Rate = (Amount of time the equipment is down / Planned operating time) x 100
#20. Employee Satisfaction Rate
Employee satisfaction rate measures the percentage of happy and satisfied employees to the total employees in the organization.
Although there are several ways to measure ESR, the most popular way is by using eNPS (Employee Net Promoter Score).
To do so, you need to share survey forms (having a scale from 0 to 10) with employees. Now we categorize the voters into three types:
-
Promoters (9 -10): Happy and satisfied employees
-
Passives (7-8): Neither happy nor unhappy; neutral
-
Detractors (0-6): Unhappy employees
To calculate eNPS, use this formula:
eNPS = % of Promoters - % of Detractors
Customer Experience KPI Examples
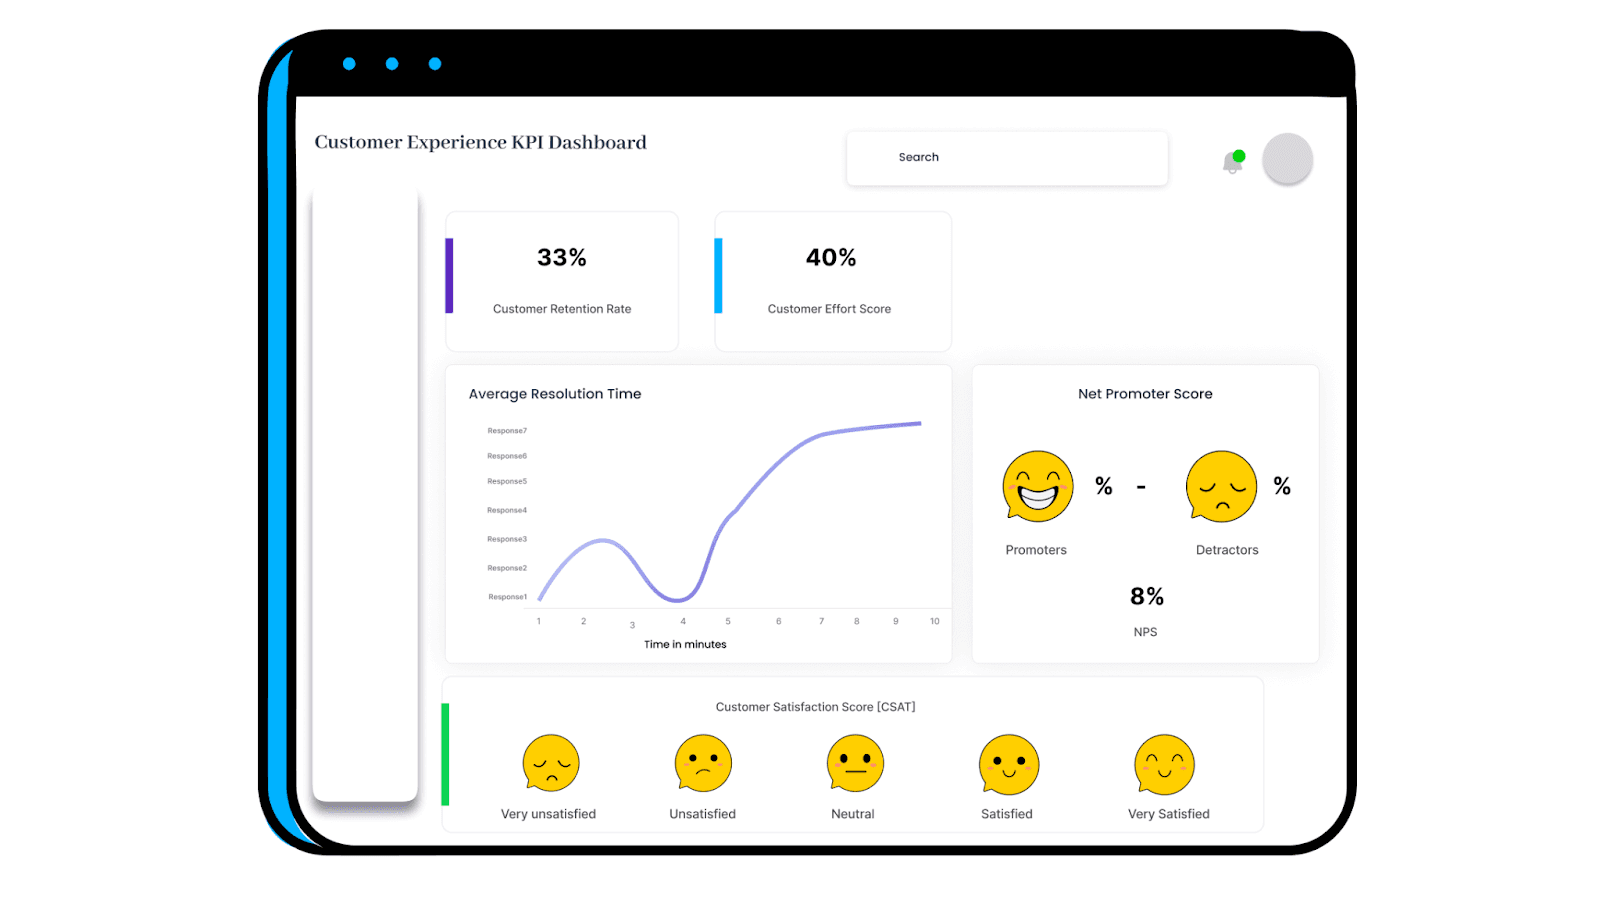
#21. Customer Retention Rate (CRR)
The customer retention rate measures the percentage of customers likely to make repeat purchases from your business over a given period.
Customer Retention Rate = [(CE - CN) / CS] X 100
Where,
CE is the number of customers at the end of the period
CN equals the number of customers acquired during the period
CS is the number of customers at the beginning of the period
#22. Customer Satisfaction Score (CSAT)
This is a simple yet important metric that helps you understand the satisfaction level of your customers and their expectations of your business.
To calculate this KPI, share a survey form with a scale from 0 to 10 and categorize voters as:
-
Unhappy Customers: 0-6
-
Neutral Customers: 7-8
-
Happy Customers: 9-10
Now, calculate CSAT:
CSAT = Number of happy customers (people who responded with 9,10) / Total number of respondents
#23. Average Resolution Time
The average resolution time calculates the time it takes for a customer support executive to resolve a ticket. Although the resolution time also depends on the complexity of the problem, the lower, the better.
Average Resolution Time = Total resolution time for all tickets resolved / Total number of tickets resolved
#24. Net Promoter Score
The net promoter score is a popular metric used by professionals to measure what percentage of customers are willing to recommend your product to their network.
To calculate NPS you have to run a survey form containing one or few questions and a scale ranging from 0-10 among customers. Then, categorize voters based on: Promoters (9-10), Passive (7-8), and Detractors (0-6).
Promoters are the customers who are highly likely to recommend your product.
NPS = (% of promoters - % of detractors)
#25. Customer Effort Score (CES)
Customer Effort Score, or CES, measures how much effort a prospect requires to interact with your business. And are they really happy about it?
Like NPS, you can share survey forms with a scale from 0 to 7. Usually, if a customer gives you a score of 5,6, or 7, they are happy, and it takes less time for your business to reach out to their customers.
CES = ( Number of responses with 5,6,7 / no. of responses) X 100
Financial KPI Examples
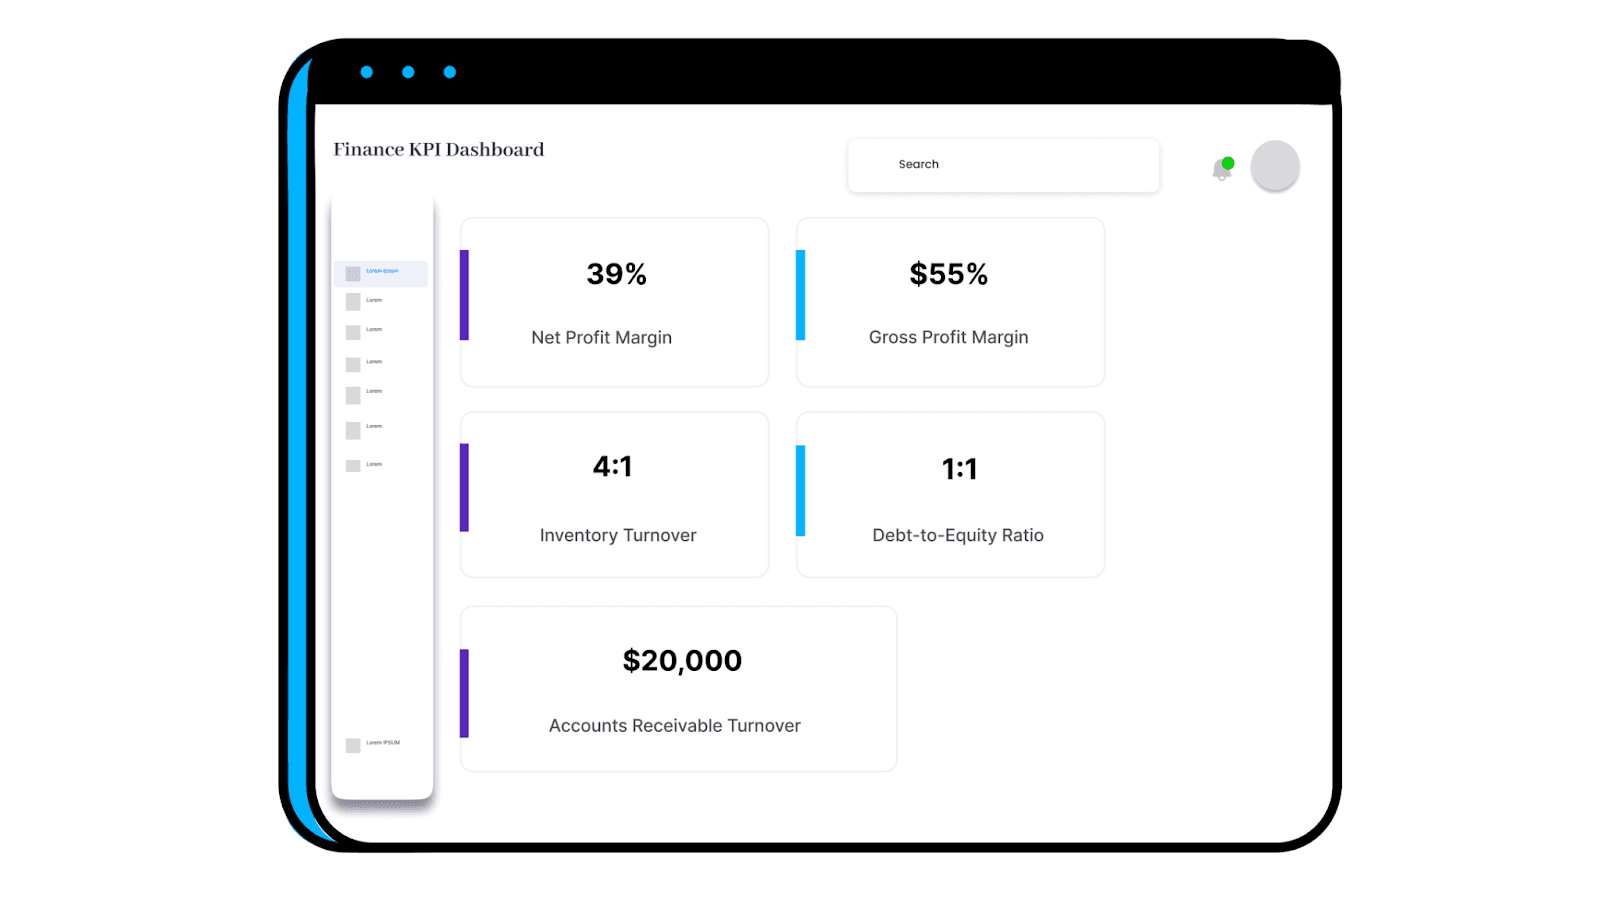
#26. Net Profit Margin
Net profit margin is the ultimate metric of profitability. It measures the amount of profit a business makes after accounting for its expenses, including taxes.
Net Profit Margin = (Net Income / Revenue) X 100
#27. Gross Profit Margin
Gross profit is the profit remaining with a company after deducting the cost of goods sold (labor and material cost) from the net sales.
This KPI makes it easy to measure profitability and compare performance with competitors.
Gross Profit Margin = (Net sales – COGS) / Net sales x 100%
#28. Inventory Turnover Rate
The inventory or stock turnover rate measures the number of times your inventory is sold over during a particular time frame. It prevents you from any unwanted surprises, such as order cancellation due to the unavailability of stock. It also helps you optimize cash flow.
Inventory Turnover Rate = (Cost of Goods Sold / Average Inventory) X 100
#29. Debt-to-Equity Ratio
The debt-to-equity ratio is a core financial metric that calculates the company's financial leverage by dividing its total debts and liabilities by its shareholder's equity.
DE = (Short term debts + Long term debts) + other payments / Shareholder’s equity
#30. Accounts Receivable (AR) Turnover
This KPI measures how efficiently the business collects debts and credits it extended a while back to its customers.
AR = Net credit sales / Average account receivable
How to Build Beautiful Dashboards For Free with Datapad?
With all the 30 KPIs ready to be tracked, all you need is a free and easy-to-use dashboarding tool.
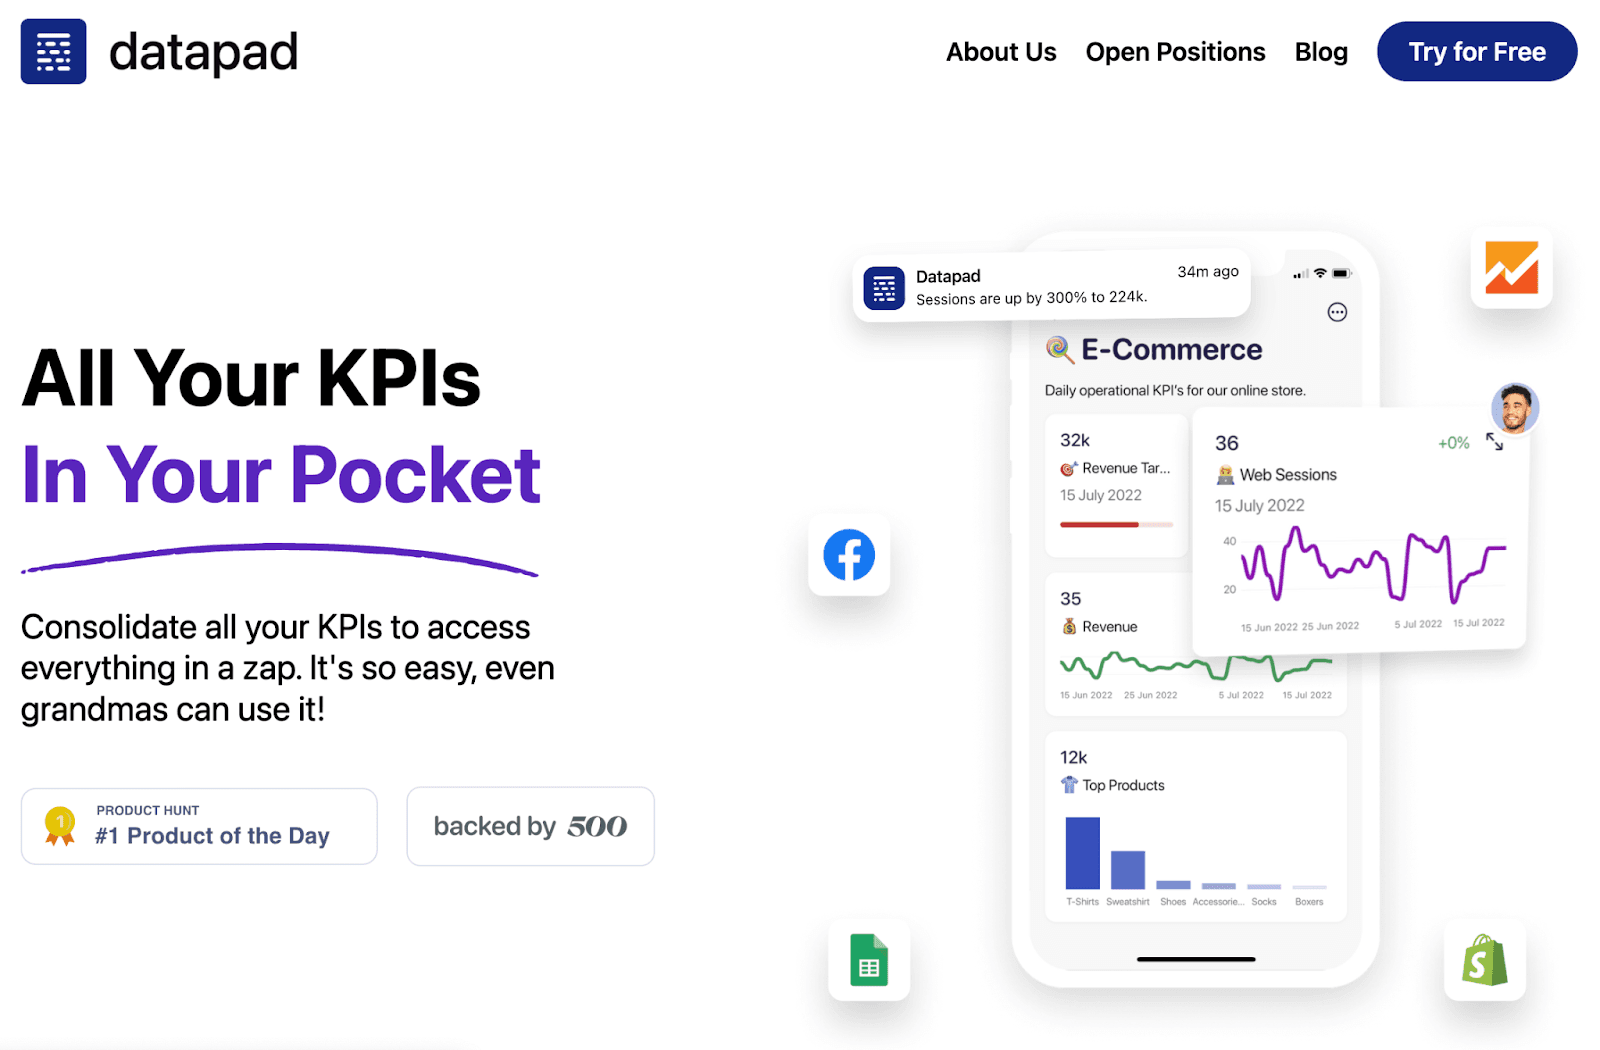
Datapad is a mobile-friendly KPI tracking and dashboarding tool that lets you collect, monitor, and present data via beautiful dashboards.
Our tool is entirely mobile-first (the desktop version is coming soon).
The best part about Datapad is that you need to have no coding experience to build dashboards. No need to code graphs, fire SQL queries, or learn your way around python.
Everything is pre-set in Datapad; all you have to do is tap on your mobile phone and choose the KPI and corresponding graph to add to your dashboard.
Here's a 3-step process to build your first dashboard:
Step 1: Get the Datapad App
Datapad is available for both Android and iOS devices. In order to get it, all you have to do is sign up to our platform and download the app.
Once you have the app on your device, sign up with your preferred email address. It takes seconds before we verify your email and then you can get to the next step.
Give a name to your workspace and create a KPI dashboard in seconds.
Step 2: Import Data For Right KPIs
With Datapad, you can import data automatically and manually.
Let's first see how you can import data automatically via our one-click integrations.

And if you have a comparatively smaller dataset, here's how you can import data manually with Datapad:

Step 3: Customize Your Dashboard
Our tool has tons of pre-built data visualization elements to help you quickly customize your dashboard. Besides, its drag-and-drop functionality makes it an easy-to-use tool for beginners.
Even with a no-code user interface, Datapad offers you to:
-
Set alerts and notifications for threshold points in KPIs
-
Communicate in real-time with the team below specific KPIs
-
Enable role-based management to control who can view/edit/share the dashboard
So don’t wait up, scan the QR code below to get started with Datapad, and use KPIs to grow your business.