
Do you know? 89% of leading brands use strategic marketing metrics and KPIs to define the effectiveness of their marketing activities.
And why won’t they! Analyzing marketing KPIs help you track, optimize, and predict marketing campaign performance.
In this article, you will discover the 11 best marketing KPIs to track and analyze for your business, no matter the sector you’re in.
So all I’ve to say is..

What Are Marketing KPIs?
KPIs in marketing are quantifiable measurements used by marketing teams to gauge their performance over marketing activities.
Like any other business activity, leaders want to measure the effectiveness of marketing campaigns every now and then.
And to help them do so, KPIs in marketing prove the ROI of marketing strategies, allowing businesses to double down on what works.
For instance, you can think of marketing KPIs as the mountain peak⛰ and marketing efforts as the hikers🧗 trying to conquer it. If your marketing team sets a KPI to increase website traffic by 40% in the next 5 months, your goals and activities will be outlined around achieving this KPI.
So, now that you understand what KPIs for marketing means, let's learn more about how it benefits marketing teams.
What Are the Benefits of Tracking Marketing KPIs?
#1. They Help You Supercharge Your Marketing ROI ⚡
You can improve anything that can be measured. The same goes for your returns from marketing efforts.
When tracked and measured correctly, certain key performance indicators for marketing can result in a high return on investment.
For example, 5:1 is considered a good marketing ROI. Earning $5 on every $ 1 spent on marketing or, in some cases, earning $10 by spending $1 on marketing (10:1) are amusing benchmarks.
And since you have predetermined benchmarks, you can use these metrics to get a better idea about which activities and campaigns have contributed directly to the bottom line.
Eventually, repurposing activities that result in the greatest ROI.
#2. They Justify Your Spends 💸
Marketing activities roughly comprise 13.8% of the company's total budget.

Really? Just 13.8%? That doesn't sound like something to worry about!
But the thing is, with every passing year, the marketing budgets are significantly increasing. And we discovered three major reasons behind it:
-
Economic Inflations: Causing a high rise in the cost of literally everything
-
Customer Expectation: Soaring day after day
-
Competitive Market: You need to beat the competition anyways
However, most marketers fail to justify the increase in budgets to stakeholders and investors. Even though they are pumping money for marketing campaigns, they can't justify spending due to lower or negative ROI.
Some of the top marketing KPIs like cost per lead, customer satisfaction rate, CPC, and more help you understand what all marketing tactics are worth investing in.
#3. They Give a Competitive Advantage 🎖️
As we stated earlier, around 89% of marketers use marketing metrics for strategic decision-making. However, their choice of metrics depends upon their business type, budget, resources, and goals.
So it's possible that the metrics you are tracking aren't similar to the ones your competitors are tracking and the other way around.
If you find the right balance of metrics and KPIs, you can gather enough data to get the upper hand over the competition. Data such as:
-
Customers Personas
-
Habits and behaviors
-
Channels with an impressive ROI
And more…
Furthermore, you can use these insights to create better, personalized marketing campaigns.
#4. They Prevent You From Guesswork 🤔
Guess is a debatable term.
While it might work well for gamblers, it certainly puts you on the edge when it comes to running a business. Here, it would be best to have actionable insights rather than trial-and-error methods.
And KPIs for marketing help you gather that data and present them in a centralized manner, adding meaning to it. In fact, 2 out of 3 marketers admit that data-driven decisions beat gut intent.
#5. They Help You Grow Faster 🏎️
Measurement is all about improvement!
When you have a competitive advantage, a better return on investment, and data-driven insights, you will grow faster than you would otherwise.
Moreover, your business growth will be much faster when you track the most important metrics and use the information to your advantage.
Let's review some of the marketing KPIs examples that can help you grow 10X faster.
What Are the 11 Best Marketing KPIs to Track?
#1. Organic Traffic
Organic traffic is the number of visitors you receive on your website from unpaid channels or sources (mostly from organic search results).
Why Is It Important?
Organic traffic is important because it helps the site attract visitors and increase its popularity without paying a dime for ads.
Simply put, the higher you rank, the more traffic you generate organically. Listed below are some of the best practices to improve your organic traffic:
-
Target keywords that match intent (even if they're low or zero-volume keywords)
-
Consistently put content on your website or optimize your old content for SEO
-
Focus on adding quality backlinks to your website
-
Gor-for long-tail keywords (suggested by marketers)
The best way to measure organic traffic is via Google Analytics.
To do so, open Google Analytics and click All Traffic, then Channels. Here, you'll find the different traffic sources, including organic traffic.
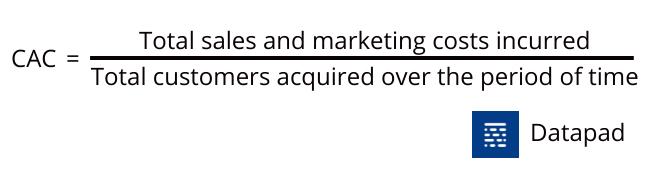
#2. Customer Acquisition Cost
Customer acquisition cost is one of the top marketing KPIs that measure the total cost incurred on acquiring a new customer. It typically includes the total sales and marketing cost required to earn a new customer over a specific period.
Why Is It Important?
CAC directly impacts your marketing budgets, and therefore executives keep an eye on this metric so it doesn't get out of control.
Think About It: No rational company would spend $500 to acquire a new customer with an expected Lifetime Value (LTV) of $300 because it wouldn’t just make sense in the long run.
Although CAC differs from company to company, a typical SaaS company usually has an average acquisition cost of $205. However, the lower, the better.
Reducing CAC means that the business is spending money more efficiently and should see higher returns in its total profit.
Here's a simple formula to calculate CAC:
#3. Customer Lifetime Value
Customer Lifetime Value (CLV) measures the amount of money a business expects to generate from its customers during their relationship with the company.
Why Is It Important?
This metric is tied with other marketing KPIs, such as CAC and churn rate, to make it more insightful. Although it's a predictive metric, it can help you by miles when measuring your marketing performance.
You see, if a customer's lifetime value (CLV) is lower than his acquisition cost, you're not making any profits since the cost of acquiring these customers is more than what they are spending on your business.
Likewise, CLV is a great metric to use when you have a multi-year relationship with a customer – say, for a paid monthly subscription. And it's good for spotting the early signs of attrition to implement spot-on retention strategies.
To measure customer lifetime value, you first need to determine your ideal customer value. Here's how you can find both:

#4. Customer Retention Rate
Customer retention rate measures the percentage of customers that return to do business with you during a given time frame.
Why Is It Important?
Factually, 65% of a company's business comes from existing customers. That's why you often see businesses running loyalty programs, giving out freebies, and offering mind-boggling discounts.
In fact, a 5% increase in retention rate leads to an impressive 25-95% increase in profits.
You can easily see the incredible difference a minor retention effort can make. Besides, acquiring new customers cost businesses 5X more than retaining customers.
And therefore, tracking and measuring this KPI on a regular basis is important for business owners and marketers.
A retention rate of 25% or higher is considered good for marketing teams.
Here's a simple formula to calculate the retention rate:
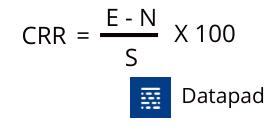
Where,
E = Customer at the end of the period
N = Customers acquired during the period
S = Customers you have at the start of the period
#5. ROI on Marketing
ROI on marketing stands among the most used KPIs in marketing. It's actually the key metrics investors and stakeholders look forward to when analyzing the company's marketing performance.
We can define it as a KPI that quantifies to justify your returns on money spent on running marketing programs and campaigns.
Why Is It Important?
Earlier, we stated two significant benefits of KPIs in marketing:
-
It supercharges your return on marketing investment
-
It accounts for your marketing expenses
This metric somewhat gives both benefits to your marketing team. It's a prolific indicator of how well you use your funds to direct revenue gains.
If your investments in certain marketing campaigns are not yielding results, you might want to change your approach before you go bankrupt.
Here’s how you calculate ROI for marketing:
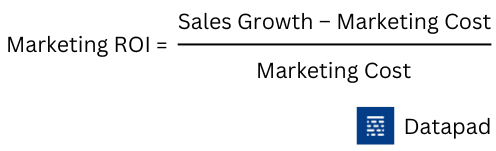
Pro Tip: An ROI of 5:1 ($5 earned on every dollar spent) is considered good, but anything beyond that is exceptional as a marketer.
#6. Net Promoter Score [NPS]
Marketers use Net Promoter Score (NPS) to measure the percentage of customers that are likely to recommend your product or service to their friends.
Why Is It Important?
NPS is a customer-centric metric, i.e., it allows marketing teams to keep an eye on their customers' experience and sentiments toward the company.
Besides, NPS can be used as an indicator of business growth. A high NPS indicates a healthy relationship with customers who are likely to act as amplifiers for the brand, fuel word of mouth, and generate a positive growth cycle.
NPS is generally measured by sending a single survey question having a scale from 0 to 10. Here, '0' being the least happy someone is to recommend your product, and '10' is the other way around.
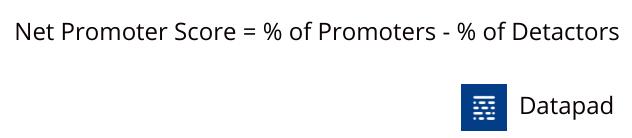
To ease things, we classify the voters into three categories:
-
Promoters: People who vote between 7 to 10 (highly likely to recommend your product)
-
Neutral: People who vote 4 to 6 (not sure of recommending your product)
-
Detractors: People who vote below 4 (probably didn't have a nice customer experience)
And once you have the numbers, calculating NPS is pretty simple:
#7. Conversion Rate
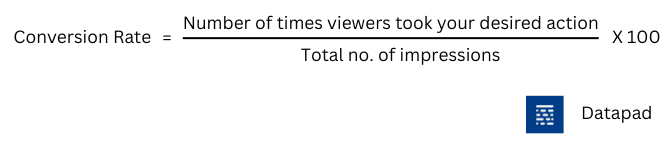
Conversion rate measures the percentage of website visitors who completed a desired action. The action can be anything from clicking on a link to subscribing to your newsletter.
Why Is It Important?
Tracking your conversion rate is essential to understand how your sales funnel is performing and what marketing campaign has the greatest repercussions on your company's ROI.
Think about it like this. You're running a marketing campaign to get registrations for a webinar. Tracking conversion rate is a great way to tell what percentage of visitors actually come up to your landing page after watching your ads or social posts.
Conversion rate can also drill down insights on what percentage of people see your ad, visit your landing page, but don't register for your webinar. Thereby highlighting some issues that might have set off potential leads, such as,
-
Poor landing page copy
-
Unattractive page layout and design
-
Targeting the wrong audience
Here's a quick formula to calculate the conversion rate:
#8. Traffic to MQL Ratio
This marketing KPI measures the portion of website traffic that has been reviewed by the marketing team and satisfies all criteria of being a potential customer for the business.
Why Is It Important?
Generally, visitors become leads when they share some kind of information with brands, such as sharing their email address or contact information.
Those leads become marketing qualified leads (MQLs) when they're determined to be in the company's target market and match one of its buyer personas.
This ratio is important because it reflects the effectiveness of each of your marketing channels whether they're worth their cost.
Here's how you can calculate it:
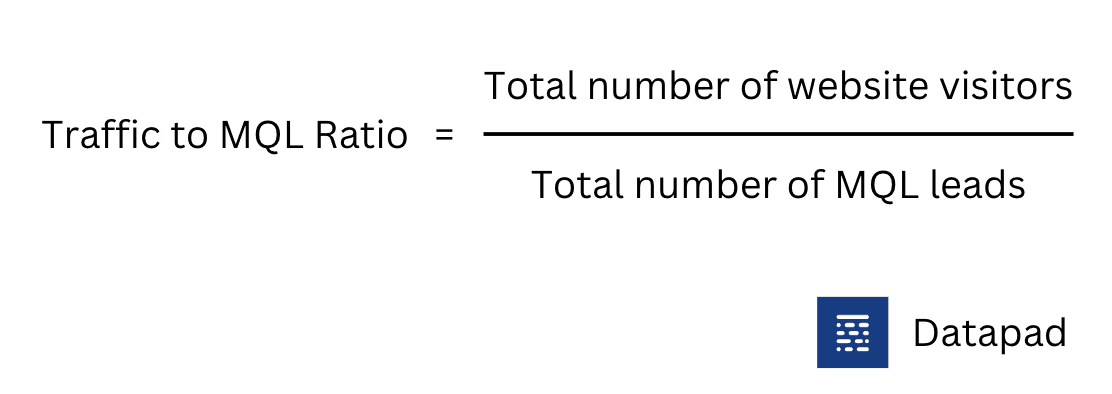
To calculate the percentage, simply divide the resultant by 100.
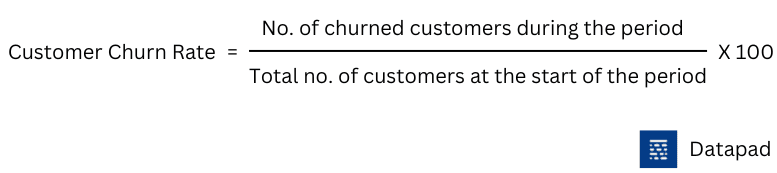
#9. Churn Rate
The churn rate measures the rate at which customers stop doing business with your company during a given period.
Why Is It Important?
When looking at hundreds of different SaaS companies, we've discovered that there's a wealth of complexity when measuring churn rate. It might be due to complex pricing models or complexity in calculating the frequent number of customers coming in and moving out.
Whatever it is, this KPI streamlines the whole process and helps you clearly identify the rate at which your business is losing customers.
Here's a simple formula to calculate the churn rate:
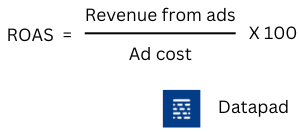
#10. Return on Ad Spend (ROAS)
Return on Advertising Spend is a marketing KPI focusing on the gains made over money spent on paid marketing campaigns.
Why Is It Important?
ROAS typically measures the efficiency of a digital advertising campaign. It helps online businesses evaluate which methods work and how they can improve future advertising efforts.
So how can you calculate it? Here's a quick formula:
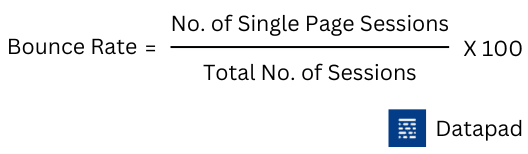
#11. Bounce Rate
Bounce rate measures the percentage of visitors who leave your website without taking any action.
Why Is It Important?
Bounce rate is an excellent way to analyze how website visitors engage with your content. After all, you want your visitors to land on your page and do something.
But if they don't, it could be due to many reasons, such as:
-
Irrelevant content
-
Slow loading time
-
Poor navigation
-
Un-interactive design
Tracking this KPI can help you drill down at what stage of the customer journey they chose to exit your website. This can help you improve your bits that might be waving off visitors.
Besides, bounce rates are a leading factor in determining your website's authority to search engines. You see, a higher bounce rate indicates that visitors are not interacting with your website. Thus search engines won't show it in the first place.
Most websites' average bounce rate is between 26% and 70%.
Here's how you can calculate your website's bounce rate:
Here are some secondary KPIs that didn’t make the cut but are still essential:
-
Social Media KPIs: Likes, engagement, comments on social media
-
Number of Leads: Audience your convert into leads per month
-
Content Marketing KPIs: How your content is performing on website and social media
-
Email Marketing KPIs: If you run an email campaign, how’s it doing
-
Click-Through Rate (CTR): Click through rate rate especially on ad campaigns
How to Track Marketing KPIs with Datapad?

Datapad is a mobile-only KPI tracking and dashboarding tool that allows anyone to collect, measure, and analyze marketing data via interactive and beautiful dashboards.
It's a complete no-code platform and can be easily accessed and used by your marketing teams without any technical jargon. In fact, tracking marketing KPIs with Datapad is a 3-step process.
Step #1. Decide on Your Goals for Tracking Marketing KPIs
Why are you tracking these KPIs? Is it for achieving goals or improving on pain points? Or is it both?
Whatever it is, ensure you are determined and stick to it during the whole KPI tracking and dashboarding process. We’d recommend creating SMART goals here:
-
Specific
-
Measurable
-
Attainable
-
Realistic
-
Time-bound
Think about it:
Increase conversion rate to 100% - meh!
Increase conversion rate by 15% by 31st December - sounds more realistic ��
Similarly, create SMART goals based on your business needs and then choose KPIs that align with your goals.
For example, a perfect KPI for the above-mentioned SMART goals will be "Conversion Rate."
Likewise, choose KPIs with respect to your goals for better and more accurate insights.
Step #2. Create a Dashboard to Centralize Your Data
Now comes the fun part. Getting started with the dashboard creation process.
Unlike other dashboarding tools, Datapad is not-desktop-ridden. You can download our mobile app on the app store or play store, or simply scan the QR code below to get the app.

Once into the app, make sure to register with an active email address.
Note: We do verify email addresses to prevent bot armies from entering the chase.
Then click the 'Create a dashboard' button on your screen and enter some details such as the dashboard title, a short description, and an emoji (optional). This is to personalize your KPI tracking experience.
When completed with the details, click on 'Create.'

Your dashboard is ready to track all your marketing KPIs under one roof. Are we missing something?
Oh yes, DATA!
Well, it's not rocket science to import data with our platform. Our tool allows you to import data both ways:Automatically and Manually.
Here's how you can manually import data in 3-steps:
-
Tap on 'Add Metric' > Enter Manually
-
Add a value > set comparative standards
-
Customize the metrics as per your company's branding
-
Choose a visual element to represent your data

Or if you want to set the process on auto-pilot, it's really simple too. You can use our one-click integrations to data points such as Google Analytics, Shopify, Facebook Ads, and more to import data with a click. Here's how you can do it:
-
Press the green colored '+' sign to create a metric
-
Click on 'Use a data source'
-
Choose from a library of datapoints

And that's it! Now you can instantly track all your marketing KPIs on the go.
Step #3. Share KPI Dashboards With Team and Stakeholders
However, you can only call it a full-fledged KPI tracking dashboard once your team and stakeholders are onboard. Fortunately, our tool allows you to onboard team members via one-click email invitations. Quick and easy!
Besides, you and your team can collaborate in real-time without exiting Datapad.
To communicate with your team inside Datapad:
👇🏻 Comment under the metric which you feel needs attention
👇🏻 Your team gets real-time push notifications for your comment
👇🏻 Team members can view and reply to the comment in real time
Here's the feature in action:

Isn't it simple? All you need is a mobile app to track KPIs on the go. Besides, our tool is free to use. Why not hop in and give it a test drive. Download the app and get started with your marketing KPI tracking ASAP!