![27+ SaaS Statistics and Trends You Should Know About [2022]](/_next/image?url=https%3A%2F%2Fframerusercontent.com%2Fimages%2F73f1K4qYvCxAS4BMQT6jG9teQc.png&w=3840&q=75)
With the tech-revolution worldwide, SaaS has been the most popular and a game-changer for everyone around the globe.
Many SaaS companies have proved to be a strong alternative for orthodox technology that has been driving the tech market for decades and replaced it with strong automation solutions.
But that’s just not it 🤷♂️; the competition to start a SaaS brand, grow, and scale it is just insane!
In this article, you will discover a compilation of all the major 2022 SaaS statistics. From its growth to how SaaS acquires customers, we’ll be covering everything.
But first, here’s a tl;dr for you.
Editor's Pick - The Best SaaS Statistics in 2022
✅ The global SaaS market is projected to grow to $195 billion in 2023
✅ There are 17,000 SaaS brands in the US alone
✅ 48% of businesses sign up to an yearly contract for any SaaS platform they use
✅ 84% customers keep using SaaS after their free trial
✅ The annual customer churn rate benchmark for SaaS companies is 5.9%
SaaS Growth and SaaS Trends Statistics
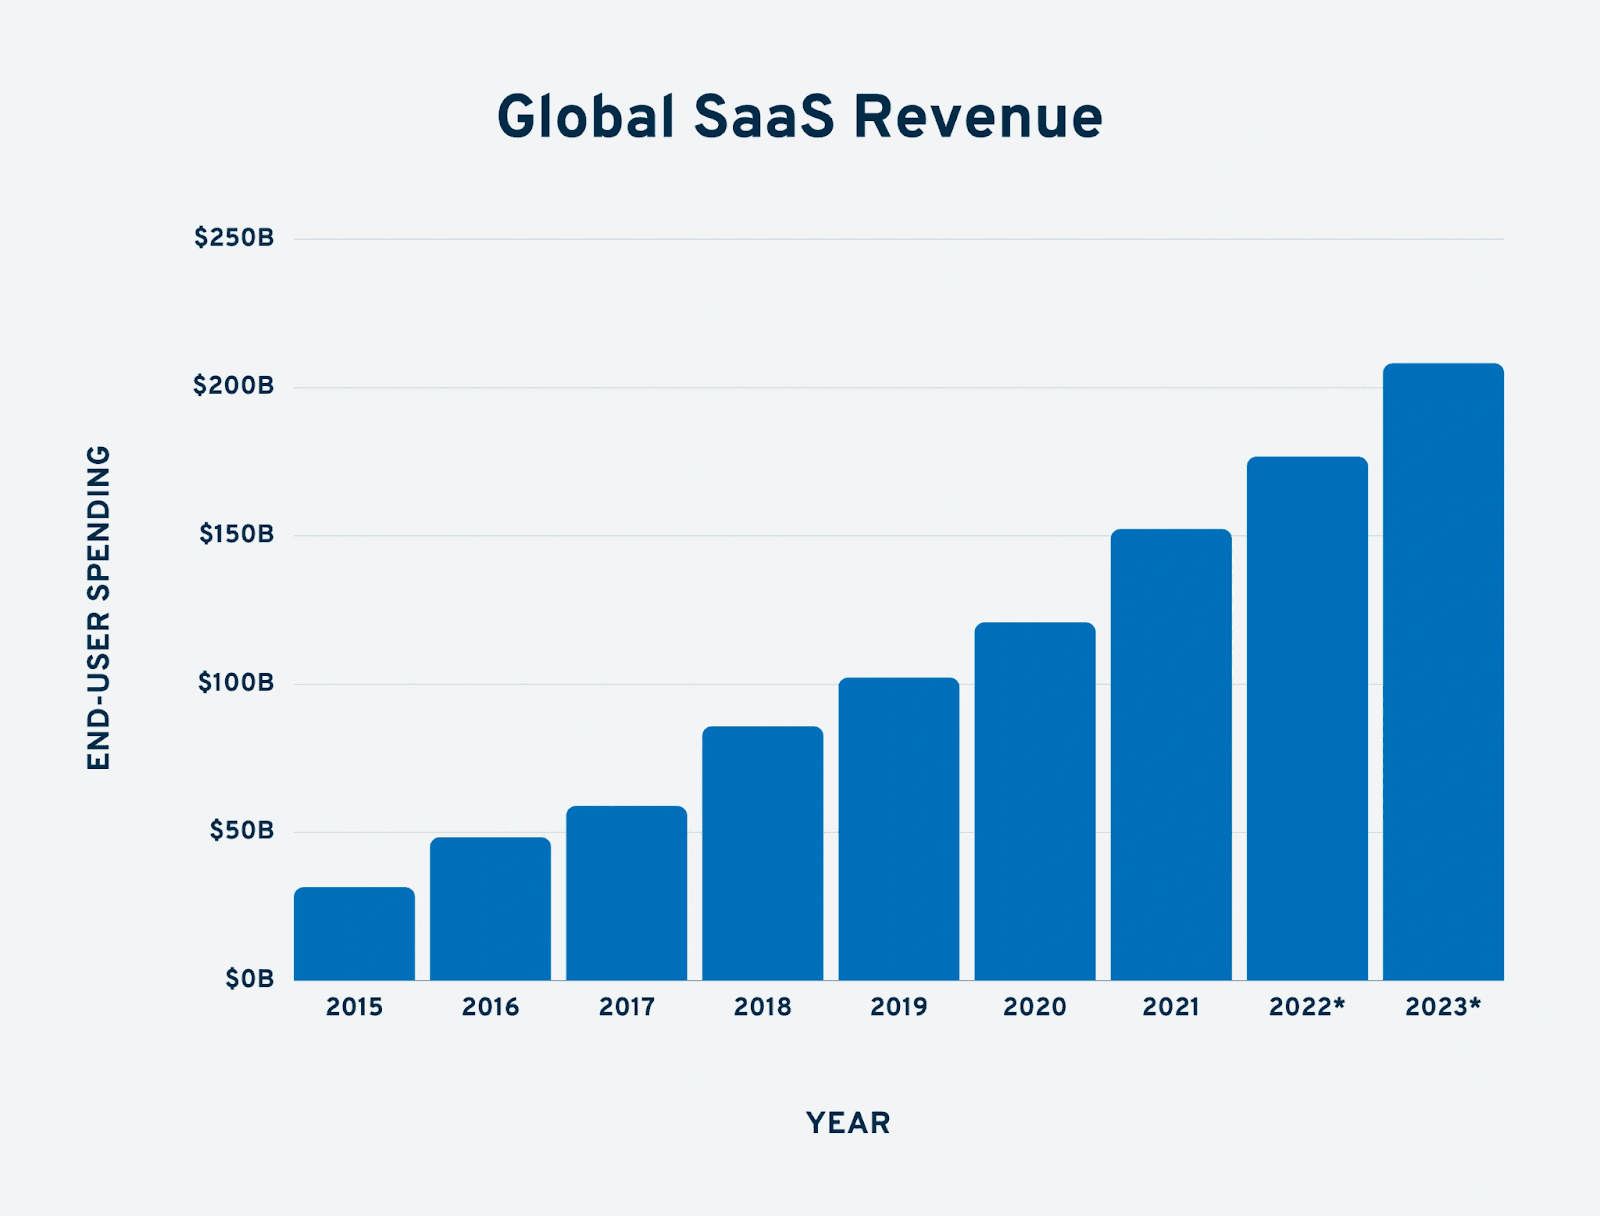
#1. SaaS End-User Spending Worldwide

The global SaaS market is projected to grow from $102 billion in 2019 to $195 billion in 2023 at a Compound Annual Growth Rate (CAGR) of 8.3%. Currently the total value of SaaS is $167.11 billion.
The growth of SaaS users is expected to outpace the growth of the SaaS market itself, with a projected CAGR of 12.7%, reaching nearly 2.2 billion users by 2022.
This growth will be driven by the increasing adoption of public cloud services across all industry verticals, the emergence of new use cases, and the shift towards subscription-based models.
#2. Average Number of SaaS Applications Used by Organizations Worldwide
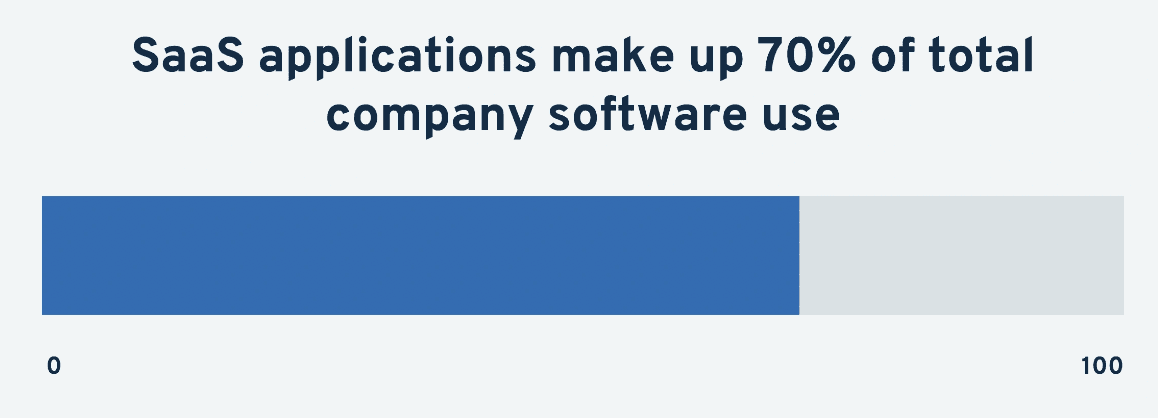
The average number of software as a service (SaaS) applications used by organizations worldwide has increased from 8 in 2015 to 110 in 2021 - it has grown even more in 2022.
This growth is largely due to the increasing adoption of SaaS applications for their scalability and cost-effectiveness.
Additionally, the emergence of cloud-based SaaS has enabled organizations to leverage applications for a variety of use cases, such as collaboration, customer relationship management, customer service, and analytics.
The increasing popularity of SaaS applications is expected to continue driving their adoption in the future.
#3. Workload Running Scenario in Upcoming Years

In five years, 95% of all workloads (i.e., tasks, processes, or activities that require computing power) will be run on cloud computing services and platforms.
This means that companies will use cloud services to access the computing power instead of running these workloads on in-house servers or hardware.
This could result in faster, easier access to data and applications and improved scalability for businesses.
#4. How SaaS Companies Funded Their Growth In 2022?
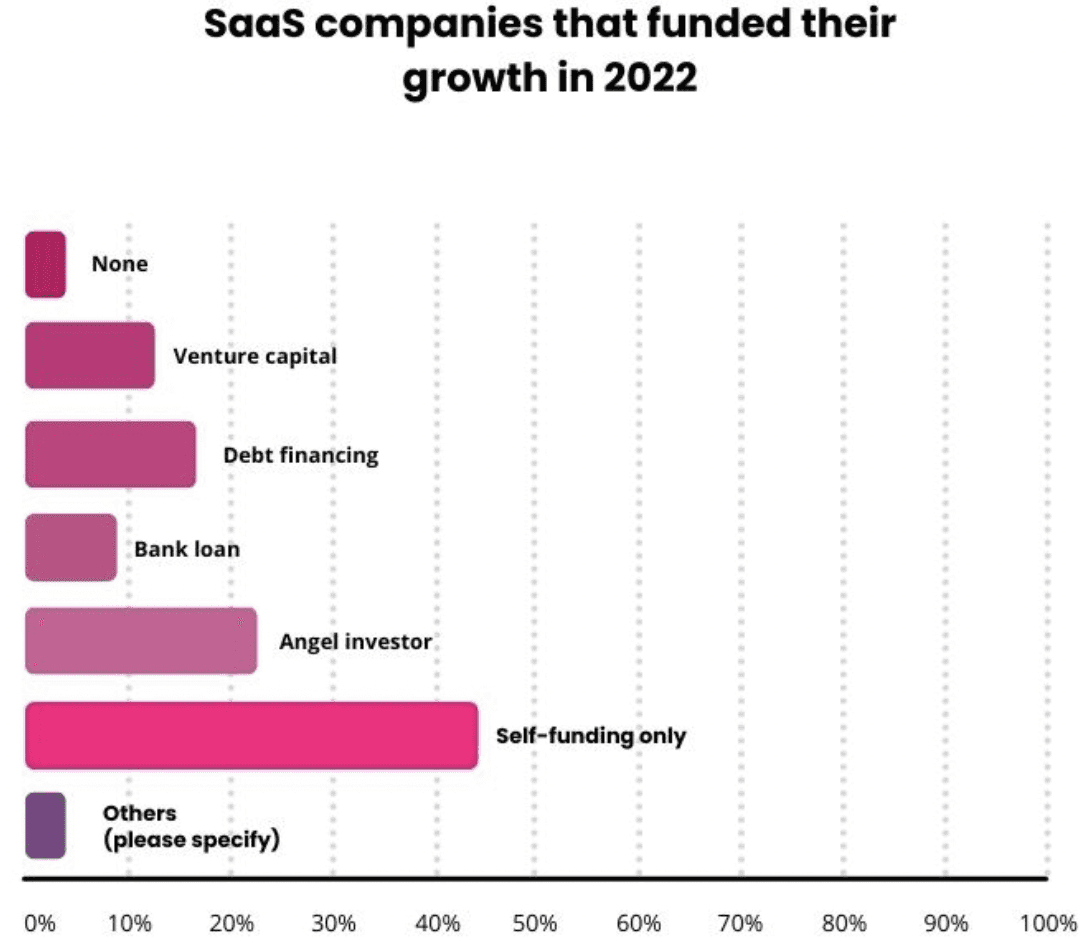
To our surprise, about 44% of SaaS companies were successful in self-funding their growth in 2022.
As compared to 2021:
-
Debt financing increased 2%
-
VC funding increased 3%
-
Decrease of 8% for rounds raised by angel investors
-
Amount of bank loans took by SaaS decreased by 7%
Region-Specific SaaS Stats
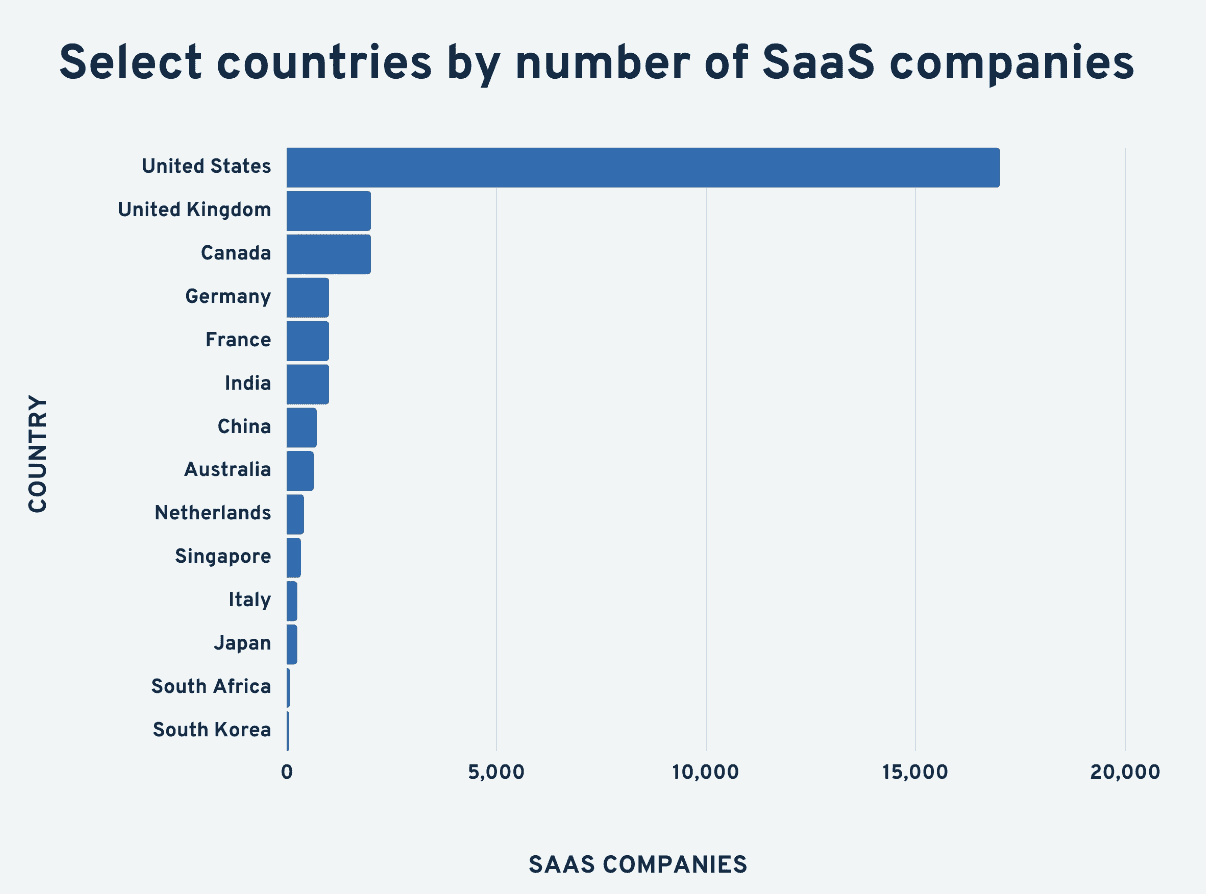
#5. Leading SaaS Regions Worldwide
There are ~17,000 SaaS companies in the US alone, that's 15,000 more than the next leading market - the U.K., Canada, Germany, France, and India are the next leading SaaS company market for 2022.
#6. Growth of SaaS in Europe
Germany is currently leading Europe's SaaS market at $10.5 billion. But this is expected to increase to $18.3 billion in 2027.
Germany is followed by France with $5.89 billion in 2022 and is expected to hit $10.7 billion in 2027.
Italy, Netherlands, and Belgium are the next three in line that make up the top 5 countries in the European SaaS market.
#7. Latin America Set to Disrupt the SaaS Market
Latin America has now joined the race to share a significant share of the SaaS market worldwide.
From 2017 to 2021, the Latin American SaaS market has grown from $1.48 billion to $4.11 billion. But that's not just it; from 2021 to 2022, the SaaS market of L.A. has grown to $5.31 billion.
That's huge!
SaaS Marketing Budget & Spend
#8. Contract Details of Businesses Using SaaS Apps
Of the total business that uses SaaS apps for their routine work, 48% have a one-year contract, 13% have monthly, and 11% have a contract of three years or more.
#9. Budget Spent to Annual Recurring Revenue Ratio
On average, a SaaS company spends $1.32 to create $1 annual recurring revenue. But for brands who are successfully upselling products, this number has been brought down to $0.71.
#10. How Much Does a SaaS Company Spend on Marketing?
The median percent of annual recurring revenue spent on marketing is 10%, up 11% from the previous year.

However, successful SaaS companies leverage content marketing to drive growth and generally spend $342,000 to $1,080,000 per year (or more) on content marketing.
SaaS Purchase and Usage Statistics
Companies around the globe are leaning towards SaaS due to its close-to-none barriers to entry, instant accessibility, and ease of scalability.
We discovered some mind-boggling purchase, usage, and adoption statistics for SaaS.
#10. The State of the SaaS Industry
The SaaS industry is rapidly growing by 18% each year.
With that, 38% of businesses are already running on all-SaaS, while 80% plan to be among their peers over the next 3 years (2025).
In fact, 99% of companies already use at least one SaaS product of top companies such as Salesforce, Microsoft, and Zoom for day-to-day work.
#11. Pricing Statistics for SaaS
The average SaaS company spends at most 6 hours when deciding their pricing strategy.
But regardless of this, the pricing strategy places a significant role for SaaS companies. Around 98% of SaaS businesses earned positively from making core changes to their pricing policy.
Among these, 39% of companies used a value-based pricing approach, 38% opted for usage-based pricing, and 50% charged a user-based pricing approach.

54% of SaaS companies offer annual pricing plans to attain a higher customer lifetime value. With that, most of them provide a 30-day risk-free trial period.
In many cases, however, a 14-day free-trial program is also popular in the SaaS industry.
#12. Iteration Rate For Pricing
In today's dynamic marketplace, you cannot sustain a rigid pricing policy. Especially when you're a SaaS business, you need to iterate your pricing according to customer sentiments and market needs.
According to SaaStr, 'the world's largest community for business software,' more than 50% of its members plan to increase their SaaS prices next year.

Moreover, with an inflationary environment (U.S. projected inflation > 8% in Q3 2022), SaaS companies can answer churn rates with a logical response.
Besides, two-in-five companies that alter their pricing, report a 25% increase in their annual recurring revenue.
#13. Adoption
In a report by Forbes, the healthcare sector dominates SaaS adoption in the US. The SaaS adoption rate in the healthcare sector is growing at 20% per year and is expected to touch $50 Bn in value by 2028.
Besides, 50% of US government organizations are using SaaS products. This, in addition, adds an optimistic note toward the adoption of SaaS culture in the county.
Now in the context of the popularity and adoption of SaaS tools.
File sharing and collaboration tools hold the lion's share with a 20.9% adoption rate. Meanwhile, education-related SaaS applications have the second spot with a 7.5% adoption rate.
SaaS Customer Statistics
#14. How Many Users Continue Using SaaS Tools After Trial Period?
On average, 84% of new SaaS users (Bettercloud) continue using the services after using a free trial. In fact, 2X more customers are generated when you don't ask for a credit card during the trial period.
#15. Active Users Statistics
50% of customers using subscription-based SaaS services log in to their dashboard only once a month.
On the other hand, 14% of active paying clients use the cloud service once every week, while only 17% use them regularly.
#16. Customer Satisfaction Statistics
A SaaS company's revenue is directly impacted, provided the level and quality of customer care.
Even factually, 70% of SaaS trial users who are contacted by customer support for assistance tend to increase their engagement, 85% of customers are willing to pay more for a SaaS product in exchange for high-quality customer care.
SaaS Churn Statistics
The churn rate, also known as the attrition rate, is the rate at which customers stop using your product over a given period of time.
#17. Yearly Churn Rate For SaaS Companies
The annual customer churn rate benchmark for SaaS companies is 5.9%.
This might vary based on the company size and customer base, like:
-
For SaaS companies serving large organizations, the annual churn rate is 6-10%
-
For SaaS companies targeting SMBs, the annual churn rate is 31% to 58%
#18. Monthly Churn Rate For SaaS Companies
Similar to the annual churn rate, most SaaS companies prefer calculating customer churn rate on a monthly basis. This is a granular approach to cope with the dynamic marketplace.
SaaS companies targeting big clientele generally have a monthly churn rate of 0.5-1%, while those serving SMBs swing between 3-7%.

#19. Revenue Churn Rate
Revenue churn rate refers to the percentage of revenue loss incurred due to recurring customers not renewing their subscriptions.
A SaaS startup may have up to a 60% revenue churn rate. But again, it might vary based on company size and customer base.
Although 42% of customers feel that customer service is a vital factor affecting their decisions to stop using a SaaS product.
SaaS Content Marketing Statistics
#20. SaaS Spending for Content Marketing
As per reports, the average SaaS company spends $24,000 to $48,000 annually on basic SEO, which often includes content marketing. The written portion, however, accounts for $90,000 to $180,000 annually.
And if we combine all the content marketing activities – blogs, email marketing, webinars, landing pages, and P.R. spending, the spending will go somewhere around $342,000 to $1,080,000 a year.
#21. ROI From Content Marketing Efforts
Evidently, high-quality content marketing can generate a stunning ROI of 448% or more for SaaS brands.
Blogs, alone, contribute a significant portion of this ROI. The best-performing blogs in the SaaS market generate 48,800 organic searches per month. In comparison, an average SaaS blog receives 1700 website visits from organic traffic each month.
#22. Popular In SaaS Content
As said, blogs are a vital part of SaaS content marketing strategy. They are the top-performing ones! Especially long-form blogs with ideally more than 1,900 words.

Around 36% of SaaS companies leverage educational blogs to attract new users, while the other 26% focus on P.R./News-focused blogs.
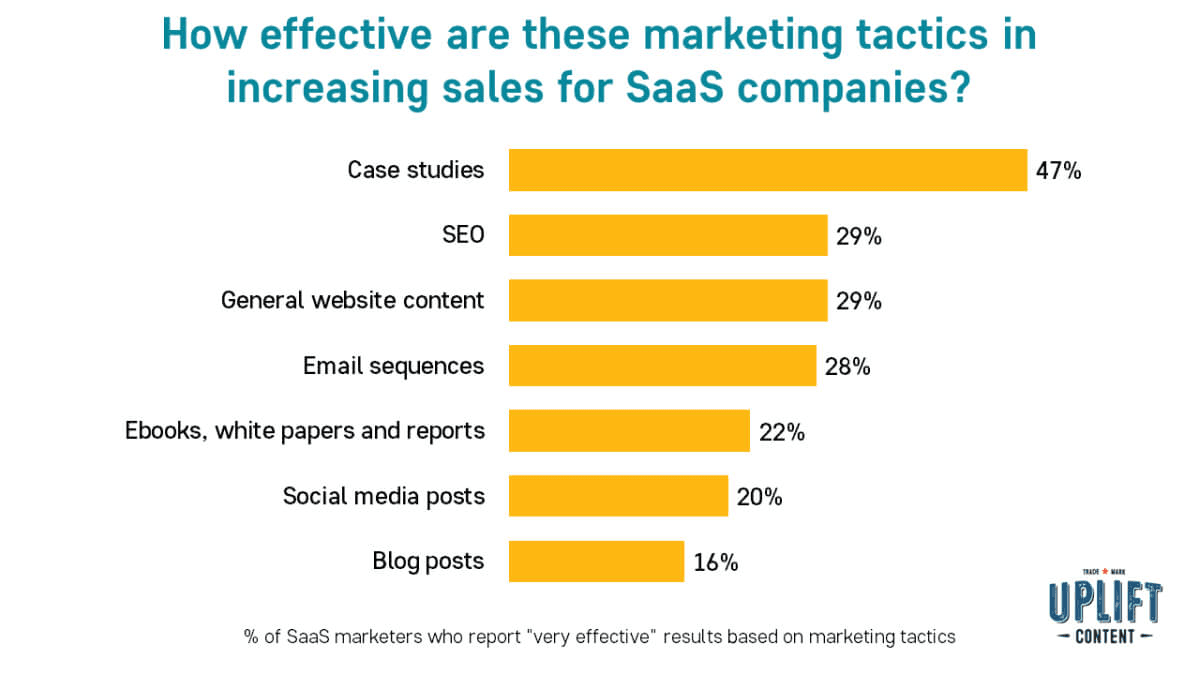
Other than blogs, 89% of SaaS companies leverage other types of content to attract visitors, such as Feature announcements (22%), tech walkthroughs (18%), landing pages (15%), webinars (65%), and case studies (62%).
#23. Most Effective Content Type
According to a survey by Uplift Content, 47% of SaaS companies find case studies are the most effective content type to generate sales.
#24. Most Effective Content Marketing Channel
For the most part, the effectiveness of marketing channels strictly depends on the product and industry of the company.
However, If you run a B2B SaaS business, LinkedIn is a treasure trove for your brand. Evidently, 97% of B2B marketers leverage LinkedIn to distribute content.
LinkedIn alone generates 3x more conversions than Twitter and Facebook together for B2B SaaS companies.
For example, Replicon, a SaaS company, used LinkedIn Inmail as part of their content marketing strategy and got an 11X better response compared to email.
But we are not saying emails are outdated. It typically depends on the company's individual marketing strategies. You see, 57% of companies still use email signup options for newsletters.
SaaS Challenges Statistics
#25. In Terms of Security
Security breach can be lethal for your business. ☠
Over 80% of enterprises have reported that their employees store clients' sensitive information on third-party cloud services without permission.
That's something to worry about because it's someone else's data stored by someone else while you remain seated in a blind spot.
#26. In terms of Staff Training
43% of customers have faced growing security incidents due to misconfiguration. These misconfigurations generally happen due to three major reasons:
-
Too many departments with access to security settings (35%)
-
Lack of visibility (34%)
-
Lack of SaaS security knowledge (22%)
-
Misappropriated user permissions (8%)

Despite the overwhelming demand for SaaS tools in coming years, most IT organizations still need to be more confident going SaaS.
Moreover, most SaaS organizations consider team offboarding as a tedious task within SaaS tools. It can even take up to 7 hours to offboard a single user.
SaaS Company Statistics
#27. On the basis of Market Capital
Apple ($2.9 Trillion Bn) is the largest SaaS company worldwide based on market capitalization.
The other two top players in the market were Microsoft, with $2.3 trillion in the bag, and Alphabet holds the third spot with $1.9 Trillion. Some other popular SaaS companies are also not far behind the case, such as:
-
Adobe: $243 Bn
-
Oracle: $223 Bn
-
Salesforce: $216 Bn
-
SAP: $149 Bn
As of Q1 of 2022, the top public SaaS company on the US stock exchange by market capital this year was Adobe Incorporated, followed by Salesforce, and Intuit.

#28. Revenue by Fiscal Quarter
Microsoft is the leading SaaS solution in terms of revenue by fiscal quarter. The company generated $17.7 Bn in its third fiscal quarter of 2022.
While Amazon generated $13.5 Bn, the second largest revenue by quarter, and IBM generated half of what Amazon made this quarter.
#29. Demand for Employees In SaaS Companies
There’s an ever-growing demand for employees in the SaaS sector.
As of 2019, Salesforce had 35,000 employees that doubled down to 73,541 in 2022. In just three years!

Similarly, Adobe, another promising SaaS provider, showed a similar trend regarding employee count. In 2021, almost 22,516 people worked for Adobe; by the end of 2022, it had a 25,988 employee count. An increase of 3,472 employees in just one year.
Key Takeaways
That was all about the best SaaS stats for 2022. We hope the blog covered everything you needed!
SaaS is going to be a $195 Bn industry by 2023. And there are no indications of its downfall. Besides, here're a few other exciting stats we came across:
-
North America is the most mature SaaS market globally
-
99% of companies are already using one SaaS product
-
A 1% increase in pricing strategy yields an average 11% increase in profit
-
Content marketing is the most effective marketing tactic for SaaS businesses
Take a look at our SaaS application, ‘Datapad’. It’s a no-code dashboard and report creation tool that allows anyone to create stunning dashboard and reports from well within their mobile phones - No Desktop Needed.
Want to try out our mobile app to track KPIs on the go? Scan the QR code below and try it now!