With over 15 Million ecommerce businesses across the globe, it’s challenging to make your online store stand out from the rest.
This competitive market has pulled back ecommerce store owners to survival mode. Meaning, they’re more focused on sustaining their business, rather than growing it.
What if we tell you that a simple KPI dashboard can help you take over your competitors and allow you make better business decisions in real time?
In this article, we have discussed all about ecommerce KPI dashboards and why they are important to your business’s success in 2023.
What is an Ecommerce KPI Dashboard?
An ecommerce KPI dashboard is a collection of KPIs inclined towards providing an overall performance of your ecommerce store. It allows store owners to track and optimize every stage of their customer journey, from the first touch to purchases.

Basically, the ecommerce dashboard helps you get every analytics covered under one roof. But for that, your dashboard must tune in with the right set of KPIs to deliver the best results.
For the most part, ecommerce KPIs should be measurable, quantifiable, and capable of providing actionable insights about your store's performance. In addition, they should answer questions about the current state of your business to help you make informed decisions.
For example, a Sales KPI should derive the total sales generated, the sources of revenue, a comparison between predicted and actual sales, and ways to improve sales.
Likewise, several other KPIs are used to build a comprehensive ecommerce KPI dashboard.
But the question you might have in your mind is - how can you figure out a good KPI for your dashboard?
A good KPI is a blend of the following attributes:
-
Simple
-
Relevant
-
Aligned
-
Actionable
-
Measurable
Now that you know the basics of ecommerce KPI dashboards and how to identify good KPIs for it, let’s walk through the importance of an effective dashboard for your online store.
Why Is It Important to Track Ecommerce KPIs?
With over 2.14 Bn expected online shoppers and 2.9 trillion dollars worth of sales in 2021, ecommerce analytics can be a deal-breaker for your online store.

What if tens and thousands of people visit your store but don’t complete the purchase cycle for one of the many reasons?
Or, what if your loyal customers start switching to your competitors due to a lack of personalization you have in your store?
You have the data but neither you have any idea what to do with it, nor you have a magic wand to view and transform raw data into actionable and deeper insights.
Luckily, you have a wand (two in fact 😉) you didn't know about - KPIs and Metrics.
Now, while ecommerce metrics can help you analyze data and gain in-depth valuable insights into daily business operations, KPIs can help you track the progress of these metrics towards long-term goals and objectives.
With KPIs and metrics you get a clear understanding of your wrong doings and therefore you can tweak your online business strategy based on data-driven decisions.
But most importantly, the insights generated from ecommerce KPIs can be helpful in educating and training your sales and marketing teams. Thereby improving the overall performance of your ecommerce business.
Eventually, an ecommerce KPI dashboard can help you pump millions of dollars into your account, but only if you know the right ones to keep track of.
What are the Most Common Ecommerce KPIs to Track?
Metric #1. Customer Acquisition Cost
Customer Acquisition Cost (CAC) measures the cost related to acquiring a customer. You can measure it by analyzing your marketing spend and how it breaks down per customer.
The lower your acquisition cost, the better.
Here's how you can do that:
Customer Acquisition Cost = Cost Spent on Acquiring Customer / Number of Customers Acquired
For example, in Q1 of 2022, Tim invested $1000 in marketing for his online shoe store. As a result, he was able to acquire 50 new customers.
CAC = $1000/ 50 = $20
Therefore, Tim's CAC for the Q1 was $20.
This metric helps you improve your return on investment by figuring out the most cost-effective way of acquiring new customers.
Note: For a profitable ecommerce store, the average order value should always be greater than the cost per acquisition.
Metric #2. Shopping Cart Abandonment Rate
Shopping Cart Abandonment Rate (CAR) is the percentage of visitors adding products to the chart but, for some reason, end up not purchasing them.
You would rate this as the #1 KPI to measure if we say that, on average, around 69.57 percent of customers worldwide abandon shopping carts (more than half the traffic visiting your store).
To calculate CAR use this formula:
Cart Abandonment Rate = 1- (Total Number of Successful Purchases / Total Number of Shopping Carts Created) x 100
By running retargeting ads for these cart abandoners, you have a high chance of hooking them back to the checkout process.
Try luring them with mind-boggling offers, personalized emails, or anything that persuades them to re-open your website and complete the purchase.
Metric #3. Average Order Value
The Average Order Value (AOV), also known as the Average Market Basket, is the average amount of money customers typically spend on one single order.
Calculation of this ecommerce KPI is pretty straightforward:Average Order Value = Total Revenue / No. of orders
Now, why is it an important KPI to track?
Identifying the purchasing power of your customers can let you set benchmarks for them. You can get shoppers to buy more products than they planned for.
Here are a few ideas to get started:
-
Up-sell or cross-sell products
-
Set discounts like 'Buy 3 Get 1 Free or 'Buy 3 get 30% discount’
-
Offer free shipping after a specific bill amount
Metric #4 Customer Retention Rate
Customer Retention Rate (CRR) represents the rate at which customers buy from you repeatedly over time. Generally speaking, it helps you identify your recurring customers.
The formula to calculate CRR goes like this:Customer Retention Rate = (A - N) / E x 100
Where:A = Number of Customers at the End of a Period
N = New customer added during the period
E = Total number of existing customers at the beginning of the period
Identifying your recurring customer is important because these customers spend 67% more than new customers.
Plus, the success rate of selling to an existing customer is 60-70%, while the success rate of selling to a new customer is only 5-20%.
Either way, this KPI can help you increase profitability and build customer loyalty simultaneously. The average CRR of the ecommerce industry is 30%. However, the more, the better.
Metric #5. Customer Lifetime Value (CLV)
Customer Lifetime Value (CLV) is the degree of measurement of the revenue generated from individual customer’s over their relationship with the company.
To calculate CLV use this formula:CLV = (Average Order Value x Number of Annual Purchases Made by the Customer x The Average Length of Customer Relationship in years)
Comparing CLV to Customer Acquisition Cost (CAC) lets you figure out the profitability of each customer.
Suppose a customer spends $100 every time he visits your ecommerce store. He visits the website twice every month (24 times per year) and has been doing that for the past five-years.
The shop owner can find its CLV by the following formula:CLV = 100 x 24 x 5 = $12,000
The CLV for that particular customer is $12,000
Metric #6. Churn Rate
In general terms, the churn rate is the rate at which customers leave your brand in a given period.
Here's how you track your fleeing customers:Churn Rate = (B - E) / B x 100
Where:B represents the no. of customers at the beginning
E represents the number of customers in the end
Note: To calculate the annual churn rate multiply the formula by 12.
Churn Rate is an important ecommerce metric as it helps you identify the percentage of existing customers willing to abandon your store. In addition, this data can be further used for customer retention purposes.
Industry Tip: Customer retention cost is 5X cheaper than customer acquisition cost.
Metric #7. Net Promoter Score
The Net Promoter Score KPI is an ecommerce metric that gives you insights into how many customers are willing to recommend your products to others.
The formula to calculate Net Promoter Score is:
Net Promoter Score = %Promoters - %Detractors
Where,
Promoters are the segment of people who are likely to recommend your products. In contrast, Detractors are the unhappy customers who won't recommend you to anyone.
Tracking NPS will give you a clear understanding of your business regarding customer satisfaction and brand loyalty.
Metric #8. Product Return Rate
The Product Return Rate KPI derives the percentage of sale orders that have a product return.
We can segment PRR into three categories:
-
Return Orders
-
Refunded Orders
-
Exchange Orders
To calculate the above metrics you can just divide them with the total orders placed at the same time.
Note: To calculate the percentage, divide each of the metrics by 100.
If your PRR is high, that means you're unable to fulfill customer expectations from your product or services.
Industry Fact: The average ecommerce return rate is 18.1%; anything below this percentage is a well-to-do return rate for your store.
Metric #9. Conversion Rate
Conversion Rate in ecommerce determines the rate at which potential customers, or as we may say, website visitors, are converting into actual current customers.
Here's how you can figure it out:
Conversion Rate = (Total Number of Website Visitors / Total Number of Conversions) x 100
Note: The data collected on the number of visitors and the number of conversions should have the same timeframe.
Conversion Rate isn't just a buzzword. With your store's conversion rate know-how, you are one step closer to becoming a six figure ecommerce store owner.
Conversion rate optimization can immensely help you convert more visitors into customers by measuring the performance of your store, marketing campaigns, and marketing strategies.
Metric #10. Cost of Goods Sold
Cost of Goods Sold (COGS) is the overall cost incurred on the goods before the sale has been made. For example, manufacturing costs, employee costs, overhead costs, etc.
To calculate COGS, you need four data pieces:
-
Initial Inventory value
-
Product-related direct and indirect costs
-
Additional inventory Purchased (if any)
-
Ending Inventory Volume
And then, use this formula to derive your COGS:
Cost of Goods Sold = Beginning Inventory + (Purchase Costs + Labor Costs + Materials Costs + Supplies Costs + Miscellaneous Costs) - Ending Inventory
Note: Since GOGS plays a vital role in calculating Gross Profit, any error in its calculation will hamper the results from other metrics in the chain.
Metric #11. Gross Profit
Gross Profit is one of the most important metrics to measure the performance of your online store. It shows you your business's total profit after deducting all possible costs incurred in production and distribution.
Here's an easy formula to calculate the most crucial metric:
Gross Profit = Total Cost of Goods Sold / Total Amount of Sales
COGS and sales should lie under the same timeframe. Plus, the higher the Gross Profit, the higher the revenue and vice versa.
Metric #12. Revenue Per Visitor
Ecommerce companies use Revenue Per Visitor (RPV) to measure the amount of revenue your business generates each time a customer visits your website.
Here's how to figure it out:RPV = Revenue / Visitors
For example, if your revenue from August to November is $50,000 and your site receives 5,00 visitors during the quarter, your RPV would be
Revenue Per Visitor (RPV) = $50,000 / 500 or $100.
Industry Jargon: RPV helps you gather in-depth insights about your user behavior, which some other key metrics, such as Conversion Rate and Average Order Value (AOV), can't answer.
Metrics #13. Inventory Turnover Ratio
This ecommerce KPI acts as a financial ratio that helps store owners measure the number of times their inventory is completely sold in a given time period.
Most importantly, the Inventory Turnover Ratio helps you understand how well you are turning your inventory into sales or if your business has excess inventory compared to its overall sales.
Here's how to calculate ITR:
Inventory turnover = Cost of Goods Sold / Average Inventory for the Same Period
The ratio also helps you predict the amount of inventory to be purchased based on past online sales. Thereby keeping a balance between inventory and order volume so you never run out of stock.
How to Set Up An Ecommerce Metric Dashboard in 5 Steps?
For this step by step guide, let’s show you how you can track ecommerce KPIs via Datapad.
Step 1: Define Your Goal
Before we get started with the dashboard, it's important to decide which ecommerce KPIs you should track.
To get started, find answers to questions like, "What outcomes are you expecting from your dashboard?"
Try to define your business goals and KPIs around these four factors:
-
Relevance to your business performance
-
Accountability for every activity
-
The required frequency of measurement
-
Supported by all executives in the organizational pyramid
Step 2: Setup a Dashboard
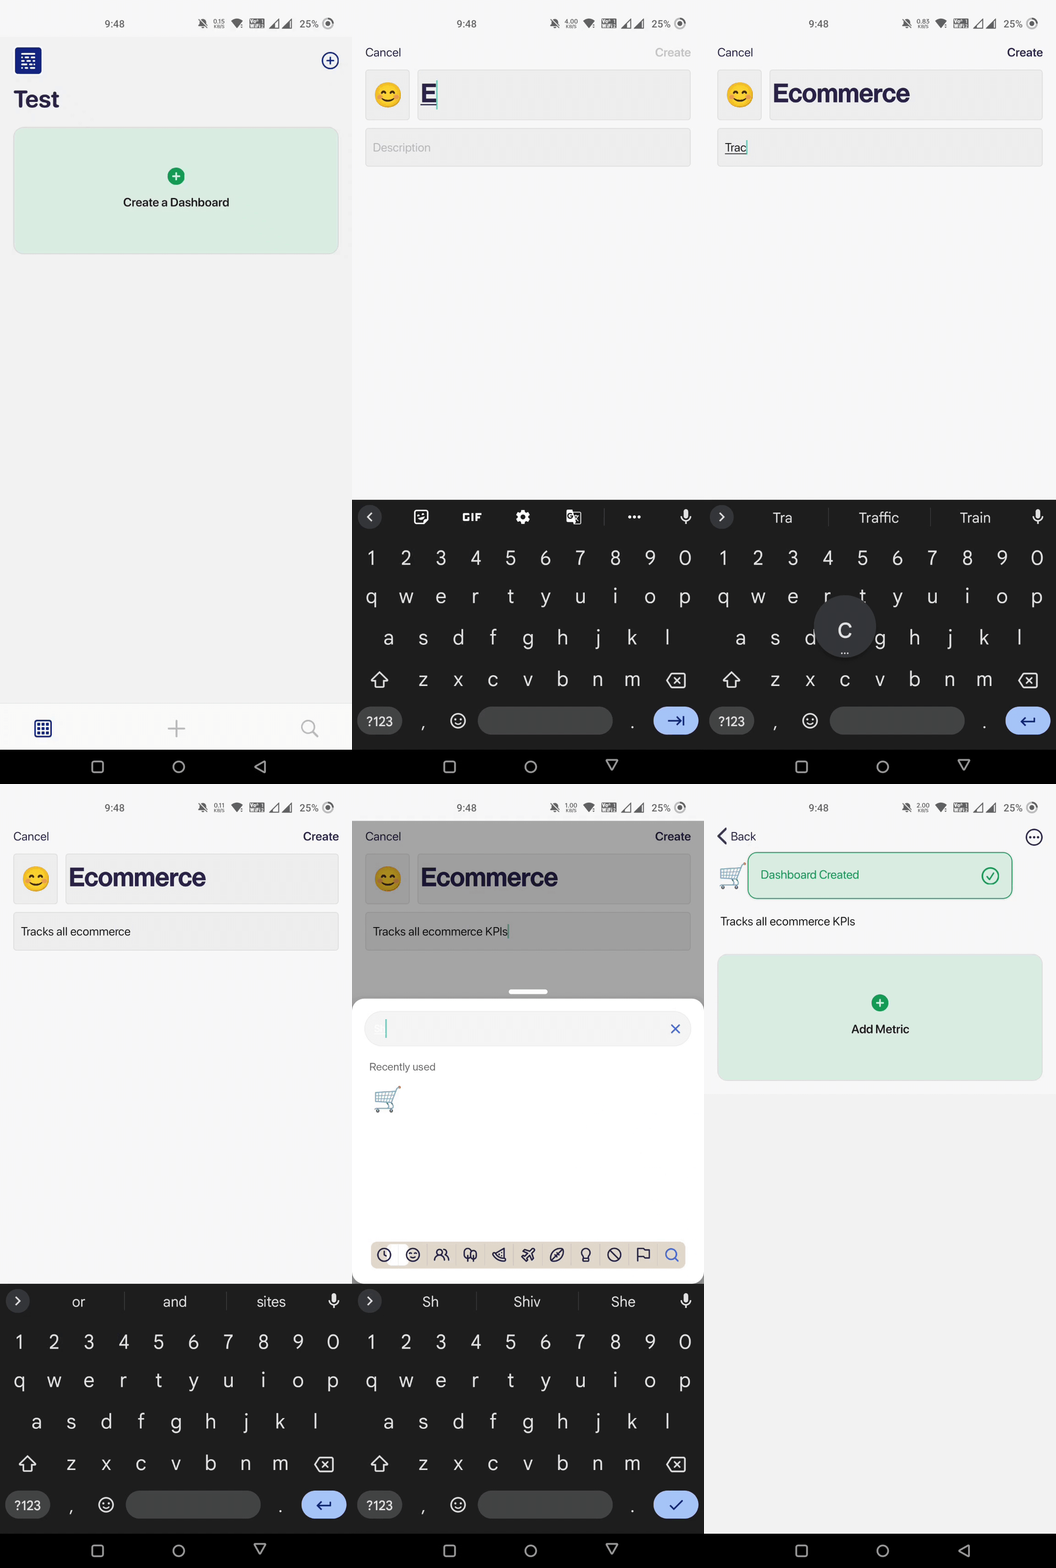
Open the Datapad app and tap on set up your account by signing up. Tap on ‘Create a Dashboard’ to get started.
Add Title, Description, and Emoji to name and customize the dashboard. In this case, we will be tracking ecommerce KPIs so let’s go ahead and name our dashboard ecommerce.
After filling out the fields, click on ‘Create.’

Step 3: Add Your KPIs Manually or Use a Data Source
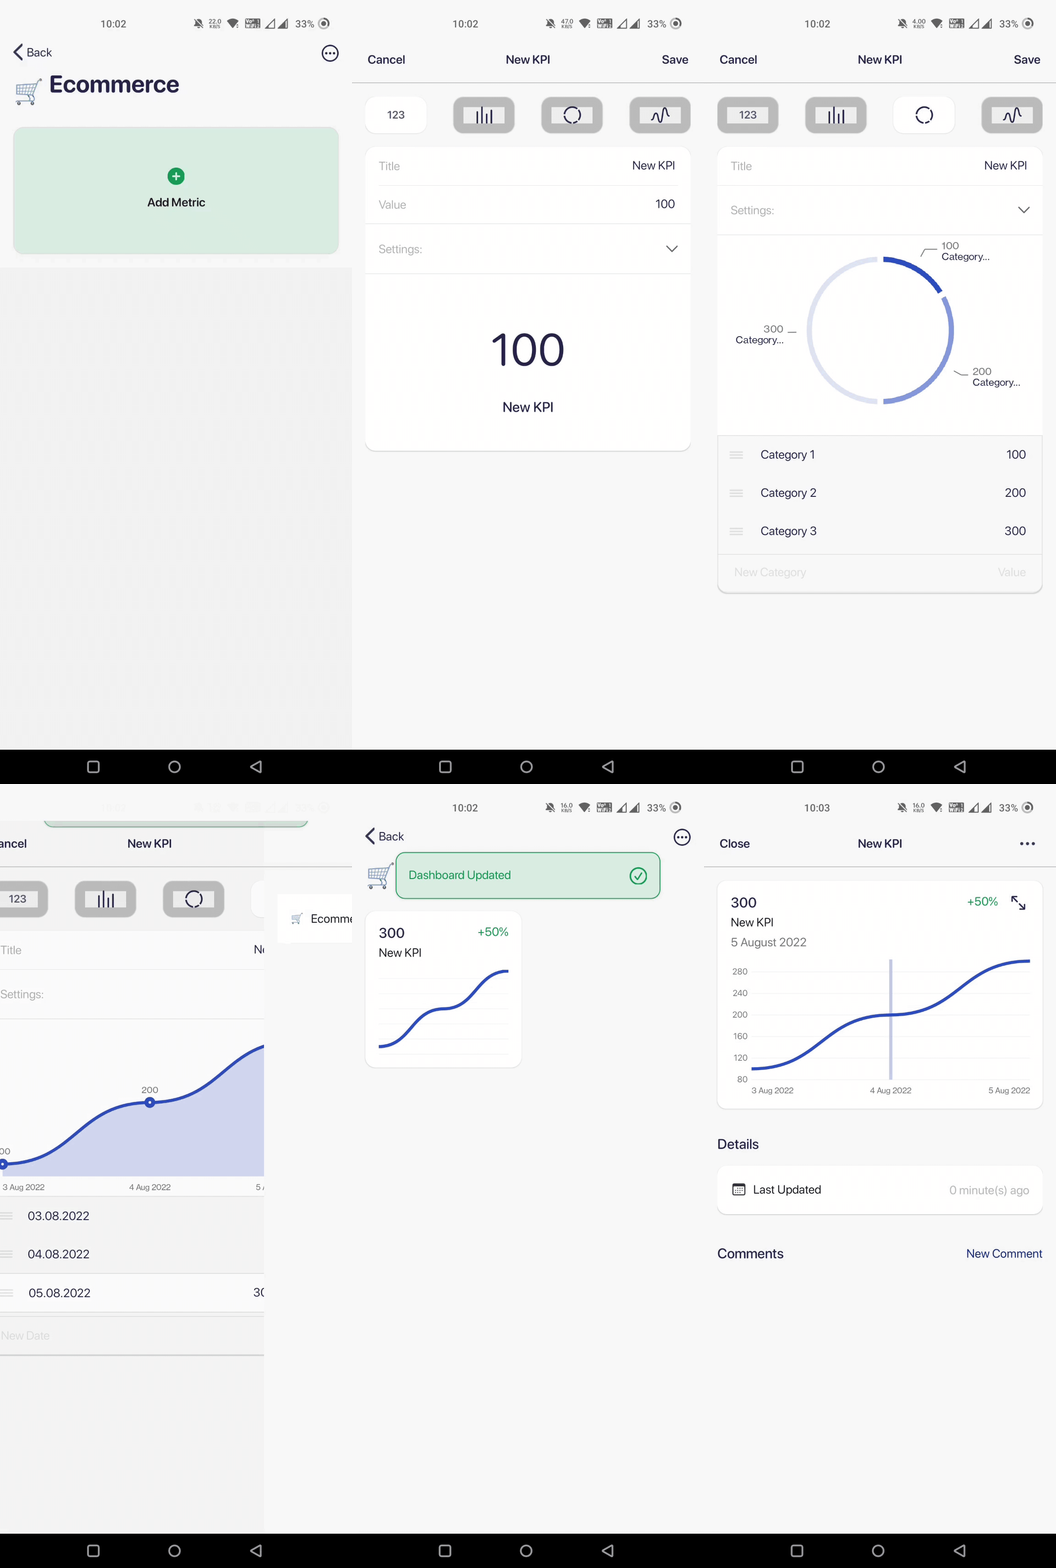
To add KPIs manually, tap on ‘Add Metric’ and select Enter Manually.
-
Give KPI a proper title
-
Set the value
-
Customize the color, date, and set goal
You can then choose the type of graph you want for your KPI (bar graph, pie chart, or line graph).

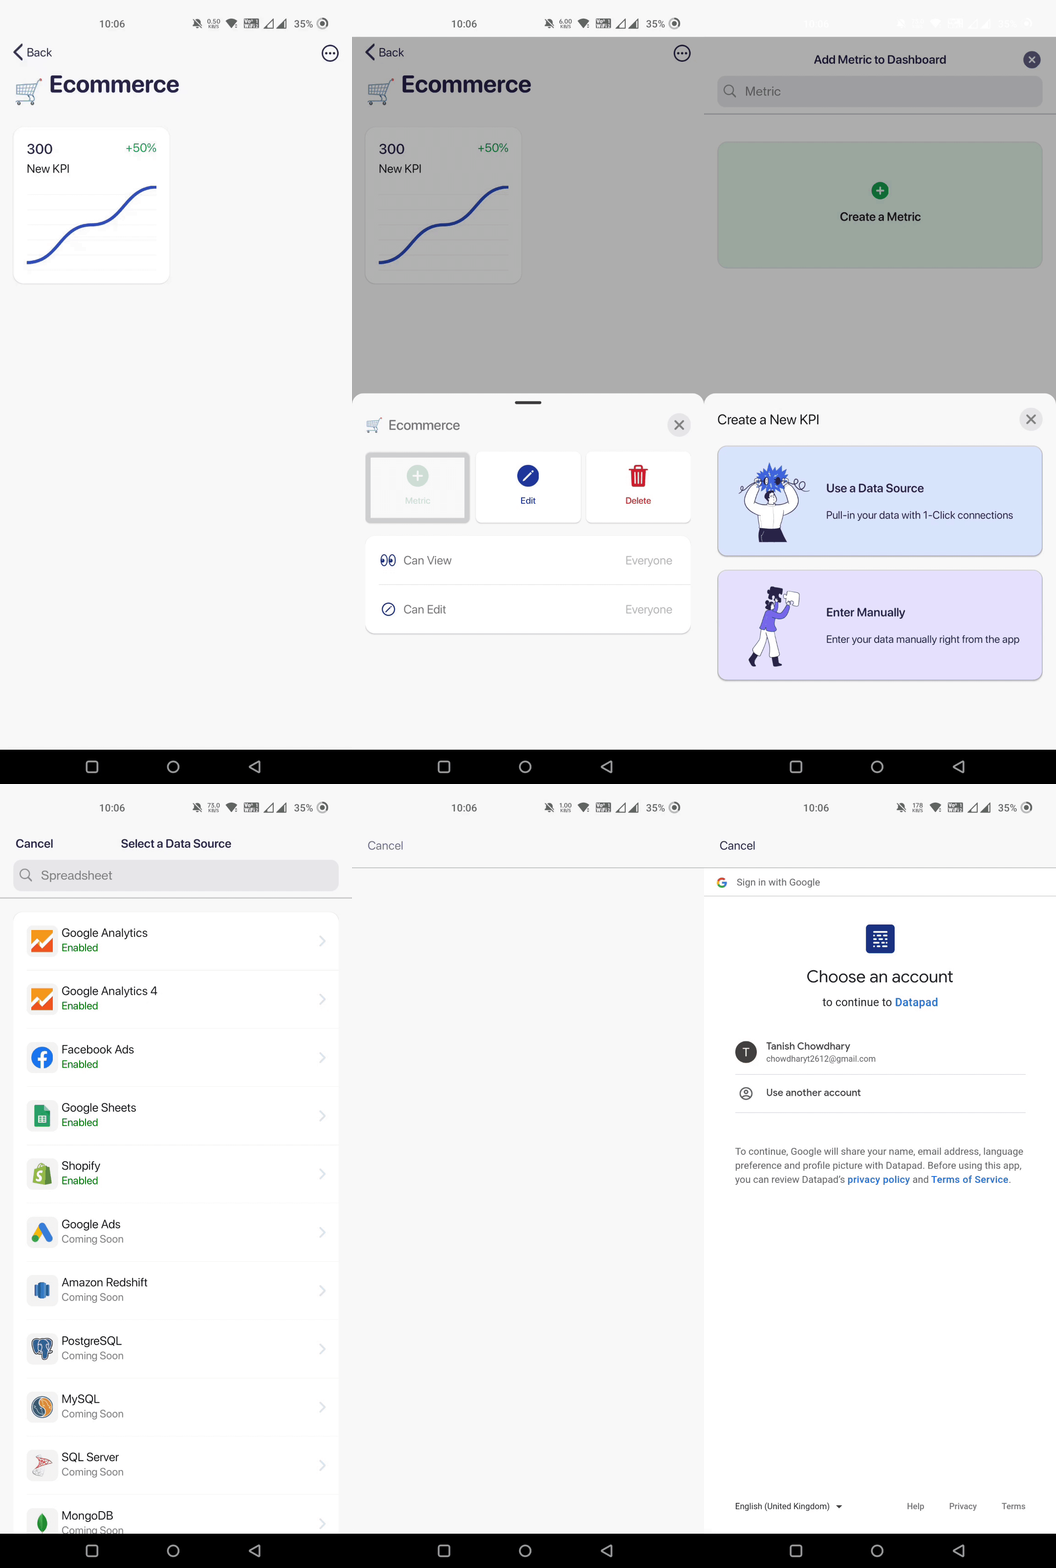
To add KPIs via Data source, tap the circle with three dots in the top right corner -> click on the + sign that says Metrics -> tap ‘Use a Data Source.’
Select the data source you want to import the data from.

Step 4: Onboard Your Team
When you try to accomplish business growth, you need a dedicated marketing and sales team to join you in tracking key performance indicators. Datapad lets you bring your team on board within minutes.
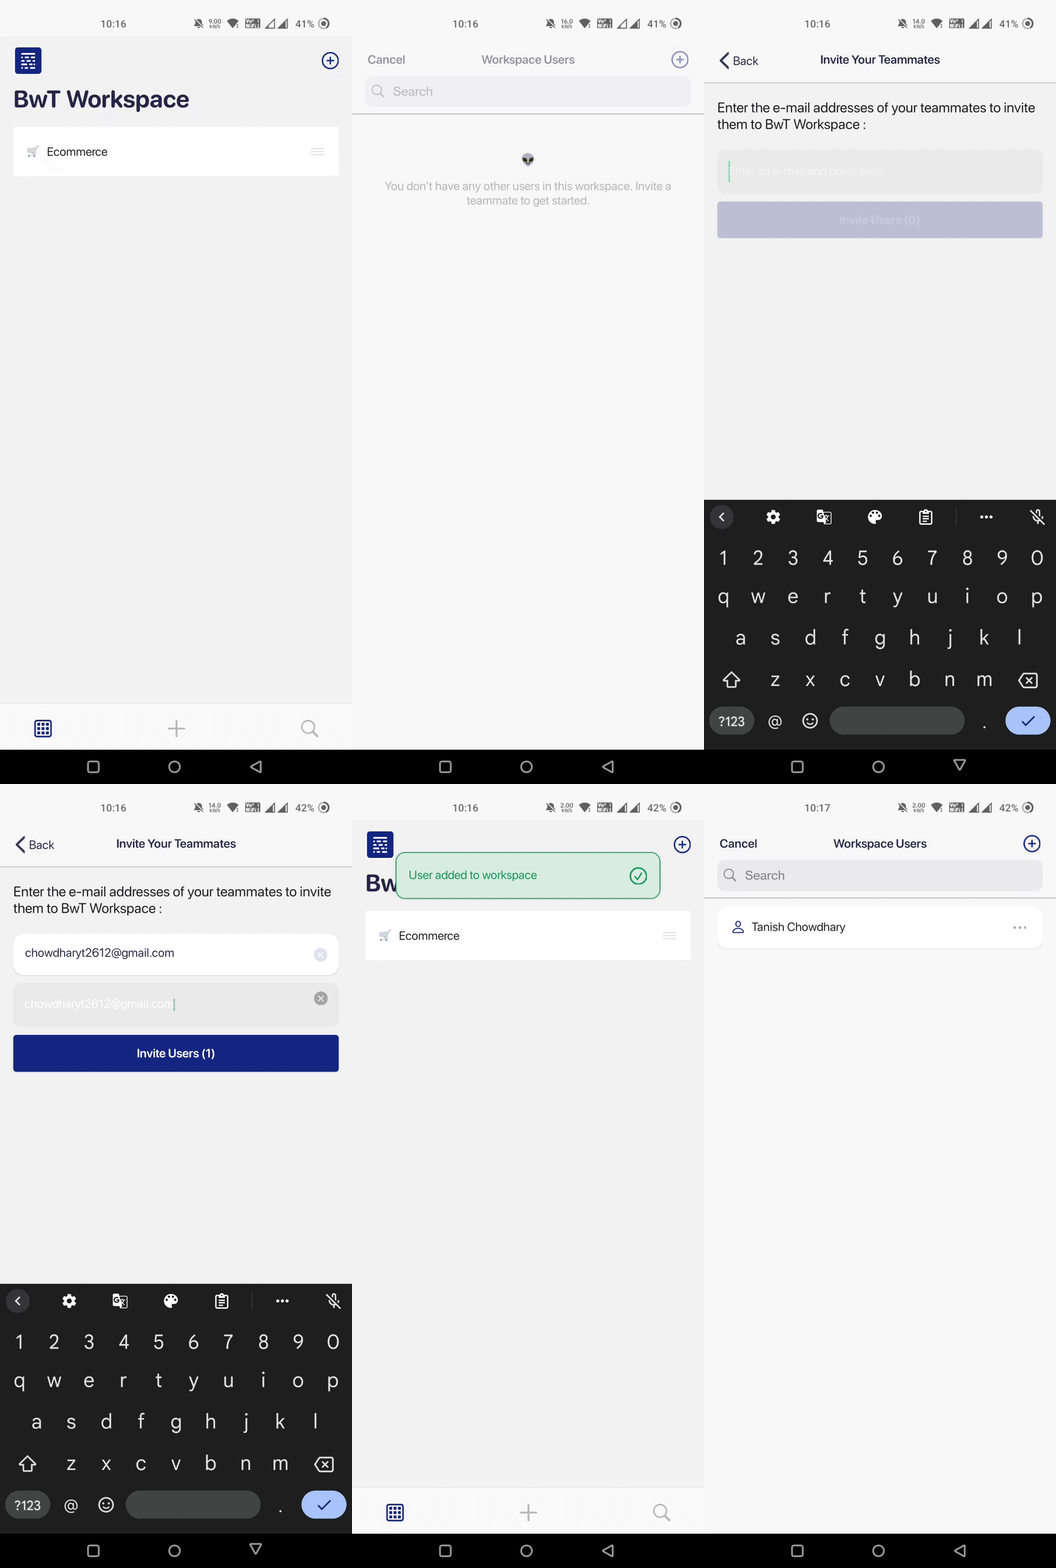
To add team members to your Datapad account:
-
Click on the left hand side logo of the app
-
Go to Manage users
-
Click on the plus sign on the right hand side corner
-
Enter the email address of your team member and tap invite users

What’s more, you can quickly chat with your teammates around the KPI dashboards you create via the comment section present below every KPI in the dashboard.

Step 5: Monitor Your KPIs and Get Updated with Notifications
The best part about Datapad is its real-time notifications. Wherever a KPI falls short of a set goal or someone comments or makes edits on the dashboard, you get a push notification, so you can stay in the loop.
Have All Your Ecommerce KPIs in Your Pocket
Datapad is a mobile-friendly KPI tracking and dashboarding software that allows ecommerce business owners and managers to analyze important business KPIs from their mobile phones.
Unlike other KPI tracking software in the market, dashboards created using Datapad are highly-responsive and compatible with all known devices.
Evidently, they help you to:
-
Track all your KPIs on your fingertips
-
Effectively communicate and collaborate with your team
-
Automatically import data from Google Analytics, Shopify, or any other ecommerce platform
-
Measure your ecommerce store performance from anywhere
-
Monitor change in KPIs and metrics in real-time
The best part is that Datapad is in its beta testing phase, and you can join the waitlist to try it for free today.
Related: We Reviewed 8 Best Ecommerce Reporting Tools in 2022 [In Depth Guide]
![13 Metrics You Should Have in Your Ecommerce KPI Dashboard [2023]](/_next/image?url=https%3A%2F%2Fframerusercontent.com%2Fimages%2FSf75HzIfKXBqtODStsRhIaThAk.png&w=3840&q=75)