![We Reviewed 8 Best Ecommerce Reporting Tools in 2023 [In Depth Guide]](/_next/image?url=https%3A%2F%2Fframerusercontent.com%2Fimages%2FIapZW1HDpGf5tbfLjb2x9n03Y.png&w=3840&q=75)
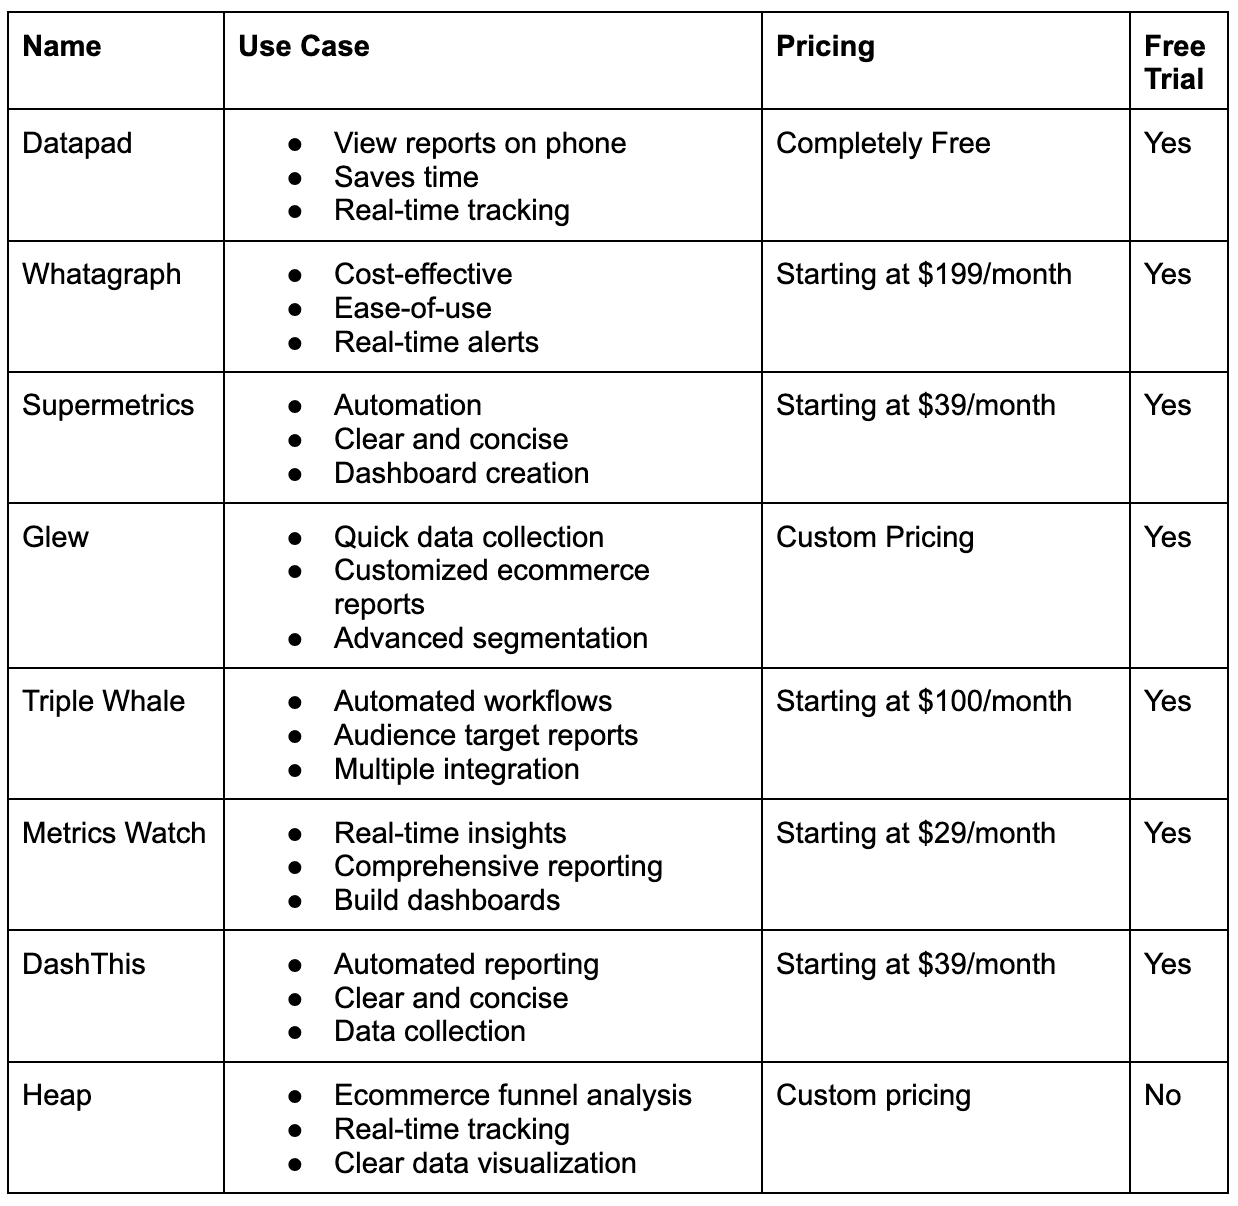
Some of the best ecommerce reporting tools are Datapad, Whatagraph, Supermetrics, Glew, Triple Whale, Metrics Watch, Heap, and DashThis.
In this guide, you will find a detailed review of all the above-mentioned ecommerce reporting tools and learn how you can track and analyze ecommerce trends for your store.
So let’s begin!

What is Ecommerce Reporting?
Ecommerce reporting is the process of collecting and analyzing data from an ecommerce business. This data can include sales, customer behavior, website performance, and more.
The goal of ecommerce reporting is to provide insights into the performance of the business and identify areas for improvement. This data can be used to make informed decisions about marketing, product development, customer service, and more.
Ecommerce reporting can also help you identify areas of opportunity and potential areas of improvement. Additionally, ecommerce reporting can help you track the success of your campaigns and measure the ROI of your investments.
Another way ecommerce reporting can also help you is by providing a snapshot of your store's performance at any given time.
Let’s now talk a little bit about the use cases of ecommerce reporting tools.
What are the Use Cases of Ecommerce Reporting Tools?
#1. Saves Time and Resources
Data collection has become a hectic process with the widespread use of multiple platforms for marketing and other activities.
🤔 Think About It: Pulling data from different platforms, putting them together into a spreadsheet (manually), and then visualizing them to make them presentable to your team.
Tiring enough! 😪
Ecommerce reporting tools help you perform the entire data collection process once and for all. You need to set up or integrate your data points with the reporting tool for initials.
Once it's done, the tool will automatically import data at periodic intervals and present it to you via easy-to-understand visuals.
Imagine the number of hours per employee you can save by automating this process.
#2. Cost-Effective
An Ecommerce reporting tool is a win-win choice for your company.
You see, the market is highly competitive, and you can get a reporting tool at a price much less than hiring a full-time data analyst.
Besides, AI-driven reporting tools help you perform tasks quickly and error-free. It automatically eliminates repetitive, unnecessary data entry and analysis tasks and gets you straight to the main process of measuring KPIs.
#3. Easy to Work With
Think of two situations:
Situation 1: A spreadsheet with 100+ columns and tons of data categorized by date, name, and value.
Situation 2: A neat and clean ecommerce dashboard that shows the exact metric you want via easy-to-understand visuals.
The second situation is what most reporting tools offer. Instead of baking around countless numbers, reporting tools show data via easily customizable dashboards.
Today, most reporting tools offer a user-friendly interface. However, you always have the flexibility to change the look and feel of your dashboard to your pleasure.
Moreover, you can instantly view the results of any activity, including email campaigns, advertising, and web traffic.
#4. Offers Real-Time Decision Making
Manual reporting consumes time. And by the time your report is ready, it's already a week late from the day data was collected.
This time gap often prevents organizations from making confident decisions under time-sensitive situations.
Ecommerce reporting tools help everyone, from your new marketing analyst to your CMO, to stay up to date with what's happening - and fix mistakes before they can hamper your sales.
#5. Clear and Concise
A reporting tool presents complex data via stunning data visuals. And thus, from investors to stakeholders, everyone can get an at-a-glance summary of the company's performance.
Basically, you don't need to answer "So.. what's the point of all this?" question again – a reporting tool will do that for you.
What Are the Best Ecommerce Reporting Tools?
If you don't want to read the whole article, you can check the table below or watch the short video we prepared for you.
#1. Datapad
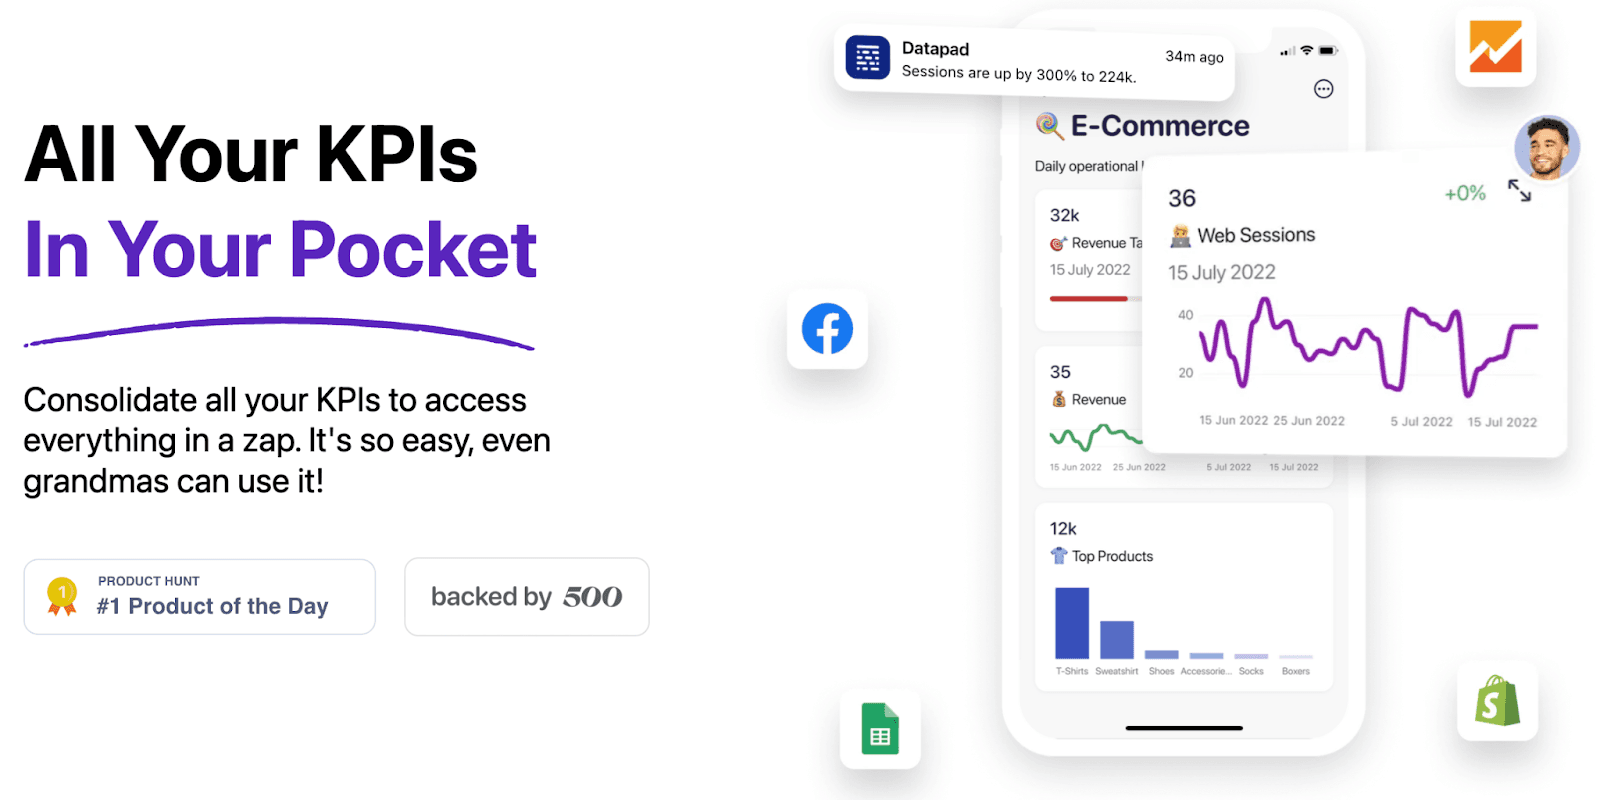
Datapad is a mobile-friendly dashboarding and reporting tool that helps eCommerce store owners collect, monitor, and analyze their online store data via stunning dashboards and reports.
Here're some key features of Datapad.
Key Feature #1. Instant Access to Reports
Datapad is a mobile-first tool that allows you to access your reports from your mobile phones. Its dedicated mobile app (available for Android and iOS) works seamlessly on all small-screen devices, allowing you one-click access to your KPIs.
Moreover, we tested our tool for compatibility, and guess what? It's pixel-perfect for all small-screen devices. Unlike other dashboarding tools, you won't encounter half-volley graphs or buffering reports.
All you need is a stable network connection to create, track, and monitor your eCommerce KPI reports hassle-free.

#2. Ease of Data Import
Pulling data to your dashboard or reports is no big deal with Datapad.
Our tool allows you to import data both ways:Automatically and Manually.
To automate the data import process, you can use Datapad's one-click integrations to popular platforms and data sources such as Google Analytics, Google Sheets, Facebook Ads, and more.

Besides, if you plan to add on some data manually, you can do that as well.

#3. Hassle-Free Collaborations
Datapad allows you to communicate and collaborate in real time. Firstly, it enables you to invite team members onboard via email invites.
Secondly, it allows you to comment under specific KPIs to strike up a discussion with your team.
Here's how it works.
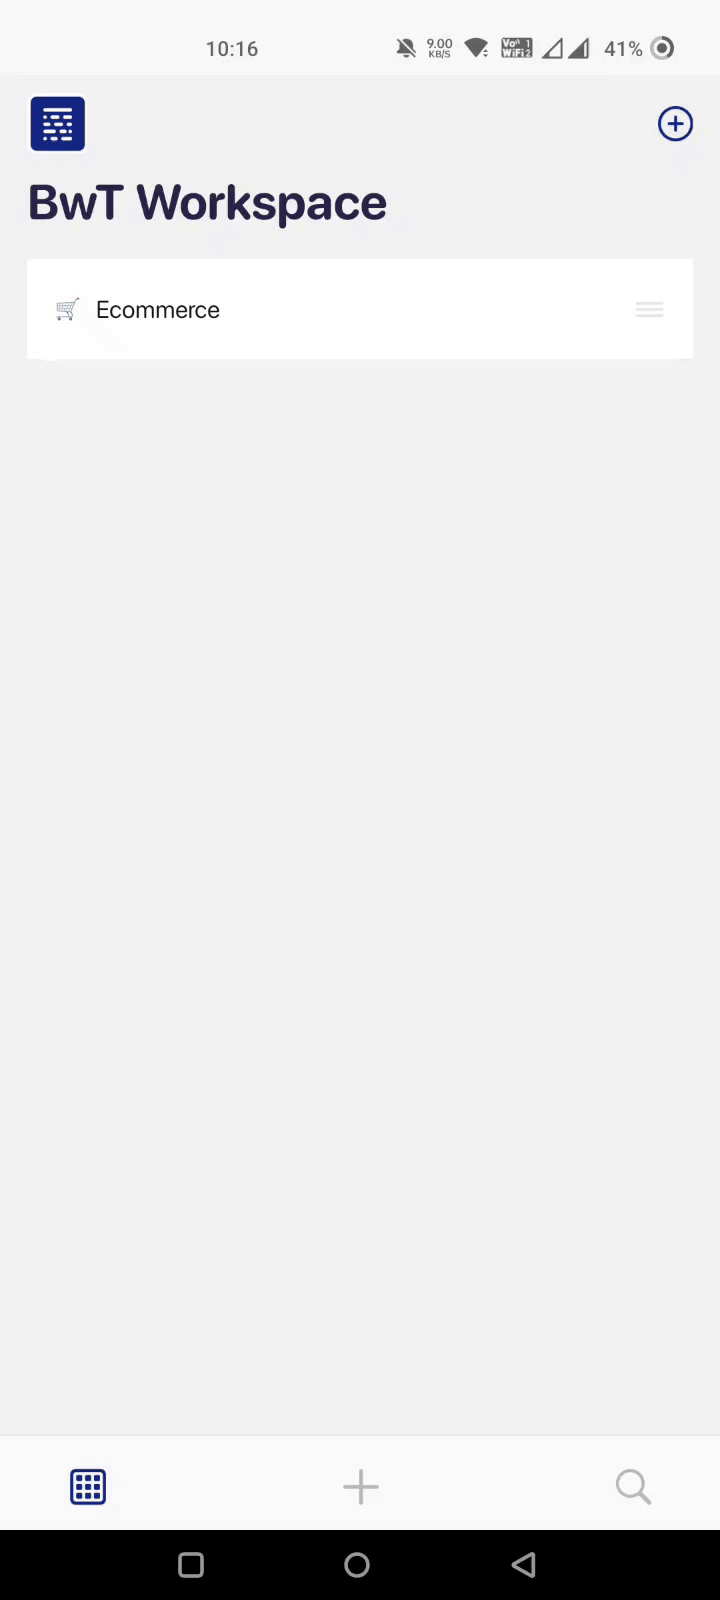
Furthermore, your team can reply just below your comment and keep the discussion alive until the situation stabilizes.
This allows you to be active among your team members even if you're miles away.

Pricing
Datapad is a completely free tool. For a limited time we are giving free access to our Early-Adopters ❤️.
Pros and Cons
✅ Easiest Dashboard tool for Ecommerce
✅ Has the best mobile app
✅Great looking dashboards
✅Team is shipping new features every month
❌ Not great for in-depth data analysis
❌ Not a lot of integrations right now
❌ Web version of the app is not released yet
#2. Whatagraph
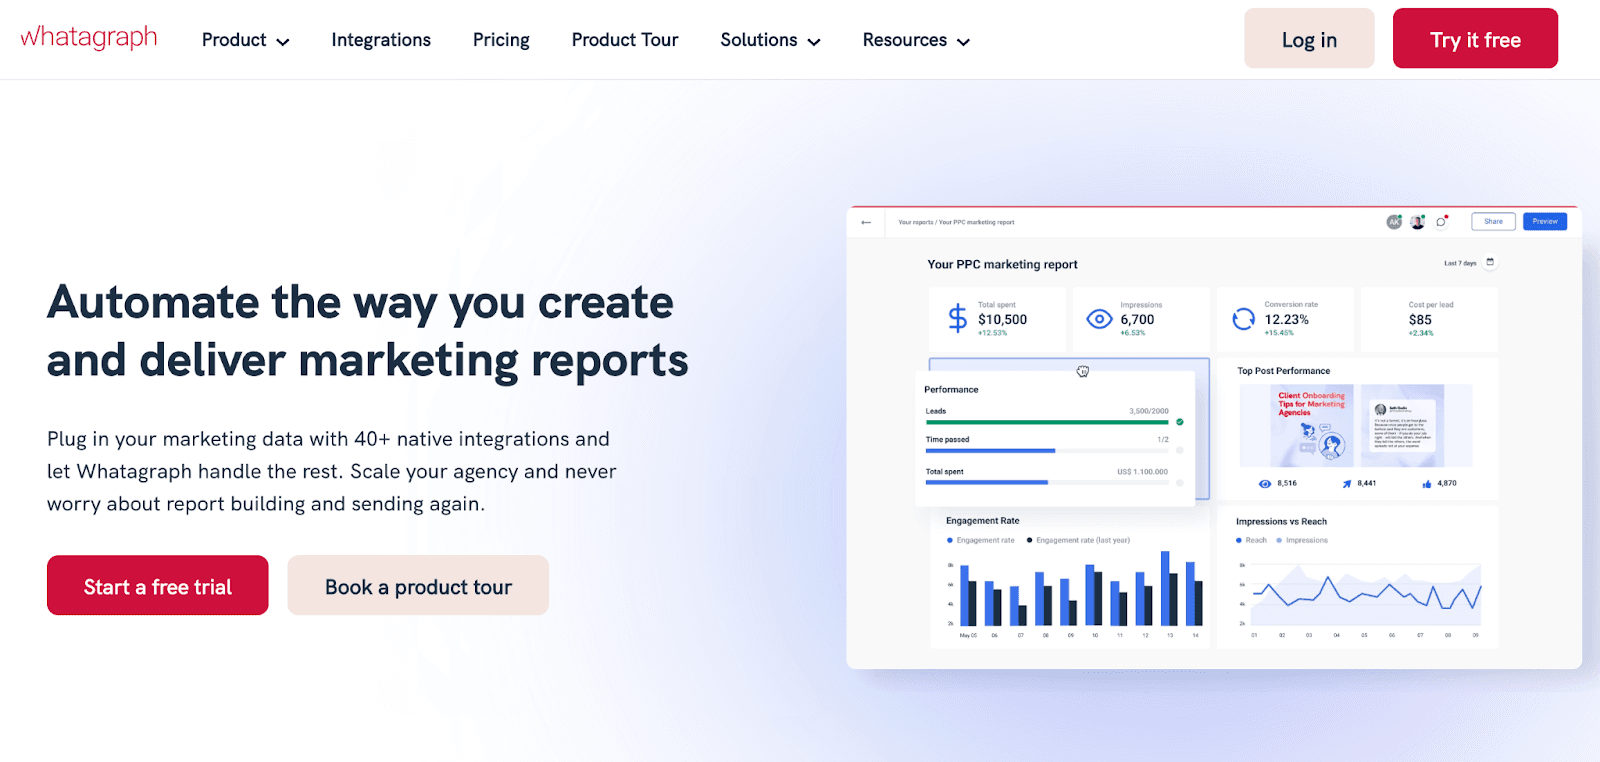
Whatagraph is an ecommerce reporting business intelligence tool that helps businesses make data-driven decisions. It provides comprehensive insights into website performance, customer behavior, sales, and more.
With Whatagraph, businesses can easily track their progress, identify areas for improvement, and optimize their strategies. Whatagraph also offers automated reports and customizable dashboards, making it easy to stay on top of your ecommerce data.
Features
-
Automated Reports: Whatagraph automatically generates reports based on your ecommerce data, allowing you to quickly and easily track your progress
-
Customizable Dashboards: Create custom dashboards to view your data in an easy-to-understand format
-
Data Visualization: Visualize your data with charts and graphs to gain insights into your performance
-
Multi-Channel Tracking: Track performance across multiple channels, including social media, email, and more
-
Data Export: Export your data to CSV or Excel for further analysis
-
Real-Time Alerts: Receive real-time alerts when your performance changes
Pricing
Whatagraph provides a competitive pricing model based on the number of data sources and users you require. Plus, it offers 30-days money back guarantee on all its plans:
-
Professional: $199/Month
-
Premium: $299/Month

The platform also offers a custom plan with 100+ data sources and unlimited users. You can get in touch with their sales rep to get a quote.
Pros and Cons
✅ Automated reports and dashboards make it easy to stay on top of your ecommerce data
✅ Data visualization tools help you gain insights into your performance
✅ Multi-channel tracking allows you to track performance across multiple channels
❌ Limited data sources, as it only supports tracking of website, sales, and customer behavior data
❌ Can be expensive for businesses with high amounts of data
#3. Supermetrics

Supermetrics’ eCommerce Reporting Tool is a powerful solution for tracking and analyzing your eCommerce performance. It offers comprehensive reports, automated insights, and actionable data to help you make informed decisions and maximize your online store's success.
Features
-
Automated Data Connectivity: Supermetrics can easily and automatically integrate data from a variety of ecommerce platforms, including Shopify, Amazon, Magento, BigCommerce, and more
-
Quick and Accurate Analysis: With Supermetrics, businesses can quickly and accurately gain insights into their customers purchase behavior, website performance, advertising campaigns, and more
-
Dashboard Creation: Easily create beautiful and informative dashboards that can be used to quickly identify opportunities for optimization and growth of your ecommerce site
-
Conversion Tracking: With Supermetrics, businesses can track customer conversions and measure the effectiveness of their marketing campaigns
-
Multi-Channel Campaign Performance: Easily monitor the performance of multi-channel campaigns to identify the most effective channels
-
Automation: Automate data synchronization and reporting processes to save time and increase efficiency
Pricing
Supermetrics offers a 14-day risk free trial with all its plans, namely:
-
Single Connector: $39/month
-
Essential: $99/month
-
Core: $239/month
-
Super: $579/month
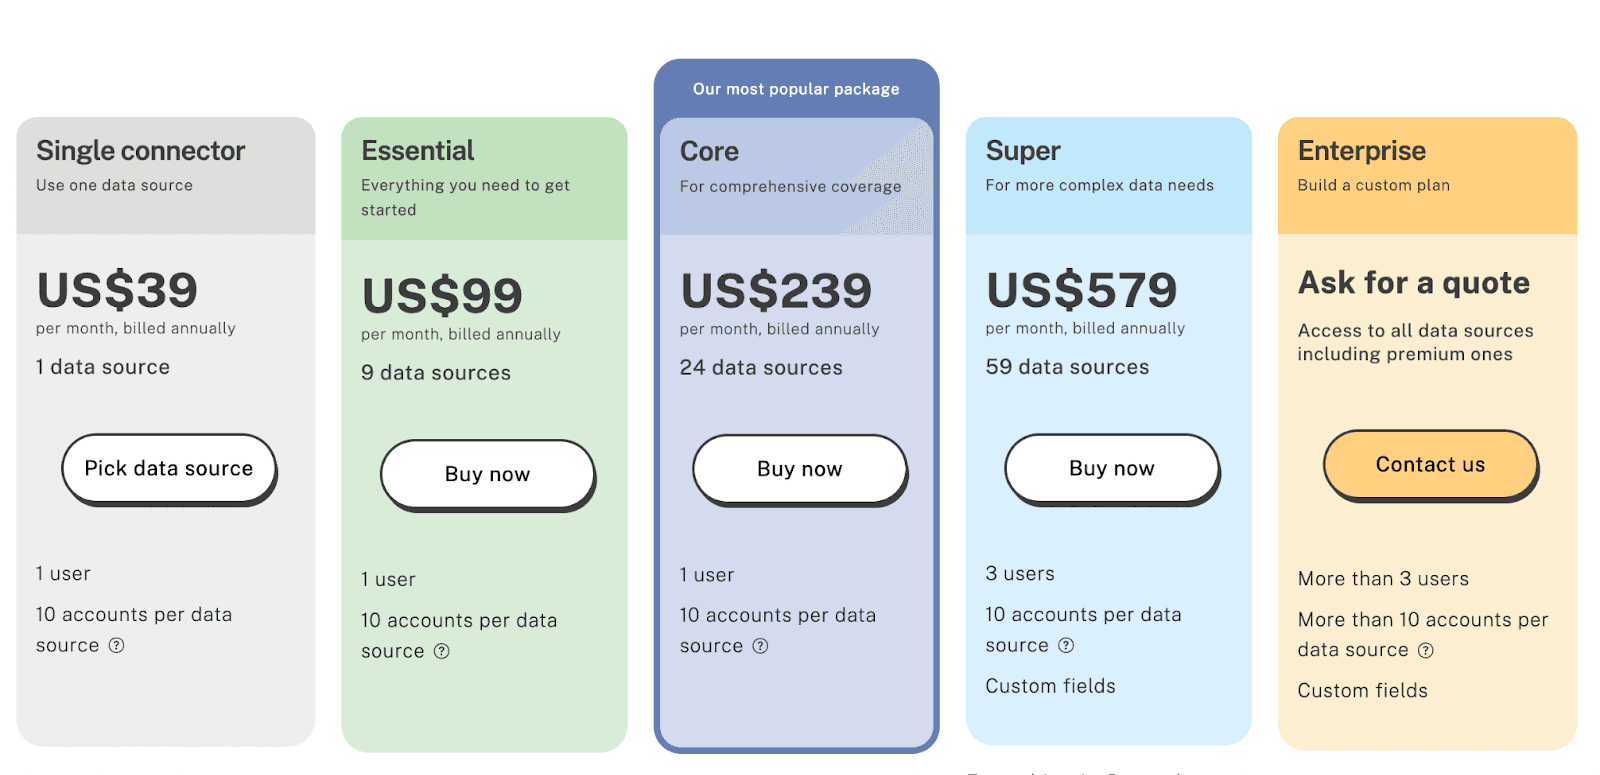
Note: All plans are billed annually.
Pros and Cons
✅ Easy to access data from various ecommerce platforms
✅ Accurate insights into customer purchase behavior and website performance
✅ Measure the effectiveness of marketing campaigns
❌ Supermetrics can be costly for some businesses
❌ Supermetrics may not offer the level of data analysis some businesses need
❌ Setup time and effort is high
#4. Glew
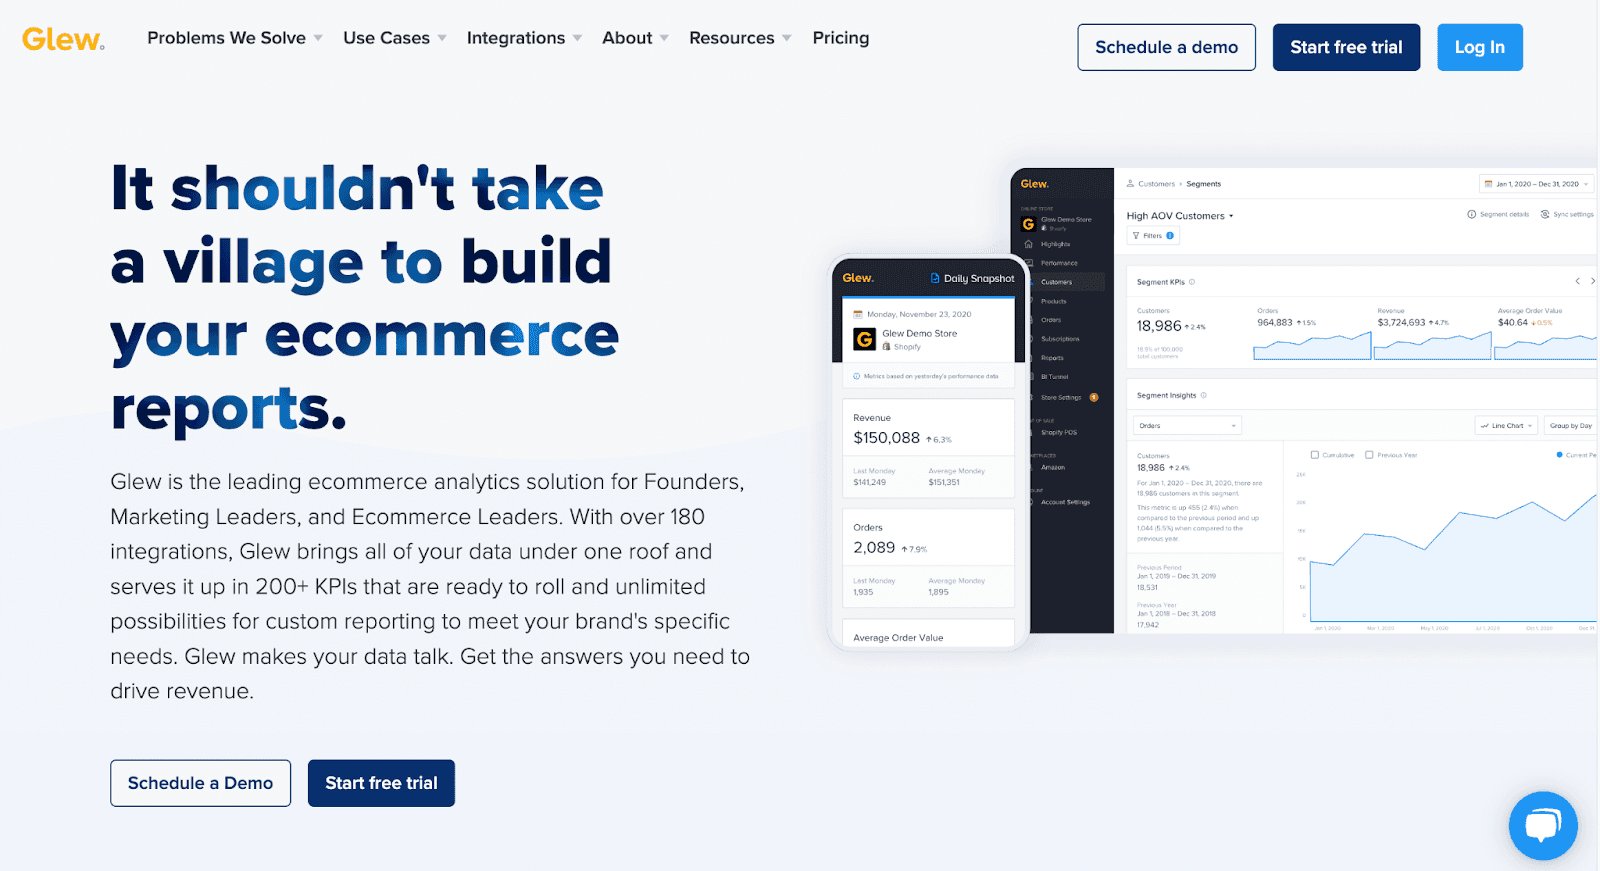
Glew is an innovative ecommerce reporting tool that provides powerful insights into your ecommerce business. It gives you the ability to track, analyze, and optimize your online store’s performance with its comprehensive suite of reports and dashboards.
With Glew, you can easily access key performance metrics such as revenue, customer count, and average order value to get a better understanding of your store’s performance.
You can also use the data to identify trends, identify areas for improvement, and make smarter decisions for your ecommerce business.
Features
-
Automatic Data Collection: Automatically collect and store data from multiple sources including Shopify, Magento, and Amazon
-
Cross-Platform Analytics: Track and analyze ecommerce data across multiple platforms in real-time
-
Custom Reports and Dashboards: Create custom reports and dashboards to visualize key performance metrics
-
Advanced Segmentation: Segment data to identify trends and opportunities within different customer segments
-
Customer Insights: Gain insights into customer behavior to marketing channel campaigns for ecommerce
-
Automated Alerts: Set up automated alerts to monitor performance and stay ahead of any potential issues
Pricing
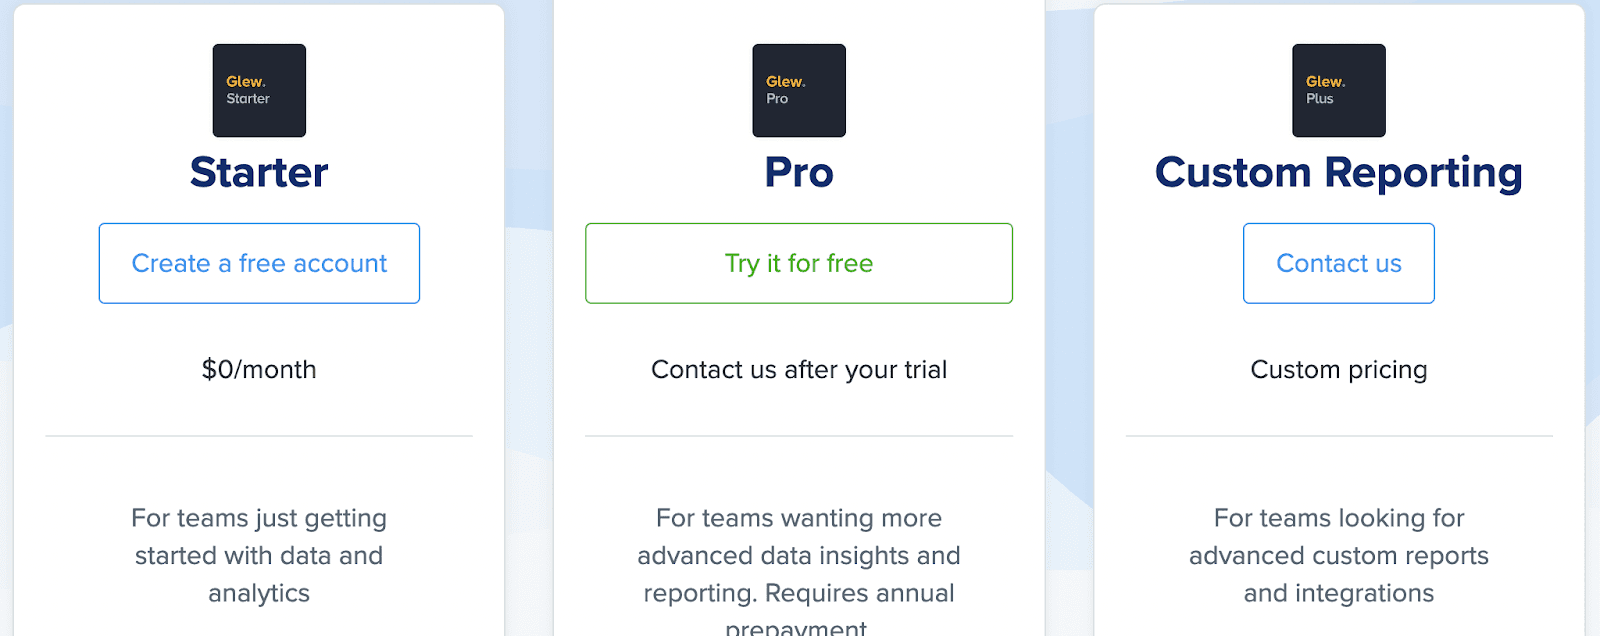
Glew offers a free-forever plan with unlimited users and stores. Beside, it also has a pro and custom reporting plans. The pricing, however, is not mentioned on the website and you need to contact their sales rep to get a quote.
Pros and Cons
✅ Glew provides an extensive range of reports and dashboards to help you get a better understanding of your ecommerce business
✅ The interface is easy to use, making it suitable for users of all levels of expertise
✅ Glew automatically collects and stores ecommerce data from multiple sources, saving you time and effort
❌ Glew currently only supports Shopify, Magento, and Amazon, so it is not suitable for stores using other ecommerce platforms
❌ The reports and dashboards provided by Glew are limited in terms of customization options
❌ Glew does not offer advanced features such as predictive analytics or AI-based insights
#5. Triple Whale
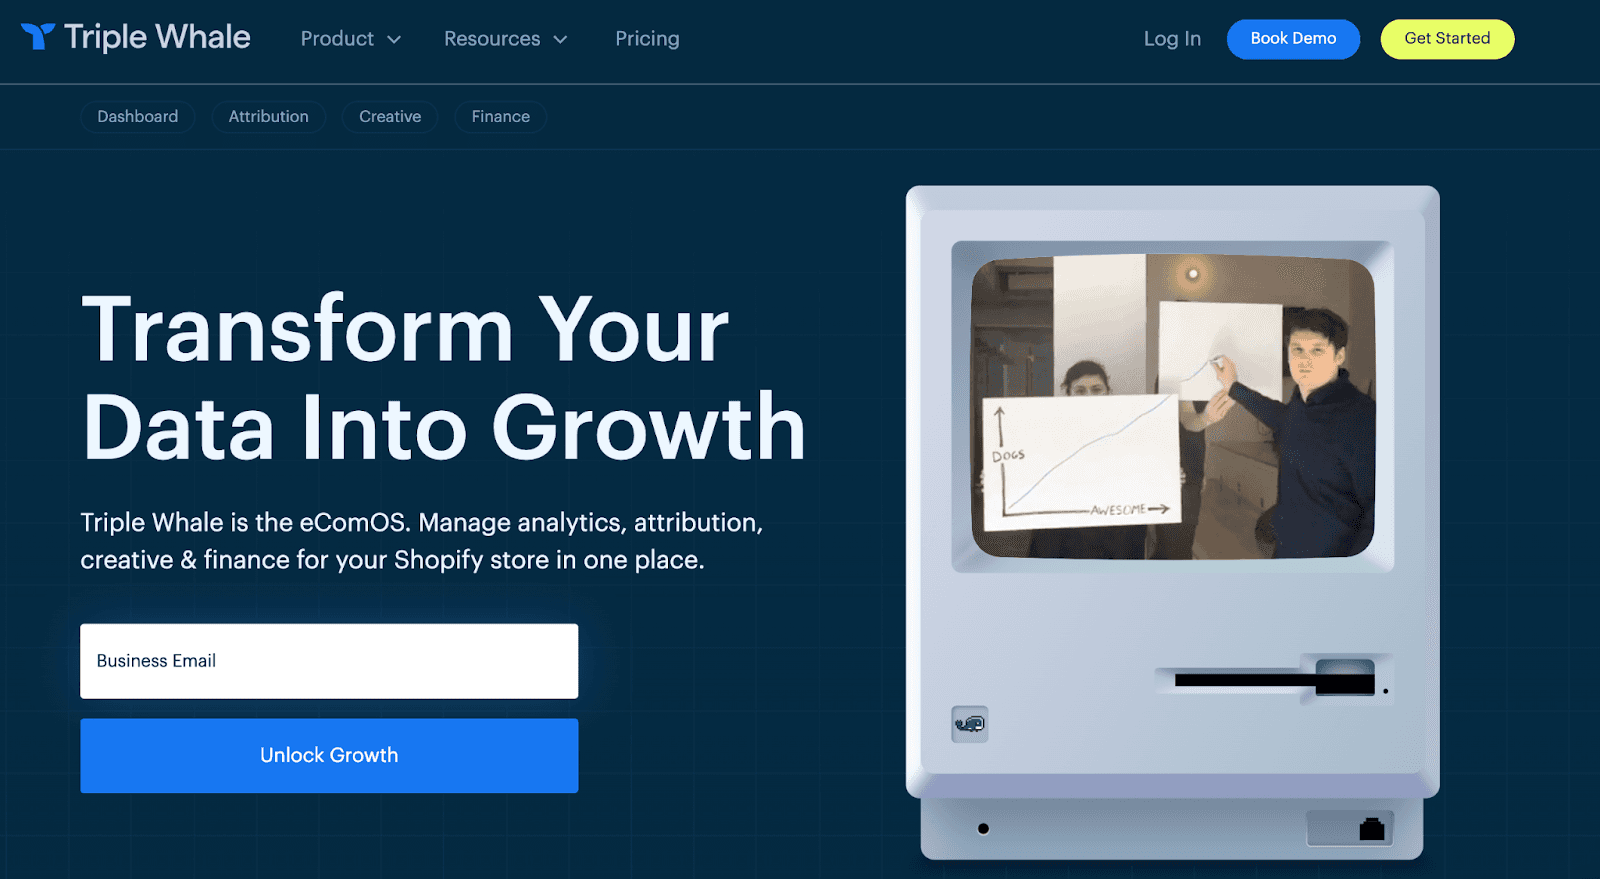
Triple Whale is an ecommerce operating system designed to help small and medium sized businesses optimize their operational efficiency.
It streamlines the entire ecommerce process, from order management to inventory management, allowing merchants to focus on their core business objectives.
With its intuitive user interface and powerful analytics, Triple Whale helps merchants gain insights into their online performance and make smarter decisions about their ecommerce operations.
It also provides tools to manage customer service, order fulfillment, and advanced analytics, giving merchants the tools they need to maximize their success in the digital age.
Features
-
Automated Workflows: Creative Cockpit provides automated workflows that enable users to quickly and easily create, manage, and optimize campaigns
-
Campaign Management: Creative Cockpit allows users to manage campaigns across multiple channels, including email, display, and social media
-
Audience Targeting: Creative Cockpit enables users to target specific audiences with tailored messages and content
-
Performance Tracking: Creative Cockpit provides detailed performance tracking and analytics to help users measure the success of their campaigns
-
Integration: Creative Cockpit integrates with a variety of third-party services, such as Google Analytics, to provide a comprehensive view of campaign performance
Pricing
Triple Whale offers three premium plans, namely:
-
TW Dashboard: $100/month
-
TW Attribution: $200/month
-
TW Full Whale: $300/month
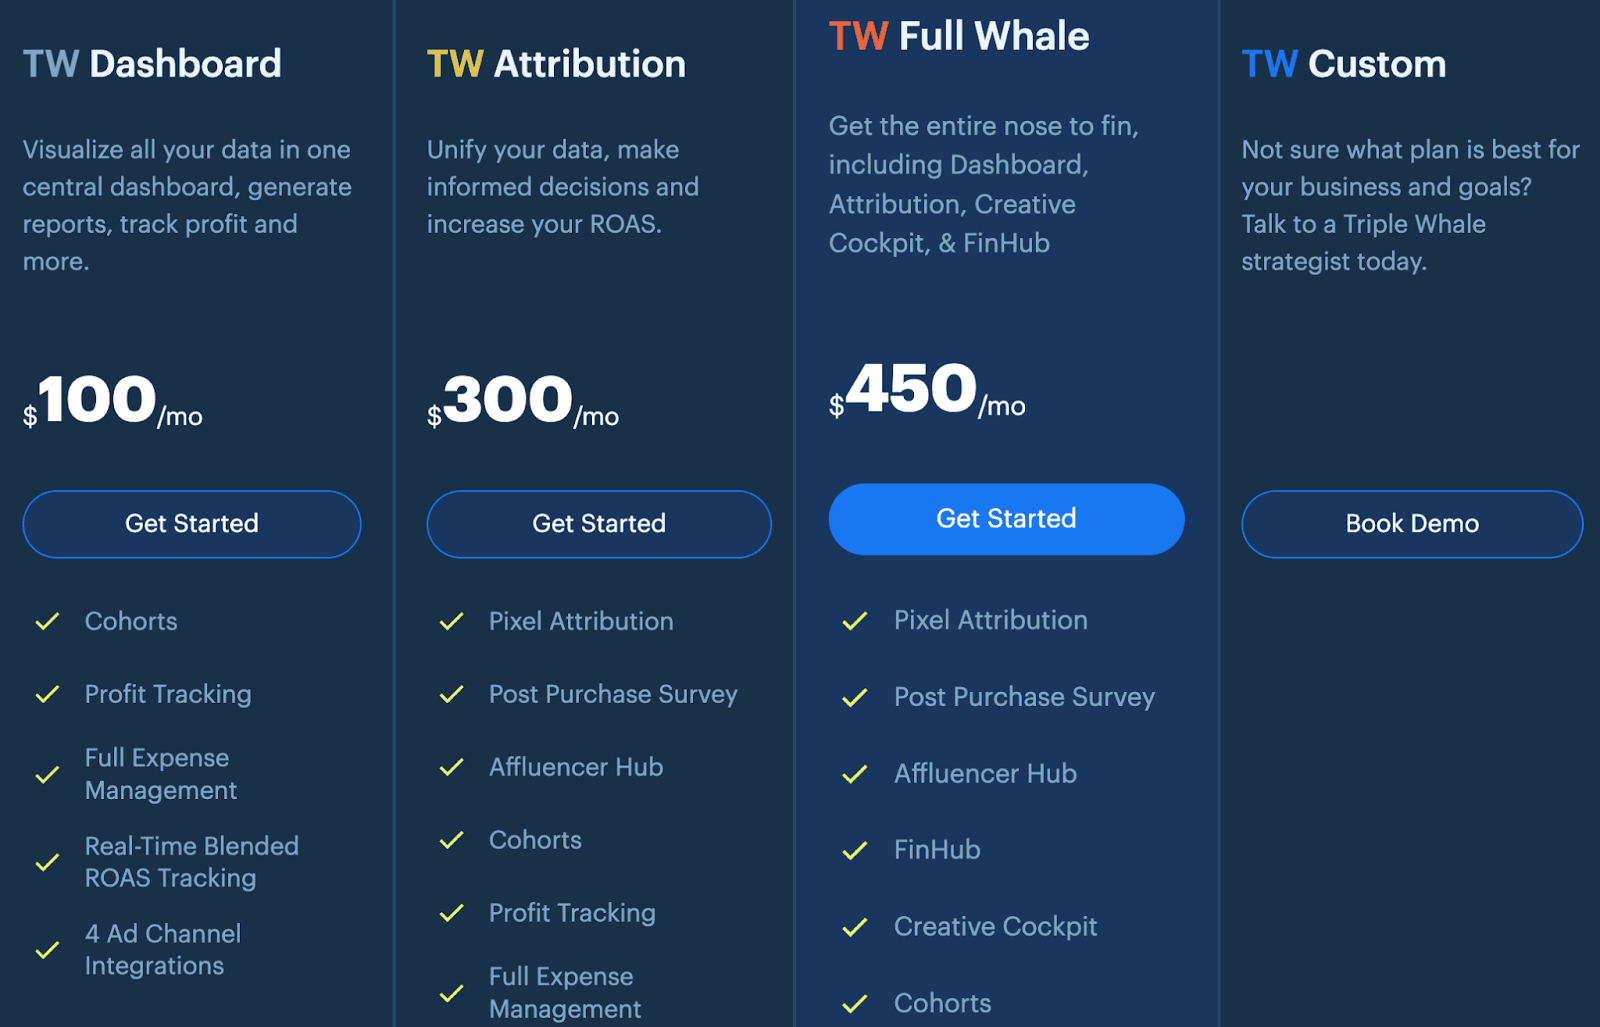
Triple Whale also offers a custom plan which allows you to talk to a TW strategist and create a custom plan suitable for your business.
Pros and Cons
✅ Automated workflows make it easy to create, manage, and optimize campaigns
✅ Offers campaign management across multiple channels
✅ Real-time collaboration with team members and clients
❌ Costly for small businesses
❌ Limited customization options
❌ Limited support for certain platforms
#6. Metrics Watch
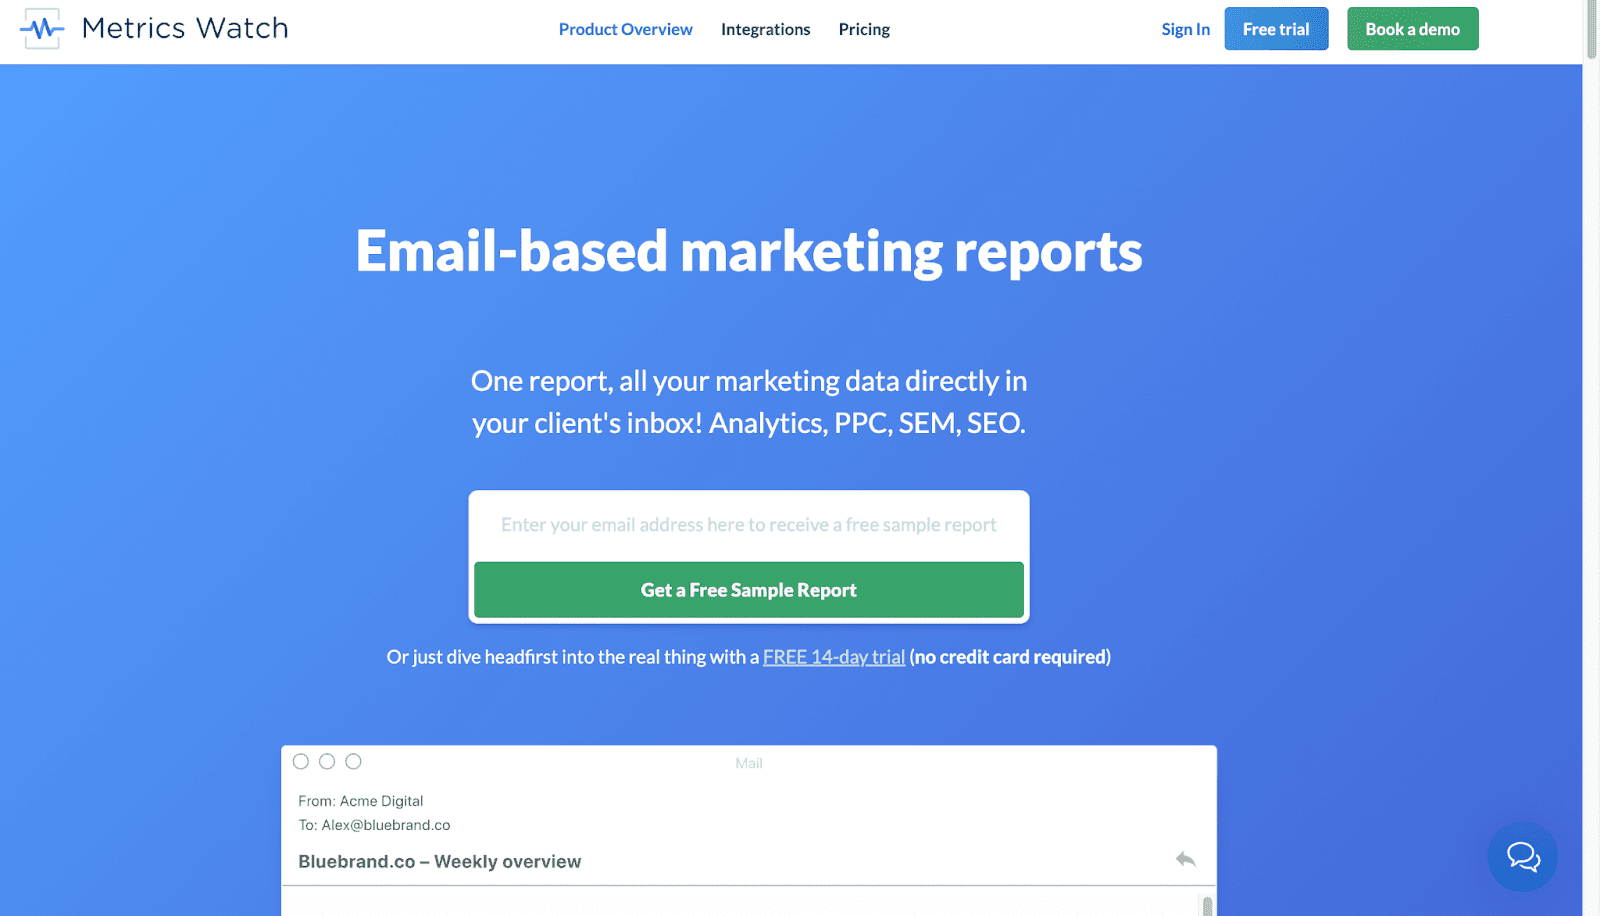
Metrics Watch is an ecommerce reporting tool that provides businesses with real-time insights into their online performance.
It offers a comprehensive suite of features that enable businesses to track, analyze, and optimize their ecommerce activities. With Metrics Watch, businesses can quickly identify trends, measure customer engagement, and gain insights into their customer base.
It also provides detailed reports on website performance, product sales, and customer behavior.
Features
-
Real-Time Insights: Provides businesses with real-time insights into their online performance, enabling them to quickly identify trends and measure customer engagement
-
Comprehensive Reporting: Gives you detailed reports on website performance, product sales, and customer behavior
-
Automated Alerts: Can be set up to send automated alerts when certain metrics reach a certain threshold
-
Customizable Dashboards: Allows businesses to customize their dashboards to display the data that is most relevant to them
-
Data Visualization: Provides businesses with powerful data visualization tools to help them better understand their data
-
Multi-Platform Support: Supports multiple platforms, including web, mobile, and desktop
Pricing
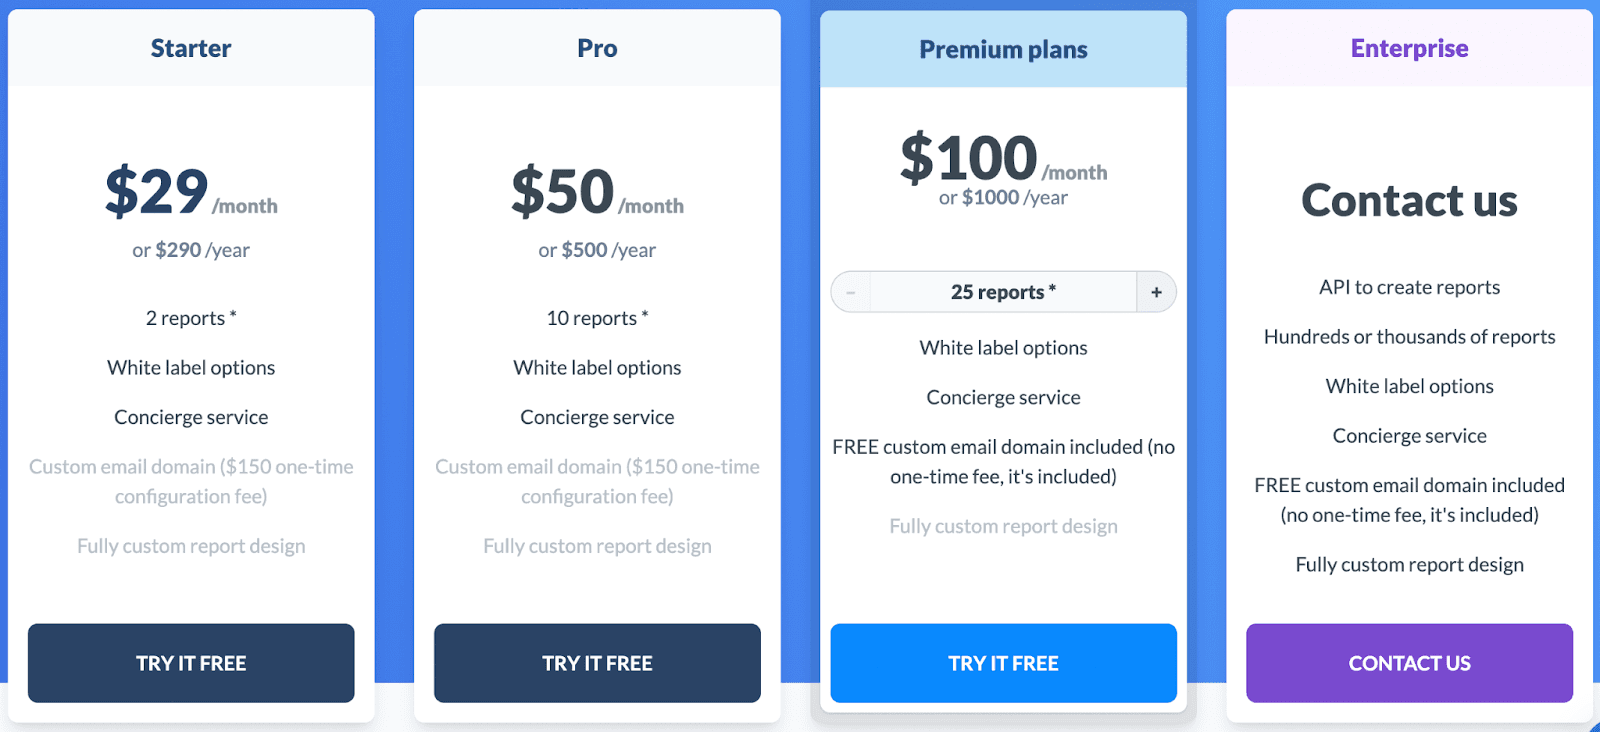
Metric Watch provides a 14-day free trial period with all its plans. It offer a variety of plans, all of them with white label options, namely:
-
Starter: $29/month
-
Pro: $50/month
-
Premium: $100/month
-
Enterprise: Contact sales
Pros and Cons
✅ Provides an easy-to-use, comprehensive reporting system for businesses to track their ecommerce performance
✅ Provides detailed metrics, such as the number of orders placed, the average order value, and the average time to order completion
✅ Offers insights into customer behavior and product performance
❌ Does not provide a single view of all ecommerce data, which can make it difficult to identify trends and patterns
❌ Requires users to have a high level of technical understanding in order to make the most of the data
#7. DashThis

DashThis is an ecommerce reporting tool that helps businesses to track and analyze their online performance. It provides comprehensive insights into key performance indicators, such as website traffic, sales, and customer engagement.
The software also offers automated reporting, allowing users to quickly generate reports and share them with stakeholders.
With its intuitive dashboard, users can easily visualize their data and gain valuable insights into their ecommerce performance. DashThis is an invaluable tool for businesses looking to optimize their online presence and maximize their profits.
Features
-
Automated Reporting: DashThis allows users to generate automated reports and share them with stakeholders
-
Dashboards: The intuitive dashboard allows users to visualize their data and gain insights into their ecommerce performance
-
Key Performance Indicators (KPIs): DashThis provides comprehensive insights into key performance indicators, such as website traffic, sales, and customer engagement
-
Filtering & Sorting: Users can filter and sort their data to gain more in-depth insights into their ecommerce performance.
-
Alerts & Notifications: DashThis sends alerts and notifications to users when key performance indicators exceed or fall below certain thresholds
-
Data Visualization: DashThis offers a range of data visualization tools, such as graphs, charts, and maps, to help users better understand their data
Pricing
DashThis offers a 15-days free trial plan. After which, it has four premium plans for you to choose from:
-
Individual: $39/month
-
Professional: $129/month
-
Business: $249/month
-
Standard: $399/month

Pros and Cons
✅ Offers an easy-to-use drag-and-drop interface that makes it simple to create custom dashboards with little to no technical knowledge
✅ Offers a number of useful features such as automated data refresh, custom alerts, and detailed analysis
✅ Has a free trial for users to try out the service before committing to a paid subscription
❌ The drag-and-drop interface may be too simple for some users who are looking for a more detailed dashboard experience
❌ The dashboard design options may be limited for more advanced users
#8. Heap
Heap is an ecommerce reporting software that offers advanced analytics and insights into customer behavior. It enables businesses to get a comprehensive view of how customers are engaging with their products and services.
With Heap, businesses can monitor customer engagement in real-time, track customer journeys, and gain insights into customer behavior. The tool also provides powerful data visualization tools to help businesses make informed decisions about their marketing and product strategies.
With Heap, businesses can easily identify trends and opportunities for improvement, making it an invaluable tool for any ecommerce business.
Features
-
Real-time Tracking: Heap allows businesses to track customer behavior in real-time, giving them an up-to-date view of how customers are engaging with their products and services
-
Funnel Analysis: Heap provides powerful funnel analysis tools to help businesses understand how customers are progressing through the customer journey.
-
Cohort Analysis: Heap allows businesses to segment customers into cohorts and track their behavior over time; this helps businesses identify trends and opportunities for improvement
-
Data Visualization: Heap provides powerful data visualization tools to help businesses quickly identify trends and insights
-
Automated Insights: Heap automatically generates insights and recommendations based on customer behavior
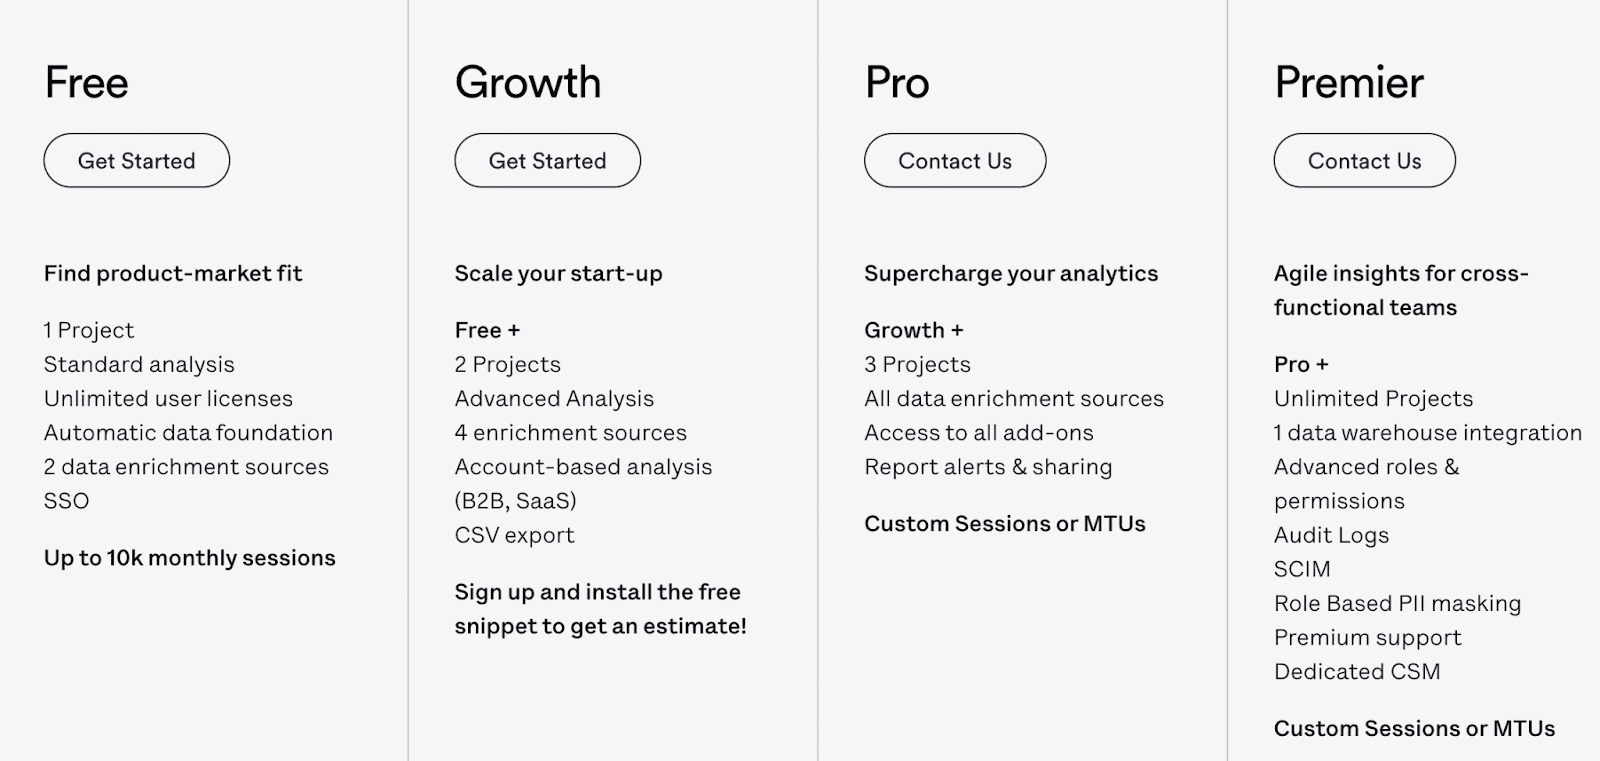
Pricing
Heap has a free plan which you can get started with quickly. But if you want to unleash its full power, you can choose from Growth, Pro, or Premier plans.
Pros and Cons
✅ Heap is designed to be easy to use, with a simple drag-and-drop interface that makes it easy to create and manage projects
✅ Offers automated processes that make it easier to manage projects, such as automated notifications and task reminders
✅ Makes it easy to collaborate with team members, allowing users to assign tasks, comment on projects, and share files
❌ Does not offer as many features as some of its competitors, such as project management tools and advanced analytics
❌ Does not offer as many integrations as some of its competitors, which may limit its usefulness for some users
Keep All Your KPIs in Your Pocket?
Trying all of these tools to find the best one for your business can be overwhelming.
So here's a proven shortcut 👇🏻
If you're a hustling entrepreneur who wants to track your store's performance while being anywhere around the world – Datapad is your go-to tool!
Datapad lets you track all your eCommerce KPIs from your mobile phone.
Yes, you read it right! 😲
❌ No need to sit in your office
❌ No need for a desktop set-up
❌ No need to do multiple logins
❌ No need to open 10+ tabs
All you need to do is, click on the Datapad app, and you'll have a fully-fledged ecommerce report to know about how your digital marketing campaigns are performing, the conversion rate you’re getting, and much more.
Just scan the QR code below and get started.