
With thousands of KPI tracking and data visualization tools in the market, it's tough to outgrow every competitor.
At Datapad, we're a team of people trying to make data available for everyone and trying to help your business grow with the help of a platform that lets you track KPIs from your mobile phone.
And the foremost rule we have is: Never lie to your customers! ��
Though we would like to serve every industry and organization, our KPI tracking tool isn't perfect for everyone.
That made us compare our tool with other tools (Databox and Klipfolio) to determine the best one for you.
Here's the bottom line in our view,
-
Datapad is for you if you want to track your KPIs in the simplest way possible from anywhere and anytime
-
Databox is great for advanced marketers and creating sophisticated dashboards
-
Klipfolio aligns with your business needs and provides a good sense of product direction (with a steep learning curve)
Later down the line, we decode the features, integration, pricing, and more that lead us to the above conclusions.
Too lazy to read a 10 mins comparison? 😴
Note: Try our Datapad for free from here - no credit card required
Datapad vs. Databox vs. Klipfolio Features Datapad vs. Databox vs. Klipfolio Supported Integrations Databox vs. Klipfolio vs. Datapad Pricing What Are Customers Saying? Wrapping Up

Datapad vs. Databox vs. Klipfolio Features
Although all three tools are known for dashboard building, Datapad is different from the other tools because of its focus on mobile first experience and also focusing on “team collaborations & communication” features to help your team communicate around KPIs.
Datapad Features
#1. Easy Dashboard Creation
With Datapad, custom dashboard creation is no big deal. You just need to choose a title, add a description, select an emoji (if you want) 😊 and create a dashboard.
Type in the KPIs you want to track, put a number (set your goal), define a time interval, and you are good to go.
Moreover, you can customize your KPI cards via pre-built graphs and pivot tables; change the metric colors to make them soothing to the eyes and in contrast to one another. Like the one below:
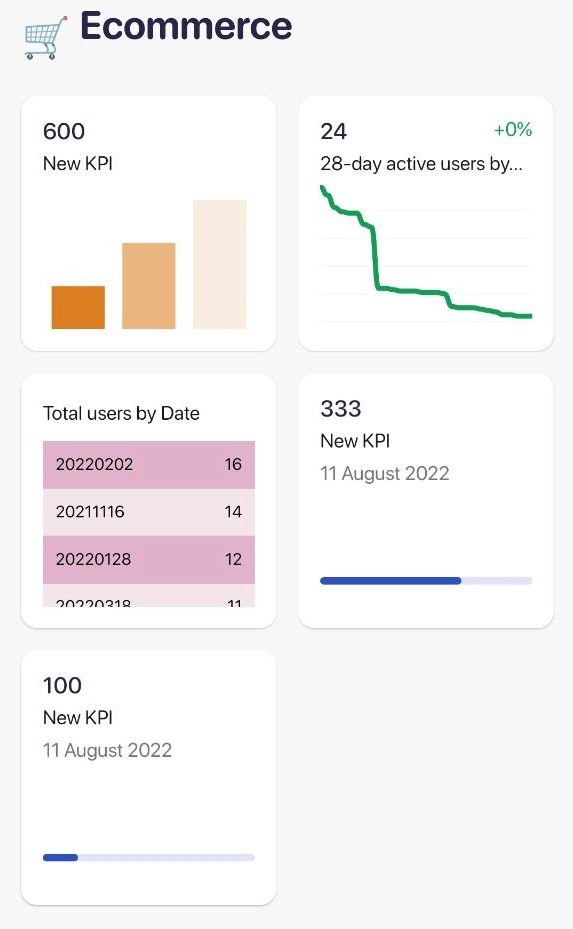
Our app also allows you to take a bird-eye-view of all the metrics at once place.
You can also compare your past and present performances without additional effort. Besides, you get everything already curated for you on your dashboard.
Metrics you can track are not limited to marketing, you can track your whole business from Datapad to have a holistic view on what's going on.
#2. Team Collaboration
Team collaboration is a vital feature for any KPI tracking and dashboarding software out there. It can especially help SaaS companies who have a lot of data to track.
As Helen Keller said:
"Alone, we can do so little; together, we can do so much."
Our team at Datapad loved the quote; hence, our tool is flawlessly optimized for you and your team to collaborate anytime and anywhere - all with a tap.
Datapad is trying to be like “Canva for metrics” because Canva made seign for everyone and we want to make “Data easy for everyone”
With a single tap, you can easily:
-
On-board your entire team
-
Assign individual tasks to team members and goals to every KPI
-
Enable discussions around metrics
-
Get real-time notifications and alerts
We also ace at real-time collaboration like no other tool.
For example, suppose a specific metric is underperforming or needs attention. In that case, you can simply comment under the metric, tag the designated person, and have the metric looked over in real-time.
Likewise, your team can communicate under the KPIs to quickly broadcast messages.

Although Databox and Klipfolio have team collaboration features, none of them allows you to comment below metrics for instant communication like Datapad.
#3. Mobile-Friendly Dashboards
Now, all three tools have dedicated mobile apps. However, our tool is specially designed for mobile-friendly KPI tracking and dashboard creation. You may ask how.
Our mobile app is perfectly optimized for blazing fast performance. 📱
Thereby avoiding any lags, glitches, or delays in tracking your business performance.
Some of you could be using sheets or mobile apps of BI tools, but we know that these tools are not optimized for mobile experience, Datapad solves that problem for you.
There is no more excuse to not knowing what's happening in your business, whether you are in a beach in Thailand or in toilet you have full access to your metrics

It's compatible with all known mobile devices and small screen sizes, allowing you to view your complete dashboard no matter what the screen size.
In short, Datapad's mobile-friendly app allows you to:
-
Get instant access to important KPIs
-
Build mobile optimized dashboards (no double work for desktop)
-
Lightning-fast loading time and navigation across pages
-
Powerful visualization tools with stunning graphics
#4. Automatic and Manual Data Entry
Another sought-after feature of our tool is its automatic and manual data entry capabilities.
Datapad's one-click integrations allow you to transfer data from multiple sources into one unified dashboard within seconds.

Or, if you are unsure of tracking every data, you can manually input the data you want to monitor.

Databox Features
Even though all three tools share some common features, Databox is a better business analytics tool than the other two if we talk about the number of features. Although the quality of these features remains more or less the same.
#1. Highly Customizable Dashboards
Comparatively, Databox offers more customization options than the other two tools. Its no-code dashboard easily allows you to pull in all your important metrics, visualize KPIs, and fully customize the look and feel of your dashboard within minutes.
Plus, its 200+ pre-built dashboard templates make it much easier for novice users to get started.
To add more, you can use its intuitive drag-and-drop feature to move, edit, or rearrange your dashboard without a single line of code.
You can even create custom metrics or calculate metrics, conversion rates, and ROI from multiple sources without coding or spreadsheets.
#2. Team Collaboration
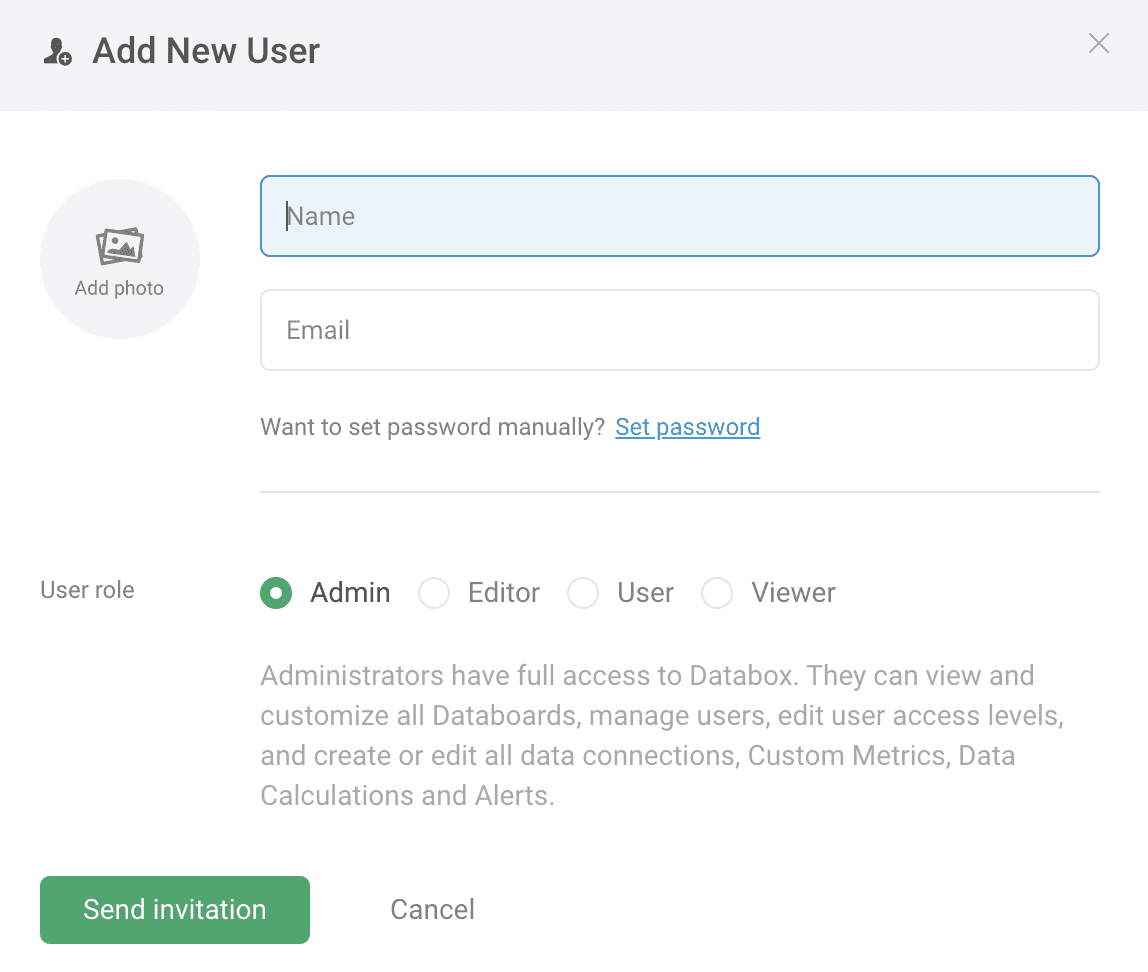
Although Databox is a popular tool that offers a collaborative environment for teams and organizations, it doesn't effectively help your team to collaborate in real-time.
In this aspect, we find Datapad more convincing.
As with Datapad, you can easily comment under KPIs to follow up with your team members quickly.
On the other hand, Databox's team collaboration feature allows you to:
-
Share daily, weekly, or monthly reports via Email, Slack, or as CSV
-
Get alerted when important KPIs trend up or down
-
Schedule automated alerts for teams or specific departments
Instant collaboration, however, cannot be something you can expect from Databox or Klipfolio.
Anyways, there's one feature that makes Databox stand out. It allows you to share performance and goals on TV.
This helps you to have your team focused on needle-moving activities and monitor performance while working on other tasks.
#3. Mobile-Friendly Dashboards
When it comes to being mobile-friendly, Datapad owns the category. However, Databox is not far behind the chase.
As per Databox, its mobile app is the foremost layer of the Databox platform and the most user-oriented tool in the suite. It provides instant business insights through an intuitive experience tailored for smartphones, tablets, and wearables.
Apart from the common features, Databox mobile app offers:
-
Mobile business intelligence dashboards that are as sophisticated as desktops
-
Quick preview while creating dashboards on desktop
But the major reason that Datapad has the upper hand in tracking KPIs via mobile apps is that you can't create a dashboard from your mobile on either Databox or Klipfolio app. You can just view KPIs, and that’s about it.
#4. White-Labeling
White-labeling allows you to personalize your reports and dashboards with your company branding - logos, color palette, etc. The features could come in handy for digital marketing agencies that send across KPI tracking reports to their clients.
This is one of the features that Datapad and Klipfolio don't offer.
With Databox's white-labeling feature, you can:
-
Personalize your dashboards and reports
-
Choose a custom domain to share reports
-
Brand mobile app with your logo
-
Share reports via company emails
Klipfolio Features
Klipfolio is a dashboard analytics platform that helps you track KPI with advanced features.
Let's compare Klipfolio's features with that of Datapad and Databox.
#1. Dashboard Creation
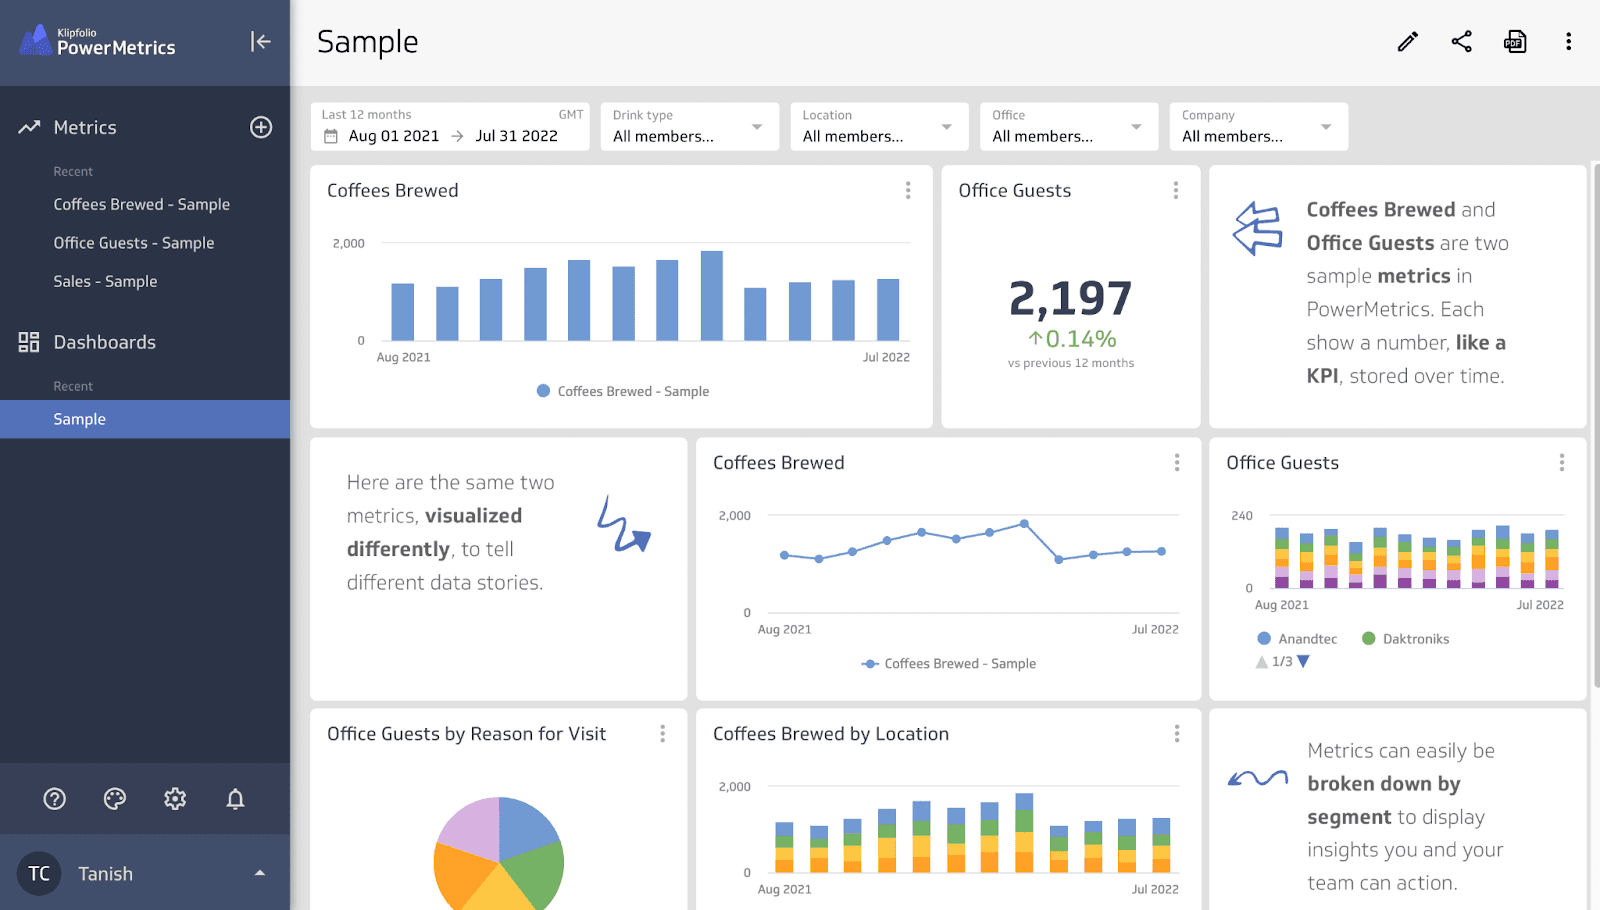
Comparatively, Klipfolio has much more advanced options than the other two tools. It uses powerful formulas, functions, and data modeling to create highly customizable and pixel-perfect dashboards and reports.
It has 100+ pre-built Klip templates and 10+ dashboard templates that do half the job for you and your team. All you need to do is plug and play.
Unlike Datapad and Databox, Klipfolio offers advanced filtering features to its dashboard. Thereby allowing you to drill down your data effortlessly and visualize hidden metrics with ease.
Plus, it allows you to customize your dashboard's theme using CSS, which Datapad and Databox don't offer.
#2. Mobile Optimization
As we mentioned, all three tools have dedicated apps for their platform. But all three differ in some aspects.
Although we still feel that Datapad has an insanely driven app that counters all your business needs. Here's something to know:
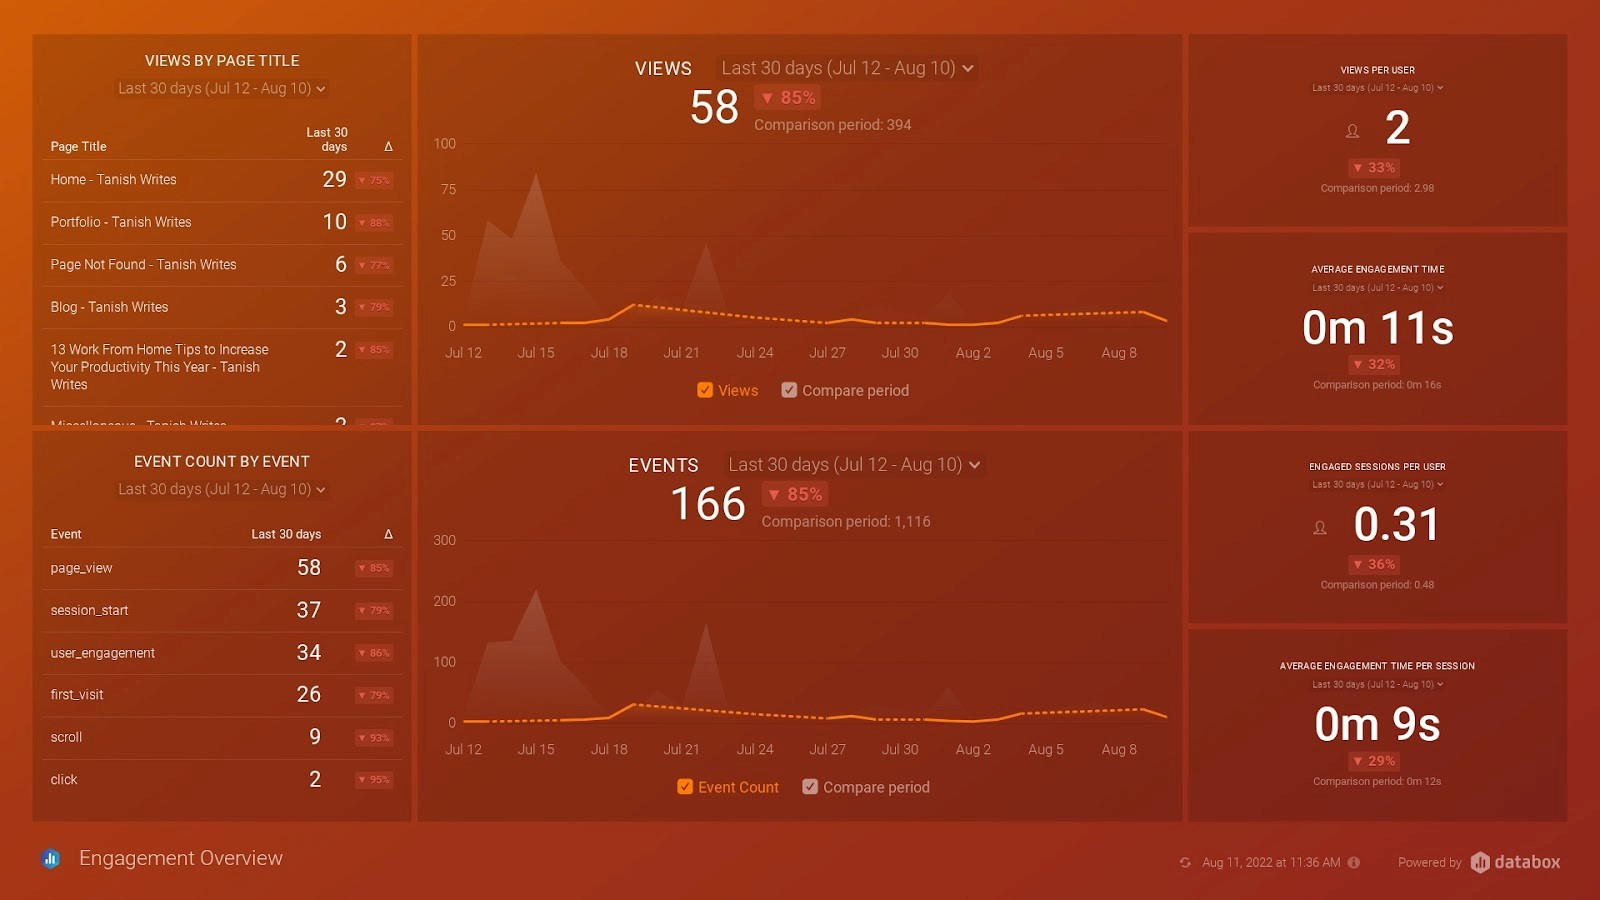
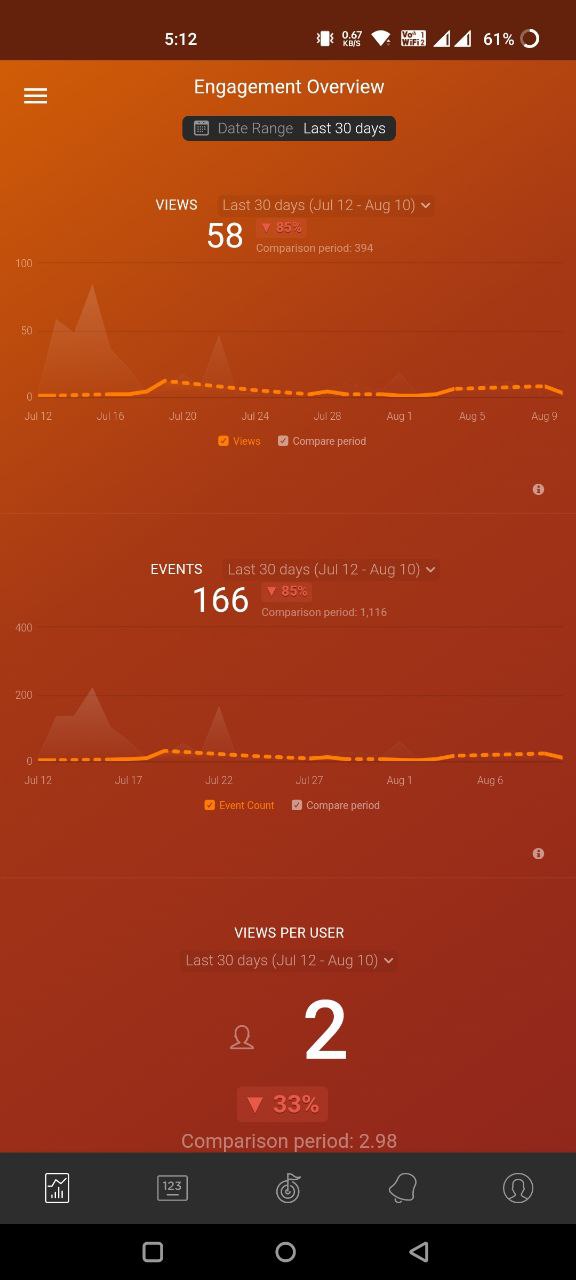
Compared to Datapad, Klipfolio's mobile app UI/UX is not something to brag about. Below we have attached the screenshots to both Klipfolio and Datapad mobile applications so that you can judge it all by yourself.
Datapad:
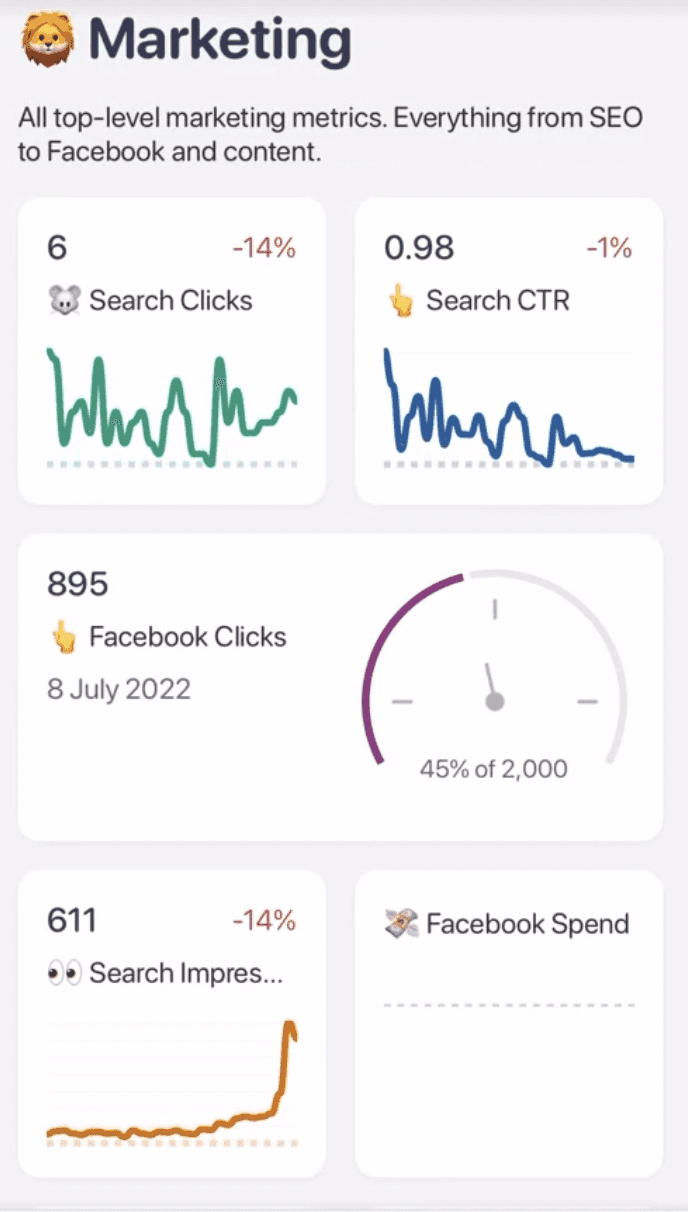
Klipfolio:
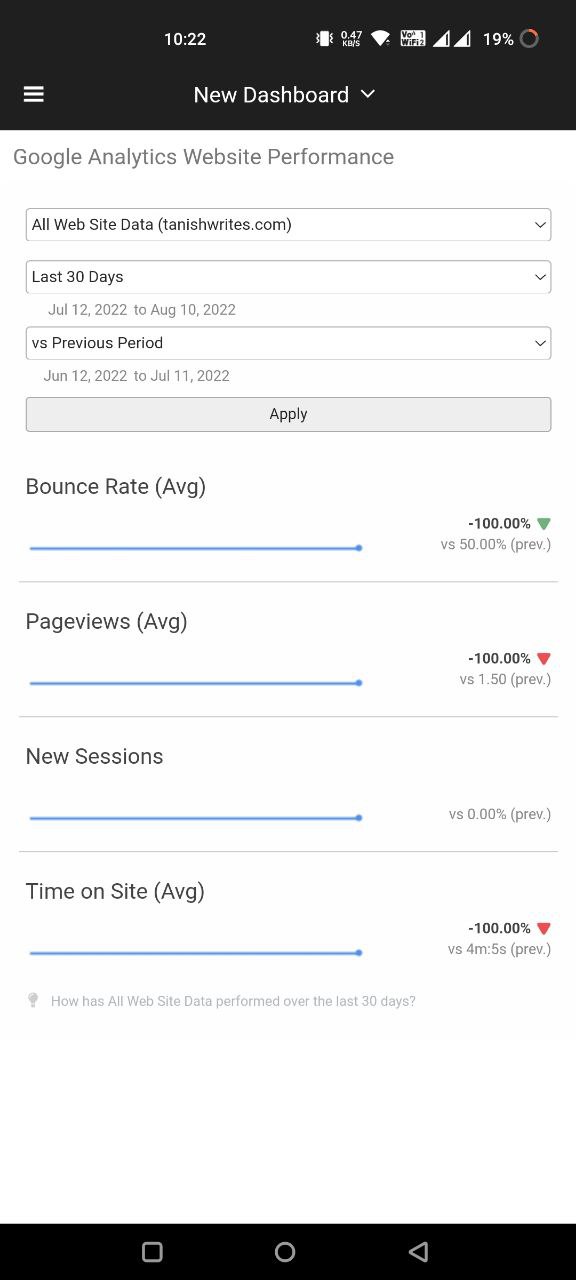
It's pretty evident that Datapad has a more user-friendly mobile app. It's simple, smooth, and attractive, with a lower-learning curve attached to it.
#3. Automatic Data Input
Klipfolio allows you to Upload an Excel file, import data via SQL connector, use pre-built REST/URL connectors, or update via email for automatic data input.
Comparatively, Datapad offers both automatic and manual data import. The feature not only eases your data import process but also lets control of data entirely into your hands.
On the other hand, with Databox, you can import data automatically via multiple data sources (but not manually).
Integrations, however, may play a significant role in the data importing capabilities of all three tools. So, below we have compared the integration supported by Datapad vs. Databox vs. Klipfolio.
Datapad vs. Databox vs. Klipfolio Supported Integrations
Datapad
Managing a successful business requires a dedicated team and tons of data. And hence, with Datapad, you get one-click integrations to multiple data sources and platforms. You can pull in all your data with ease from popular platforms, including:
-
Google Analytics
-
Google Analytics
-
Facebook Ads
-
Google Sheets
-
SQL Server
-
MySQL
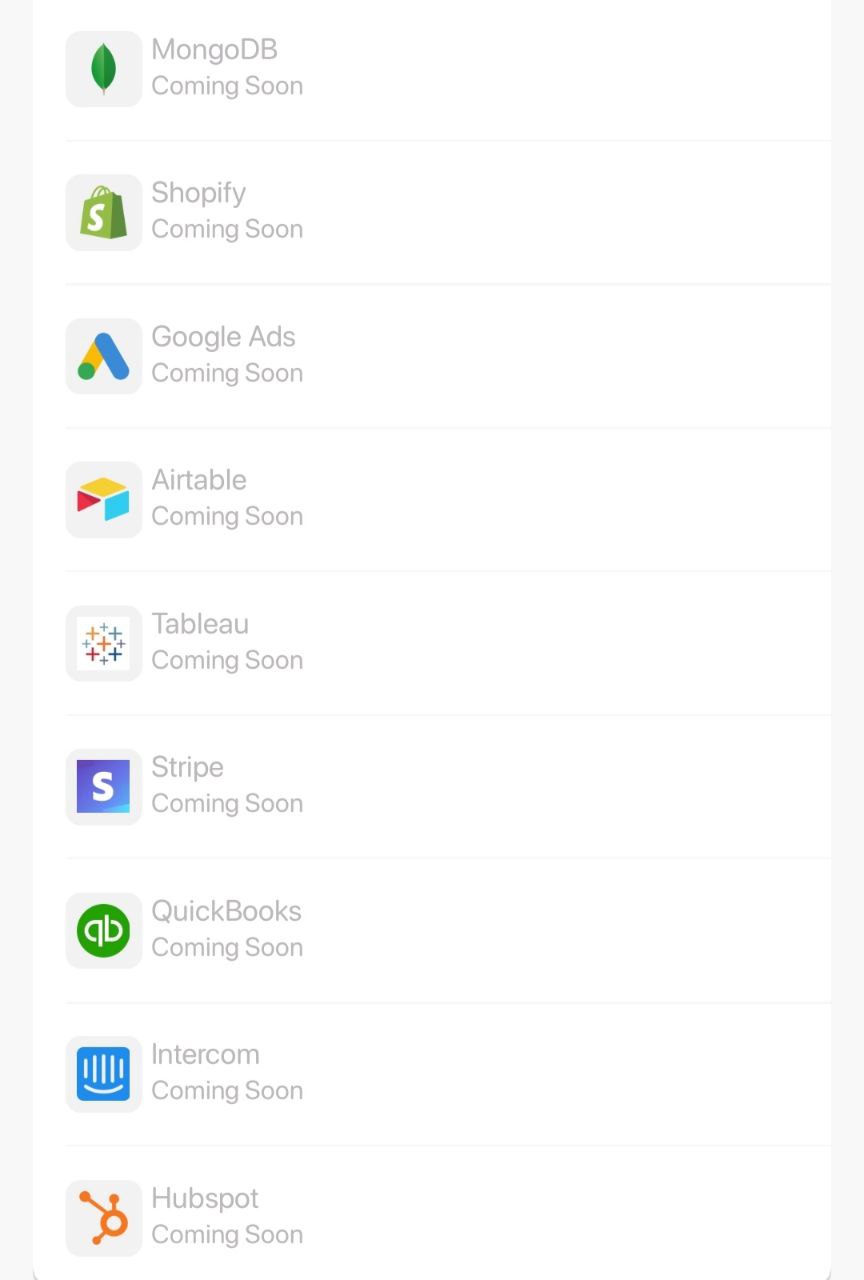
We will soon launch other once-click integrations with top platforms like Shopify, Tableau, HubSpot, and more.
For the most part, our tool also allows you to input data manually. Although it's a tiring process, it's your data, so your choice.
Databox

Databox, on the other hand, has 70+ one-click integrations (also has API). These integrations come with thousands of metrics, pre-configured Data Blocks, and over 200 pre-built reports.
Some of its key integrations include:
-
Google Analytics
-
HubSpot CRM
-
Facebook Ads
-
Shopify and 70+ platforms
Moreover, you can pull in data from any other sources by connecting to a SQL database or Google Sheets.
Klipfolio
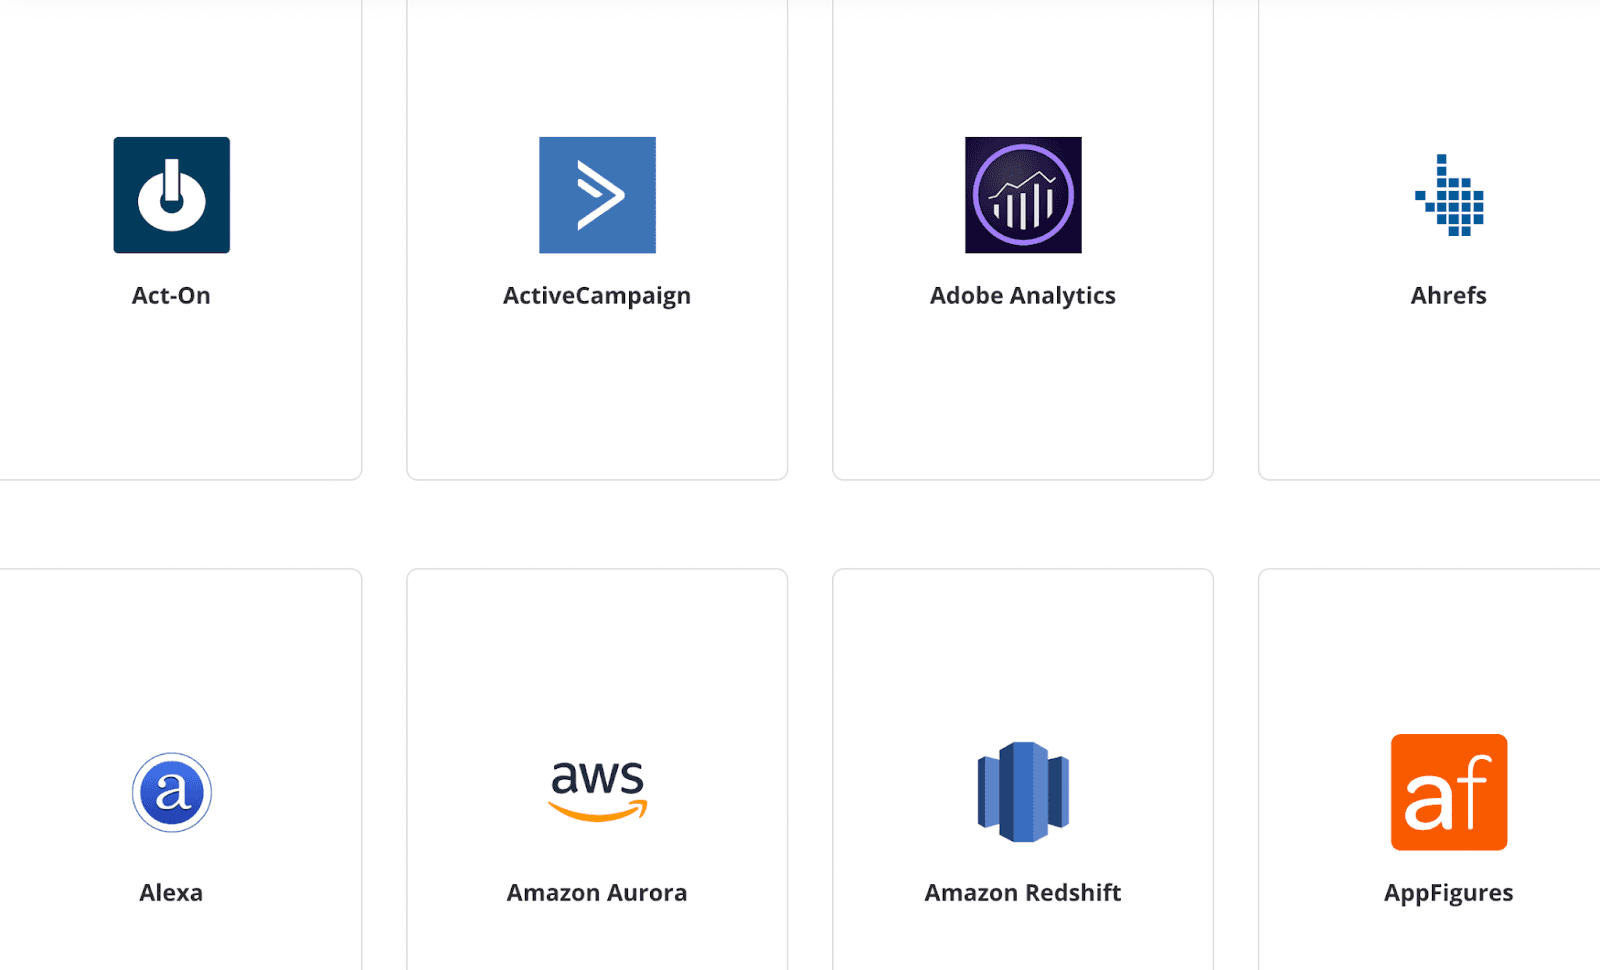
Lastly, Klipfolio has some great data connectors you can integrate and create dashboards. It allows you to import data via Excel file, pre-built REST/URLs, SQL connectors, or update data via automatic data input functionality.
Here're a few of its integrations:
-
Salesforce
-
Microsoft Excel
-
Instagram
-
Facebook
-
Google Analytics
Wrapping Up Integrations
Unbiased opinion, Databox has its superiority reflected when it comes to integrations. However, at Datapad, we are constantly adding new integrations. You might as well request us for specific integrations via email that you need.
Databox vs. Klipfolio vs. Datapad Pricing
Now the most awaited question: How much do these tools cost? 💵
Well! A quick and soothing answer would be that Datapad is free from pricing boundaries. So the comparison remains between Databox and Klipfolio.
Databox
Databox has the most complex pricing model. Though, we tried to bring it all into a small summary.
The platform has a free-forever plan with three data sources and databoards each. Apart from this, Databox offers three plans, namely:
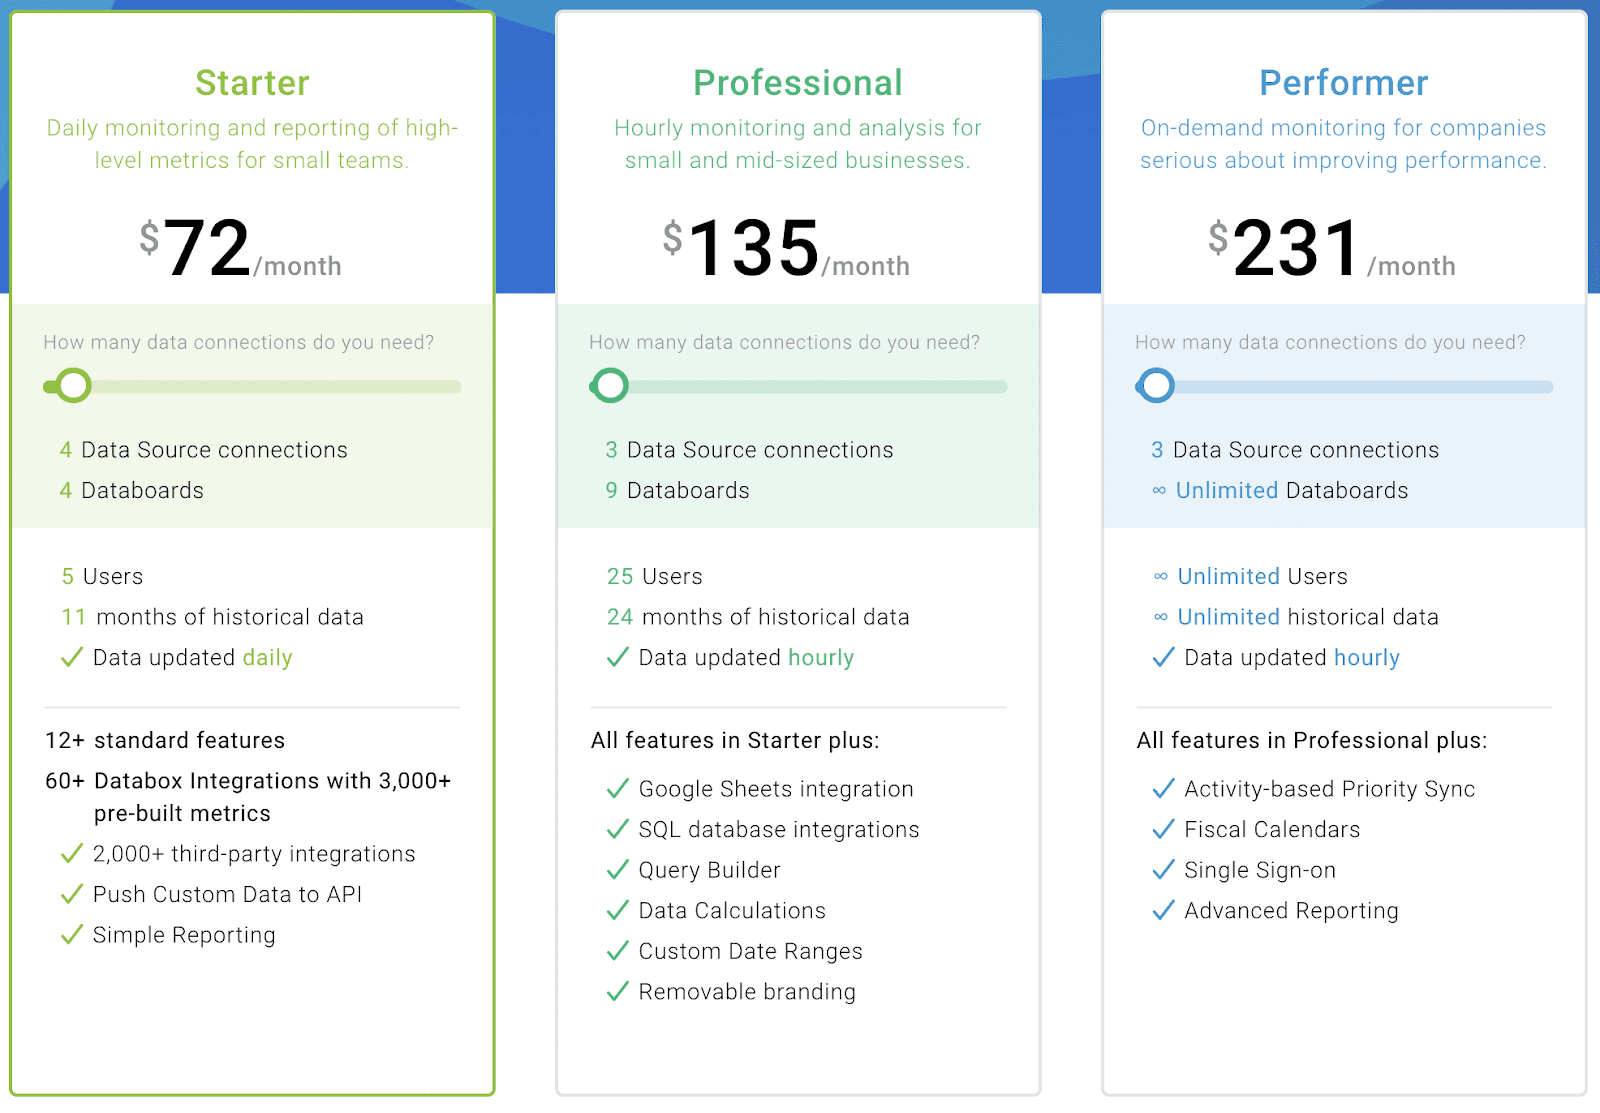
Note: The pricing below is based on the default number of connectors mentioned on Databox's website. In case you increase the number of connectors, the pricing changes accordingly.
-
Starter Pack: Daily monitoring and reporting of data (5 users; starting at $72/month)
-
Professional Pack: Hourly monitoring and analysis of data (25 users; starting at $135/month)
-
Performer Pack: On-demand monitoring (Unlimited users; starting at $231/month)
Klipfolio
Klipfolio, on the other hand, has the simplest yet incomparable pricing data.
Unlike Databox, its plans are priced based on features and not the number of connectors.
However, here's how it is. Klipfolio offers its pricing models at two levels: Business and Enterprise.
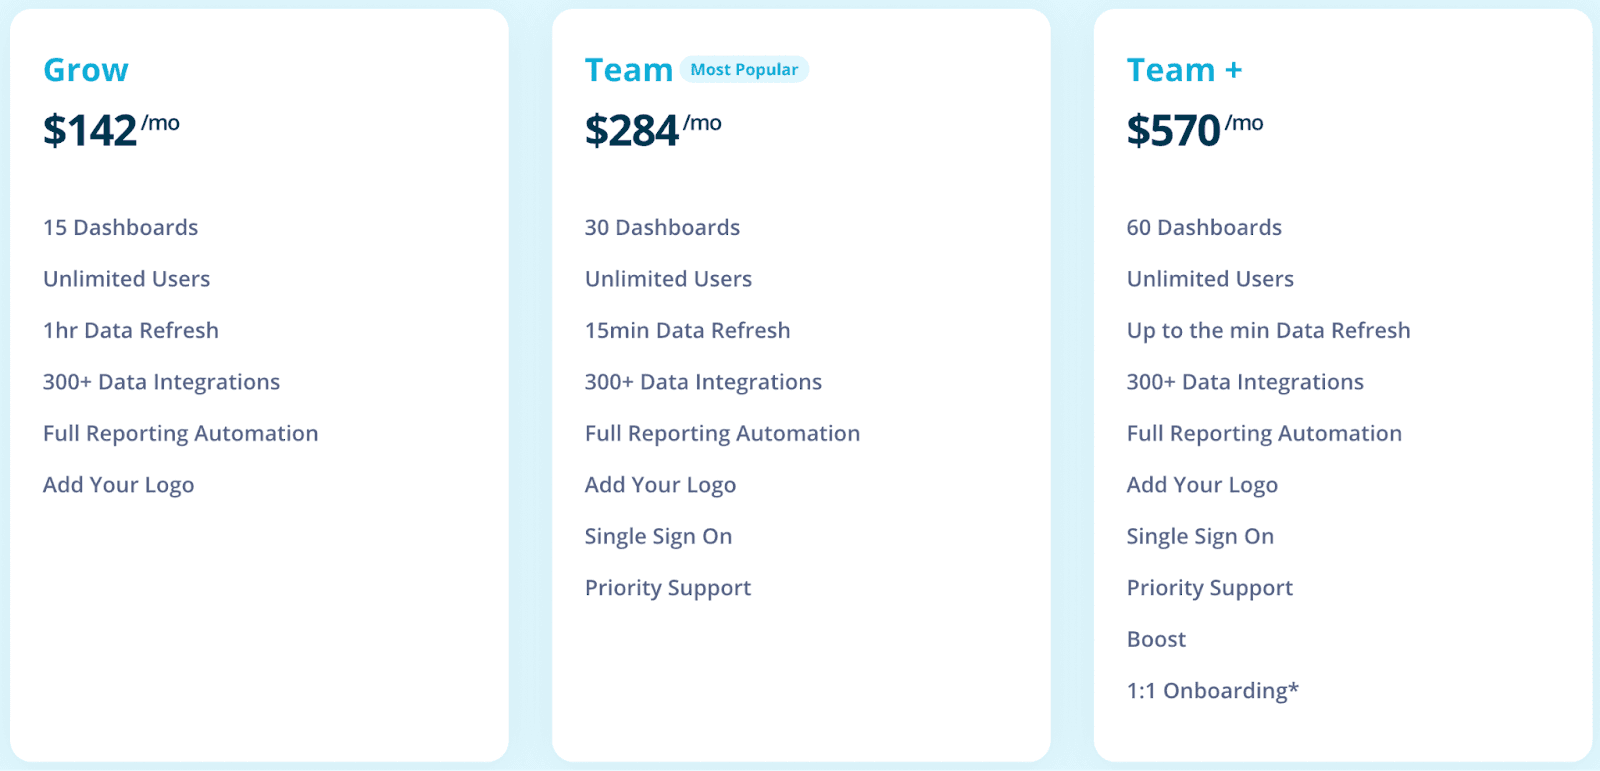
For businesses, it has three plans to offer:
-
Grow: $142/month
-
Team: $284/month
-
Team+: $570/month
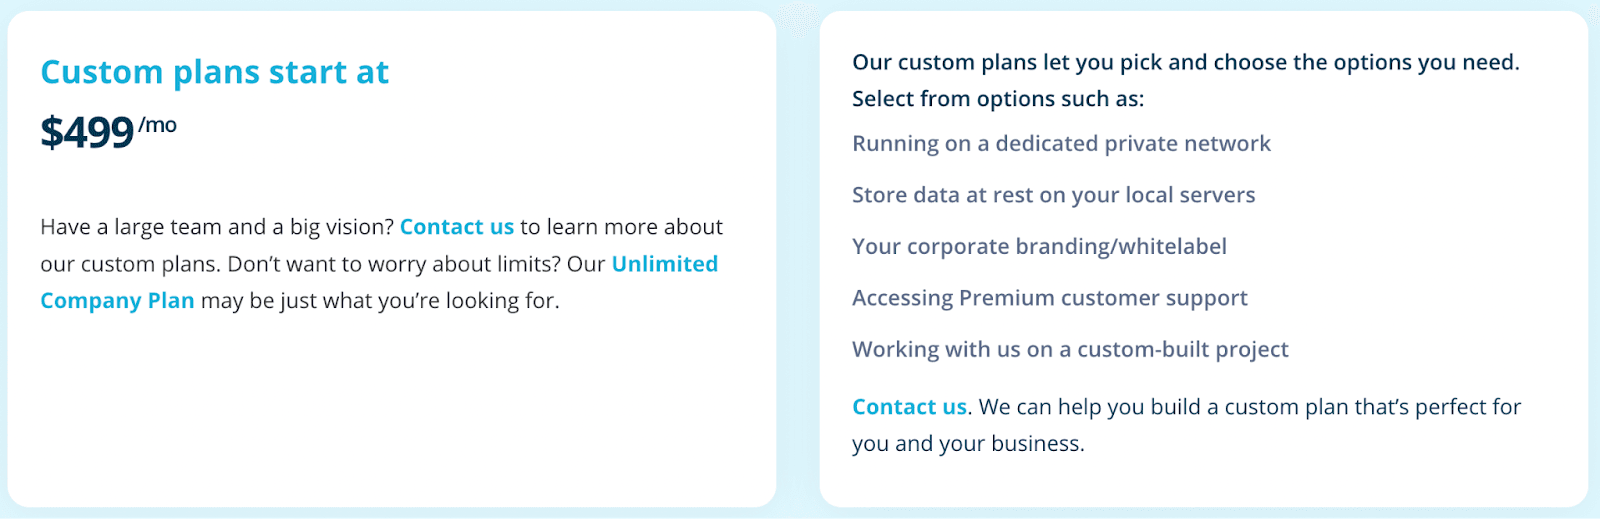
For the enterprise level, it has custom plans starting at $499/month.
What Are Customers Saying?
So, this was our unbiased comparison of Datapad vs. Databox vs. Klipfolio. Now let's hear what customers have to say.
Datapad
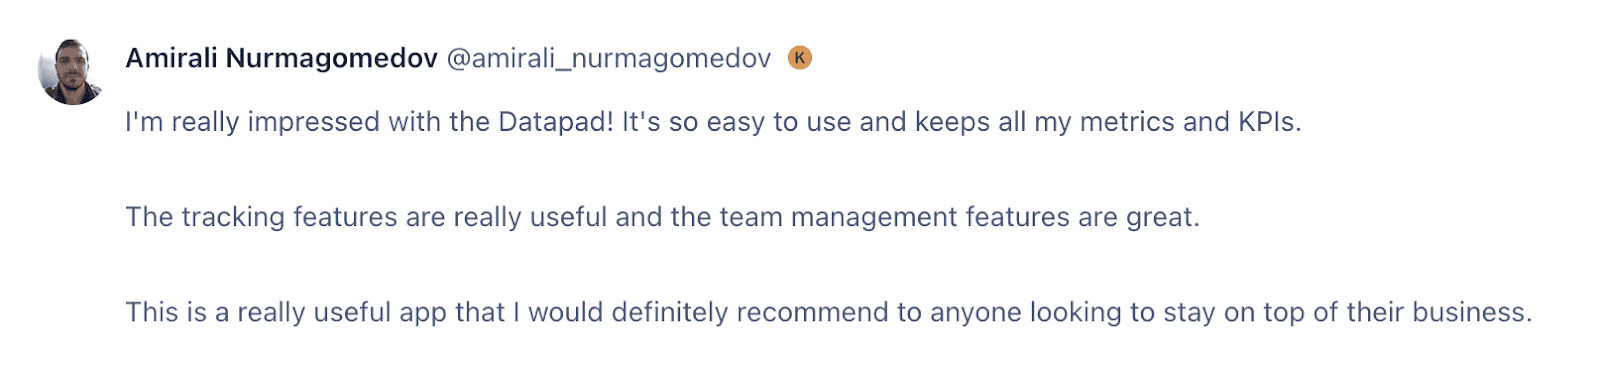
I'm really impressed with the Datapad! It's so easy to use and keeps all my metrics and KPIs.
The tracking features are really useful and the team management features are great.
This is a really useful app that I would definitely recommend to anyone looking to stay on top of their business. - Product Hunt
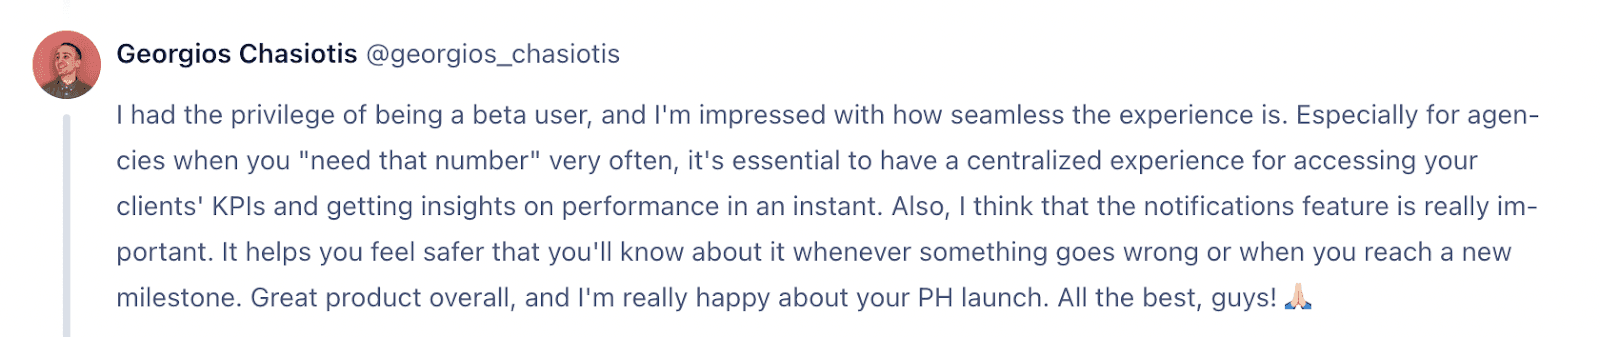
I had the privilege of being a beta user, and I'm impressed with how seamless the experience is. Especially for agencies when you "need that number" very often, it's essential to have a centralized experience for accessing your clients' KPIs and getting insights on performance in an instant. Also, I think that the notifications feature is really important. It helps you feel safer that you'll know about it whenever something goes wrong or when you reach a new milestone. Great product overall - Product Hunt
My goodness, this is stunning.The options are amazing too which seems that we need some time to explore. - Product Hunt

Databox
Though Databox is a sought-after tool, some users found it challenging to create custom mapping within the platform.

While others found Databox's controls to be a little wonky, they also found a lack of granular control on Databox.
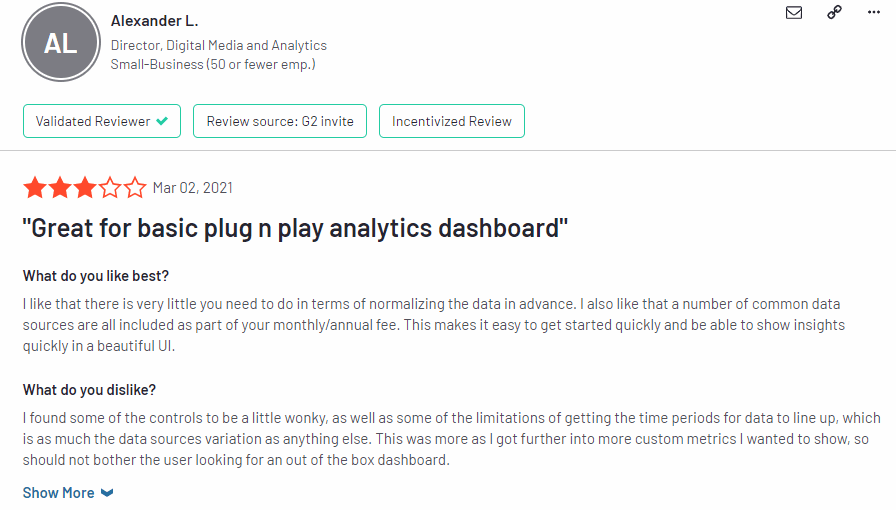
But apart from these minor drawbacks, people voted it superb for basic plug-and-play analytical dashboards.
Klipfolio
Compared to Datapad and Databox, we encountered many reviews that cited Klipfolio as the best fit for technical users.
Evidently, Klipfolio has a steep learning curve, making it daunting for beginners or non-technical users to make the best out of it.

For all, they have reliable customer support for your queries, and you can trust them to serve you solutions.
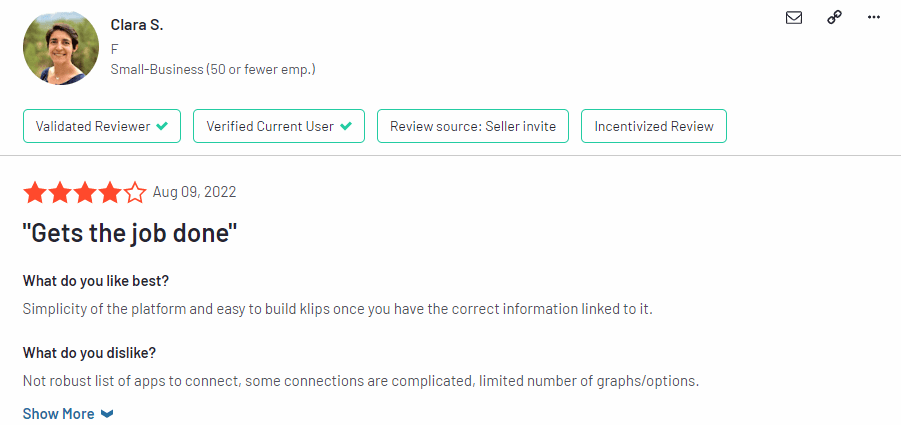
Clara S, a small business owner, liked the platform's simplicity. Apart from this, she wasn't impressed with the number of graphs, options, and connections Klipfolio brings with it.
Wrapping up
As we said earlier, we’re a team of honest people trying to provide you with a trustworthy comparison. From the above-researched features, integrations, and pricing, we were conclusive that:
-
Datapad is best for people who want instant access to KPIs and business dashboards
-
Databox is a comprehensive tool best for marketing and advertising agencies (it can be slightly over budget)
-
Klipfolio has a steep learning curve and some out-of-the-box features, making it apt for advanced users and tech geeks
Regardless of the conclusion, we’re confident that individual marketers and professionals would like to keep KPIs and metrics handy in this dynamic business ecosystem. Isn’t it?
Hence, we are thrilled to provide a solution that:
-
Gives you instant access to all your crucial KPIs
-
Supports flawless team collaboration
-
Helps you manage teams and metrics with the tip of your fingers
-
Serves ease of data import and export with multiple integrations
And last but not least, Datapad is a free to use mobile app (available for both iOS and android) - no matter where you are around the world, we help you connect with your business when you desire.
If you want super quick access to your KPIs try Datapad for free🤩
Related content: Cyfe vs. Geckoboard vs. Datapad: Which Tool is Best For You? [2022]