
According to BankMyCell, around 83% of the population currently owns a mobile phone.
So, when we talk about analyzing important business information, what do you think is the better platform - a heavily wired desktops or a dashboard on mobile?
Here’s a scenario that might help you direct toward the right answer:
Imagine you’re on a beach in California, chilling with a beer in your hand by the sun. 🏖️
Suddenly, you get a text on Slack from your team. They're panicking as one of your business KPIs is acting all strange and your team has no idea what to do! 😳
What do you do?
Will you just book the next flight home and get there to resolve the issue?
Nah!
Instead, have a mobile app to track your KPIs so you can observe, analyze, and communicate to your teammates how to tackle the situation while sitting on a beach.
This way you still get to enjoy the chilled beer by the beach while your team resolves the issue as you suggest to them and keep you in the loop. 😉
All this because you have a mobile dashboard to track KPIs right away!
In this article, you'll discover what mobile dashboards are, their benefits, and how to track KPIs via mobile dashboards using our app Datapad.
What is a Mobile Dashboard?
A mobile dashboard is a data analytics tool that displays key performance indicators (KPIs) and metrics on mobile.
It’s an insightful console that provides access to all the KPIs related to your business from several data sources at your fingertips so that you can make educated business decisions on the go.
Let’s show you an example to understand better.
With the mobile dashboards, you can get real-time data about your car's security if you have integrated the GPS into your mobile.
The GPS dashboard provides remote access to your car’s speed, the last location, stoppage time, and many more things to keep you updated.
Components of Mobile Dashboard
Here are some components that go into the making of a mobile dashboard:
-
Data Sources: The data source could be a database, file, or live data feed. Consider an example of an e-commerce website. To display the information on the products, the website gets information from the inventory database. That makes the inventory database a source of data.
-
Data Visualization Elements: Data visualization is a visual representation of data in simple charts, graphs, and maps. It's a unique combination of art and science that assist the users in discovering patterns that wouldn't have been possible otherwise.
-
Filters: Filters are a crucial part of mobile dashboards. It helps to narrow down the results so that the end user can focus on the most important metrics. For example, applying a gender-specific filter to a dashboard that covers population data will only display the male or female population on the same dashboard.
-
KPI: Key performance indicators are the quantifiable metrics that identify and gauge the success of an organization against its business objectives. KPIs provide targets and insights that help organizations foster continual growth.
-
Dashboard Menu: Dashboard menu allows you to create, save and open new dashboards. You can invoke all the other dashboard settings by clicking on the dashboard menu option.
Now that you know what the components of a mobile dashboard are, let's look at why they're comparatively comfortable in tracking KPIs.
How Are Mobile Dashboards Better than Desktop Dashboards?
There are two key differences between mobile dashboards and dashboards specially built for desktops. Let's have a look at them.
#1. Mobile Dashboard Designs Are Superior than Desktop's
The desktop has relatively more screen real estate than a mobile. Sometimes, that could tempt the dashboard designer to overwhelm it with information, which could be hard on the eyes.
On the flip side, due to its limited screen size, a mobile dashboard only contains key outliers and the most important KPIs. This way, it's easier for mobile users to scan through the vital data and act on it immediately.
#2. Ease of Access
A robust mobile dashboard can amplify your business by providing interactively remote access to high-level KPIs. But the desktop dashboard demands a wired connection to display data, limiting the data accessibility reach.
Although we compared the two dashboards (mobile and desktop) to find the better one, if you want the best of both worlds, ensure that both the platforms are in tandem with one another.
Anyways, let’s talk a little bit more about mobile dashboards.
Just smashing random KPIs on a mobile dashboard won’t do the job. There are some tips and tricks to follow that’d help you track KPIs better.
Let’s see what those are!
Best Practices to Follow While Building Mobile Dashboards
There are three things to take care of while designing a mobile business dashboard:
-
Easy to read
-
Intuitive design
-
Contains only the most relevant information
To make this a process of success so that you and your team actually find what you're looking for, you need to follow certain design practices that include:
#1. Responsive Design
Selecting a mobile tracking KPI software with a responsive dashboard design is crucial.
Responsive designs enable the dashboards to resize the screen according to various devices like smartphones, tablets, and smartwatches.
It allows the user to control which data needs to be in the limelight and what KPIs can be seen later after scrolling..
#2. Less of a Mess
Select a mobile KPI dashboard software that lets you make the best use of your mobile phone screens.
Having a simple and intuitive designed dashboard that has minimum clutter gives you easy access to dashboard elements.
This increases the overall productivity as it allows you and the team members to focus on key metrics.
#3. Wise Use of Filters
Filters help to narrow down the results so that you can focus on what you decide to do.
However, we highly recommend avoiding an app that uses multiple filters on mobile screens.
Select the one that has minimum filters on mobile devices. This stops the screen from getting cluttered and enhances the overall user experience.
Note: Use of multiple filters on a mobile device can drain your mobile battery and slow down the KPI tracking by slowing down the load speed.
#4. Consistency
It can be confusing for you to look at varying user interfaces and layouts of a business dashboard. Thus, being consistent with the design and layouts is deemed as one of the best practices when designing the elements of a mobile dashboard.
#5. First Things First
Overdoing the dashboard with too many flashy graphs and data points will create unnecessary confusion.
To avoid such situations, try having the most important KPIs on the top of your screen. You should have a proper understanding of how to prioritize your KPIs for different teams in your department.
Doing so enables a simplified view of the dashboard elements, which results in faster and more accurate decision-making.
Note: If you have a bunch of KPIs and no other option but to track them all via a single dashboard. Keep the KPIs that you track quarterly and yearly below the ones you track daily or monthly. This way you won’t find yourself scrolling frequently.
What are the Benefits When You View Dashboards on Mobile?
As we saw, the mobile dashboard can take your business to higher levels by offering several pivotal insights in an interactive manner.
Moreover, you can access your data from anywhere you want, which alone makes it an incredible plus point for businesses to invest in.
But wait, there’s more!
Now it’s time we delve deeper into some real-time benefits of a mobile dashboard.
#1. Real-Time Access
Traditional dashboard design demands a hard-wired connection to provide access to data. This limits the users from getting real-time developments on data points which in turn results in ineffective business decisions.
When you start tracking KPIs on mobile, you can immediately access the desired data from anywhere you want.
This broadens the limits of data accessibility which helps you and your team to track and act on KPIs from anywhere in the world.
#2. Accurate Decision Making
By providing real-time information into a mobile dashboard, it's easier to extrapolate and make sense of trends, promoting swift and accurate decisions. This leads to more productive results and enhances the overall business operation.
For example, imagine a law firm hiring legal associates.
The executive of the company may use a real-time mobile dashboard that provides the individual with a comparative view of different parameters like competence, legal internship scores, etc, needed to judge the best among the pool of associates.
This can speed up the decision-making process as there’s enough data to come to a conclusion.
#3. Innovative Business Models
As mobile dashboards provide instant access to powerful analytics almost anywhere, organizations will likely incorporate it into their strategic planning to create innovative business models.
For example, by integrating a mobile app portfolio into their business model, a bakery company easily accesses real-time information on what its hot selling products are.
#4. Sharing
As employees get to easily analyze and communicate vital business metrics in a flexible manner, it allows them to make more informed decisions than before. This way, a mobile dashboard contributes to the accelerated growth and evolution of an organization.
Mobile App Dashboard Examples
With Datapad, creating mobile app dashboards just takes minutes. You can create them manually by plugging in metrics yourself, or you can connect a data source and let Datapad create a beautiful dashboard for you.
Let’s show you some examples of what dashboards we use to track our company’s progress with Datapad.
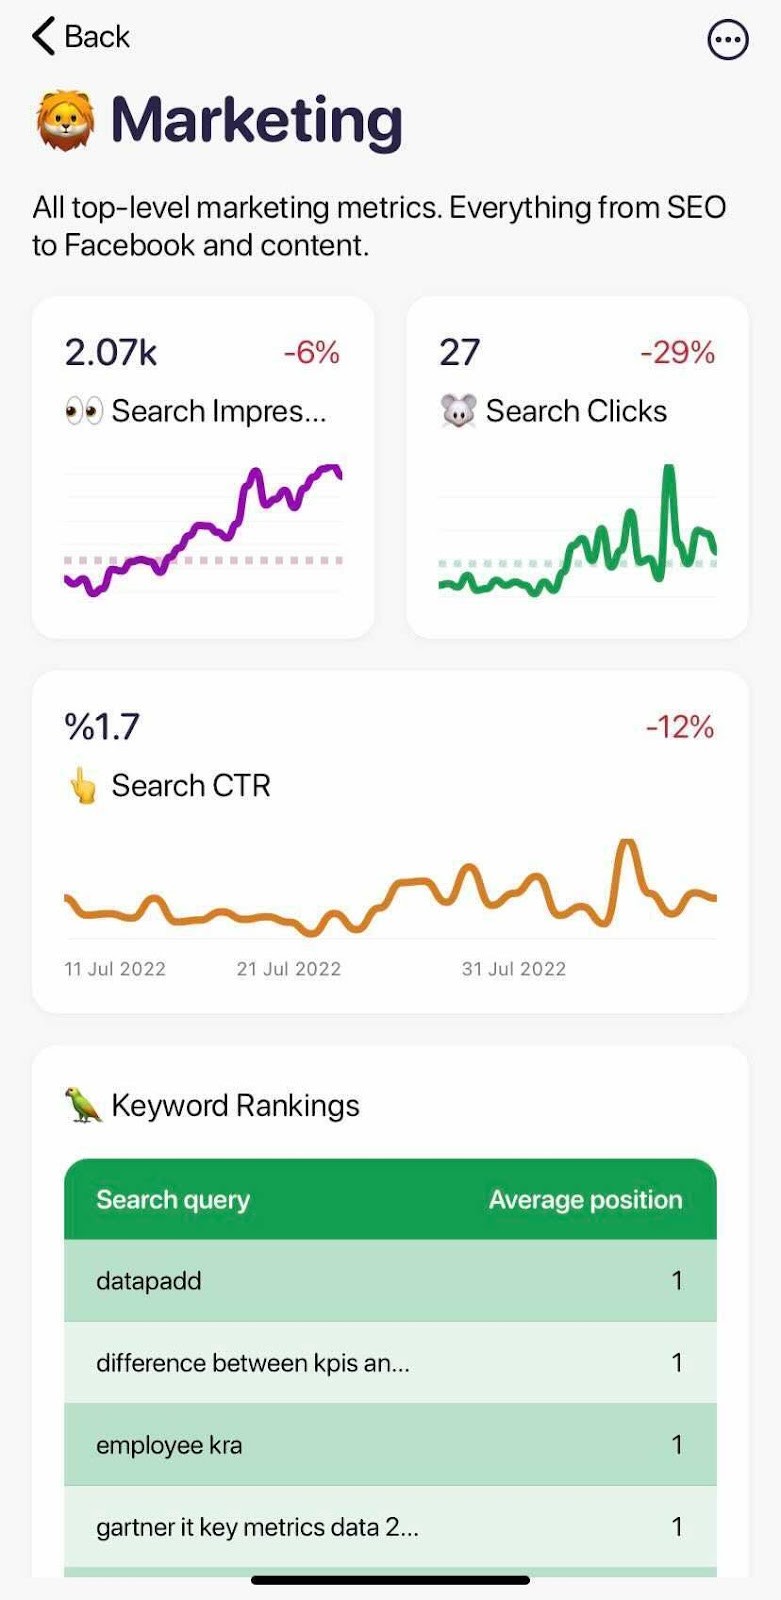
#1. Marketing Dashboard
As the name suggests, our marketing dashboard helps us track all marketing-related KPIs like:
-
Search impressions
-
Number of clicks
-
Click-through rate
-
Number of keywords ranking
And many more…
This dashboard helps us know how much traffic we get organically and via ads (separately).
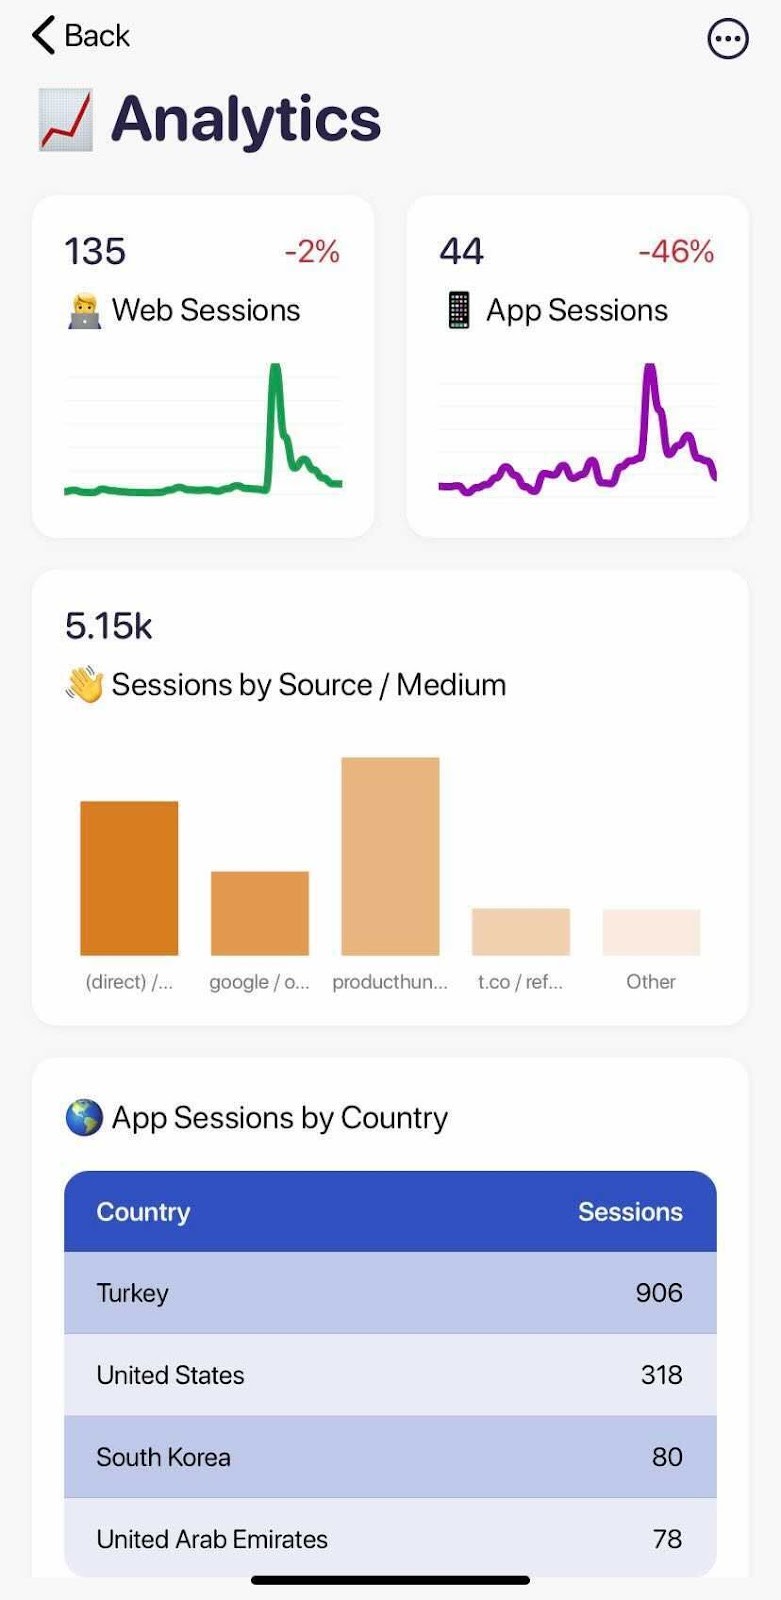
#2. Analytics Dashboard
Our analytics dashboard is connected to the Google Analytics of our website - Datapad.io, and also has our mobile app-related KPIs. With this, we're able to track everything users do on our website and the new signs we get on our app.
A few KPIs that we track via the analytics dashboard are:
-
Web sessions
-
App sessions
-
Session by source/medium
-
App session country-wise
#3. Ecommerce Dashboards
An ecommerce dashboard tracks how your online store is doing. It helps you keep an eye on important ecommerce KPIs that might make or break your store.
Here’s an example of an ecommerce dashboard we created with Datapad:
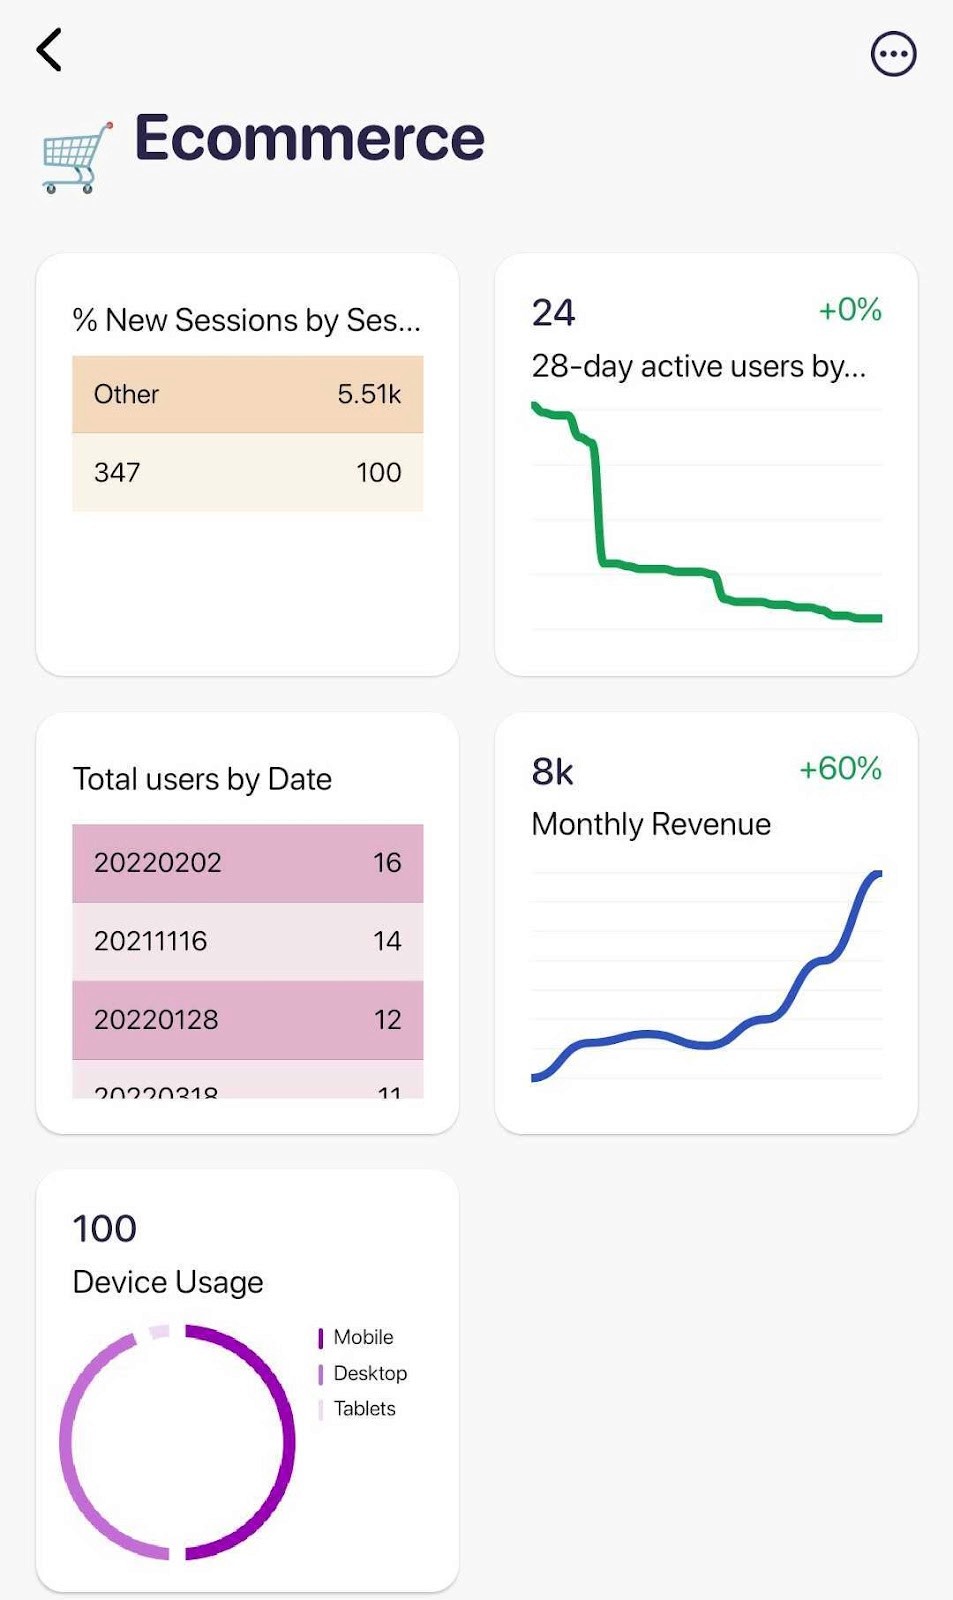
The dashboard tracks KPIs like:
-
% of new sessions monthly
-
Number of active users by location monthly
-
Total number of users by date
-
Monthly Revenue
-
Percentage traffic as per device usage
Related: We Reviewed 8 Best Ecommerce Reporting Tools in 2022 [In Depth Guide]
How Do I Create a Mobile Dashboard?
When it comes to mobile dashboard creations, there’s no better app than Datapad.
Creating a dashboard with Datapad is a 5 step process:
Step 1: Define Your Goals
Defining goals for each KPI you track is an important and a pillar step of mobile dashboard creation.
After finalization of what KPIs to focus on, setting measurable goals for every KPIs.
Here are what goals at Datapad look like:
-
Get 1000 sign ups till the end of 2022
-
Increase website traffic to 10,000 visitors per month till November 2022
-
Publish 50 blogs till the end of September
Do you see how specific these goals are?
This is how you can create goals for your company.
Step 2: Setup a Dashboard
Open the Datapad app, log into your account, and just click on ‘Create a Dashboard.’
The app will ask you to add a Title, description, and emoji (😇). You can add those and click on ‘Create.’
Step 3: Add Your KPIs Manually or Use a Data Source
To add KPIs manually, tap on ‘Add Metric’ and select Enter Manually.
-
Add a Title
-
Set a value to compare your KPI against if needed
-
Customize the color, date, and set goal
Later, choose the type of graph you want your KPI to have - A bar graph, Pie chart, Line diagram, or a simple table

Datapad has integrations with the likes of Google Analytics, Shopify, Facebook Ads, etc, and has one-click integrations that you can leverage to import data quickly.
To add KPIs automatically:
-
Tap on the three dots you see on the right-hand side corner
-
Press the + sign that says Metrics
-
Go to ‘Use a Data Source.’
Select the data source you want to import the data from.

Step 4: Onboard Your Team
Every business needs a team to track KPIs. It’s often an exhaustive task for an individual to track every KPI essential for a business.
To add team members to your Datapad account:
-
Click on the left-hand side logo of the app
-
Go to Manage users
-
Click on the plus sign on the right-hand side corner
-
Enter the email address of your team member and tap invite users

Our app also lets you search KPIs on any dashboard you create. This helps you easily drill down to a specific KPI you want to track when you’re short on time.
<new GIF>
Step 5: Monitor Your KPIs and Get Updated with Notifications
The best part about Datapad is its real-time notifications. If a KPI is not performing as expected, you get a push notification and can act on it immediately.
What’s more, you can even talk to your teammates about it on our Mobile app. Every KPI you track has a comment section just below it to talk and update your teammates.
Datapad is a mobile-friendly app (available for both iOS and Android) that lets you track KPIs on the go.
All you need is an iphone or android phone and a stable internet connection. We try our best to give a seamless user experience to all the KPIs trackers out there.
You can get started with our mobile application for free - no credit card required.
Conclusion
Mobile dashboards are great for keeping track of your top level KPIs easily from anywhere and anytime. If you are en executive who wants keep track of your business from anywhere, dashboards on mobile are perfect for you.
Sign up to Datapad for free to keep all your KPIs in your pocket
Read more: How to Build a KPI Dashboard in Excel?