
Picture this: You're in a crucial product meeting, and your CEO asks, "How's our activation rate trending?" You scramble to pull up three different dashboards, ping your data team, and promise to circle back "within the next few days." Sound familiar? You're not alone.
Product managers across industries face the same frustrating reality: dependency on data teams has become the biggest bottleneck in product analytics. Traditional analytics processes force PMs to wait days or weeks for basic insights, severely limiting agility and responsiveness to market changes.
But here's the thing – tracking product metrics doesn't have to be this painful. The right approach to product analytics can transform how you understand user behavior, optimize product performance, and drive business growth.
What is Product Analytics and Why It Matters More Than Ever
Product analytics is the practice of collecting, analyzing, and acting on data about how users interact with your product. It's not just about tracking numbers – it's about understanding the complete user journey, from first touch to loyal customer.
The stakes have never been higher. With increasing competition and rising customer acquisition costs, product managers need instant access to actionable insights. According to recent industry reports, companies that leverage AI-powered product analytics see 23% faster decision-making and 31% improvement in product KPIs.
Product analytics serves multiple critical functions:
-
Understanding user behavior patterns to optimize the product experience
-
Identifying bottlenecks in the user journey that impact conversion
-
Predicting churn before it happens and taking proactive measures
-
Measuring feature adoption to guide product roadmap decisions
-
Calculating ROI on product investments and improvements
Essential Product Metrics Every PM Should Track
The key to effective product analytics isn't tracking everything – it's tracking the right things. Here are the product metrics that actually move the needle:
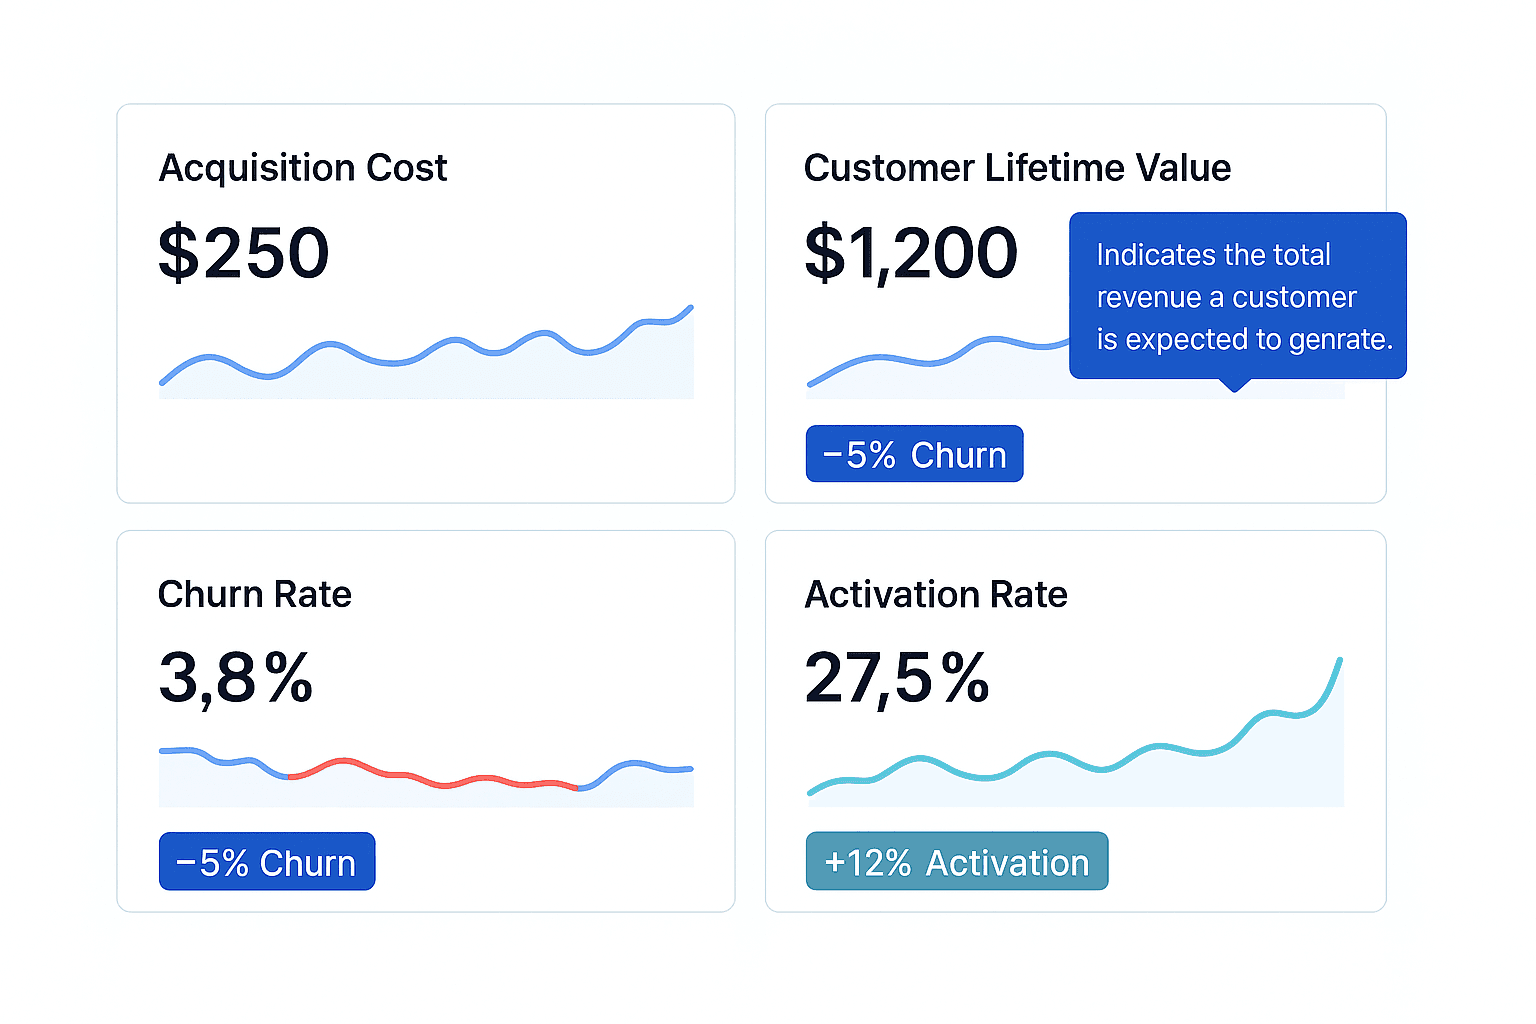
Customer Acquisition Cost (CAC)
What it measures: The average cost to acquire a new customer across all marketing and sales channels.
Why it matters: CAC directly impacts your bottom line and helps you understand the efficiency of your growth efforts. A rising CAC without corresponding increases in customer lifetime value signals trouble ahead.
How to calculate: Total acquisition costs ÷ Number of new customers acquired
Industry benchmark: Varies by sector, but SaaS companies typically aim for a CAC payback period of 12-18 months.
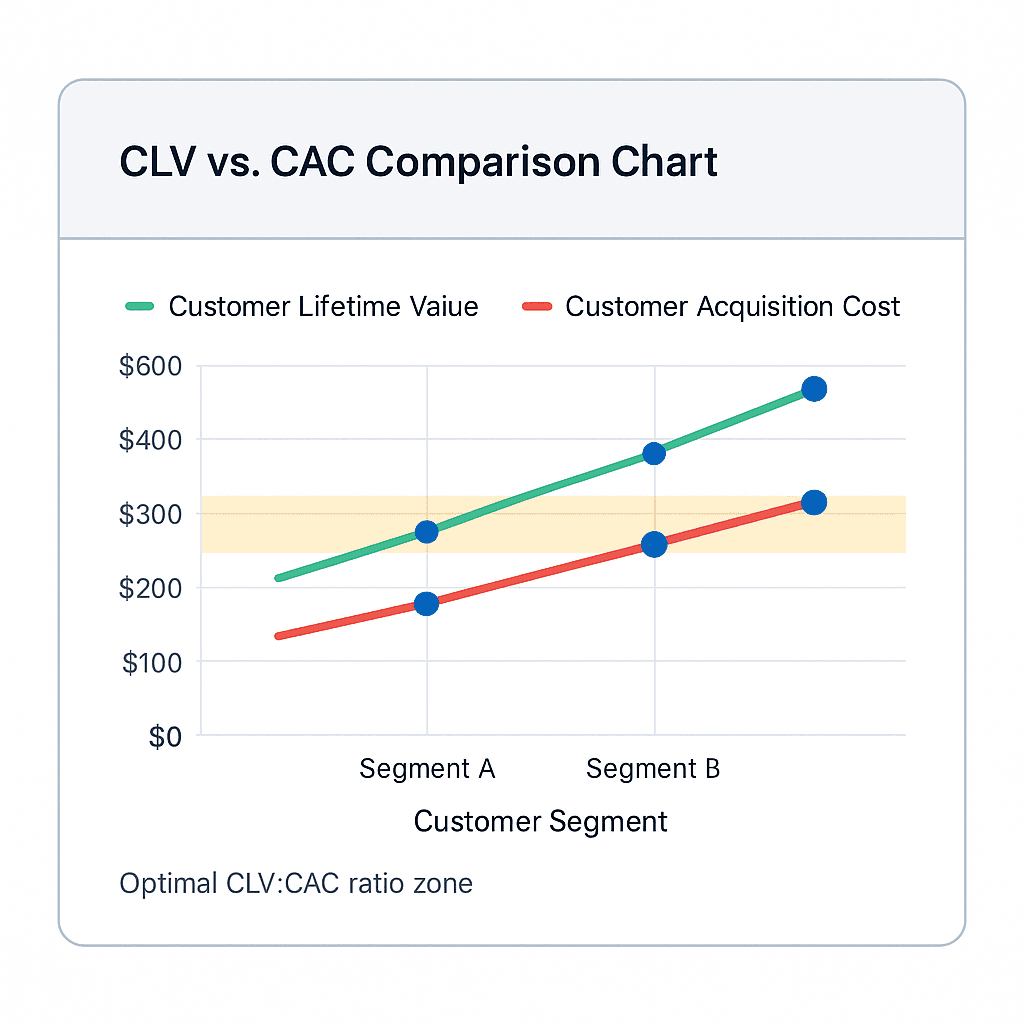
Customer Lifetime Value (CLV)
What it measures: The total revenue you can expect from a customer throughout their entire relationship with your product.
Why it matters: CLV helps you understand how much you can invest in customer acquisition while maintaining profitability. It's also crucial for identifying your most valuable customer segments.
How to calculate: Average revenue per customer × Average customer lifespan
Pro tip: Focus on the CLV:CAC ratio – a healthy ratio is typically 3:1 or higher.
Monthly Recurring Revenue (MRR) and Annual Recurring Revenue (ARR)
What it measures: Predictable revenue generated from subscriptions on a monthly or annual basis.
Why it matters: MRR and ARR provide clarity on business growth trajectory and help with financial forecasting. They're especially critical for subscription-based products.
How to calculate: Number of customers × Average revenue per customer per month/year
Churn Rate
What it measures: The percentage of customers who stop using your product during a specific time period.
Why it matters: Churn rate is often the most important metric for product health. High churn indicates fundamental product-market fit issues, while low churn suggests strong product value.
How to calculate: (Customers lost during period ÷ Total customers at start of period) × 100
Industry insight: Best-in-class SaaS companies maintain annual churn rates below 10%.
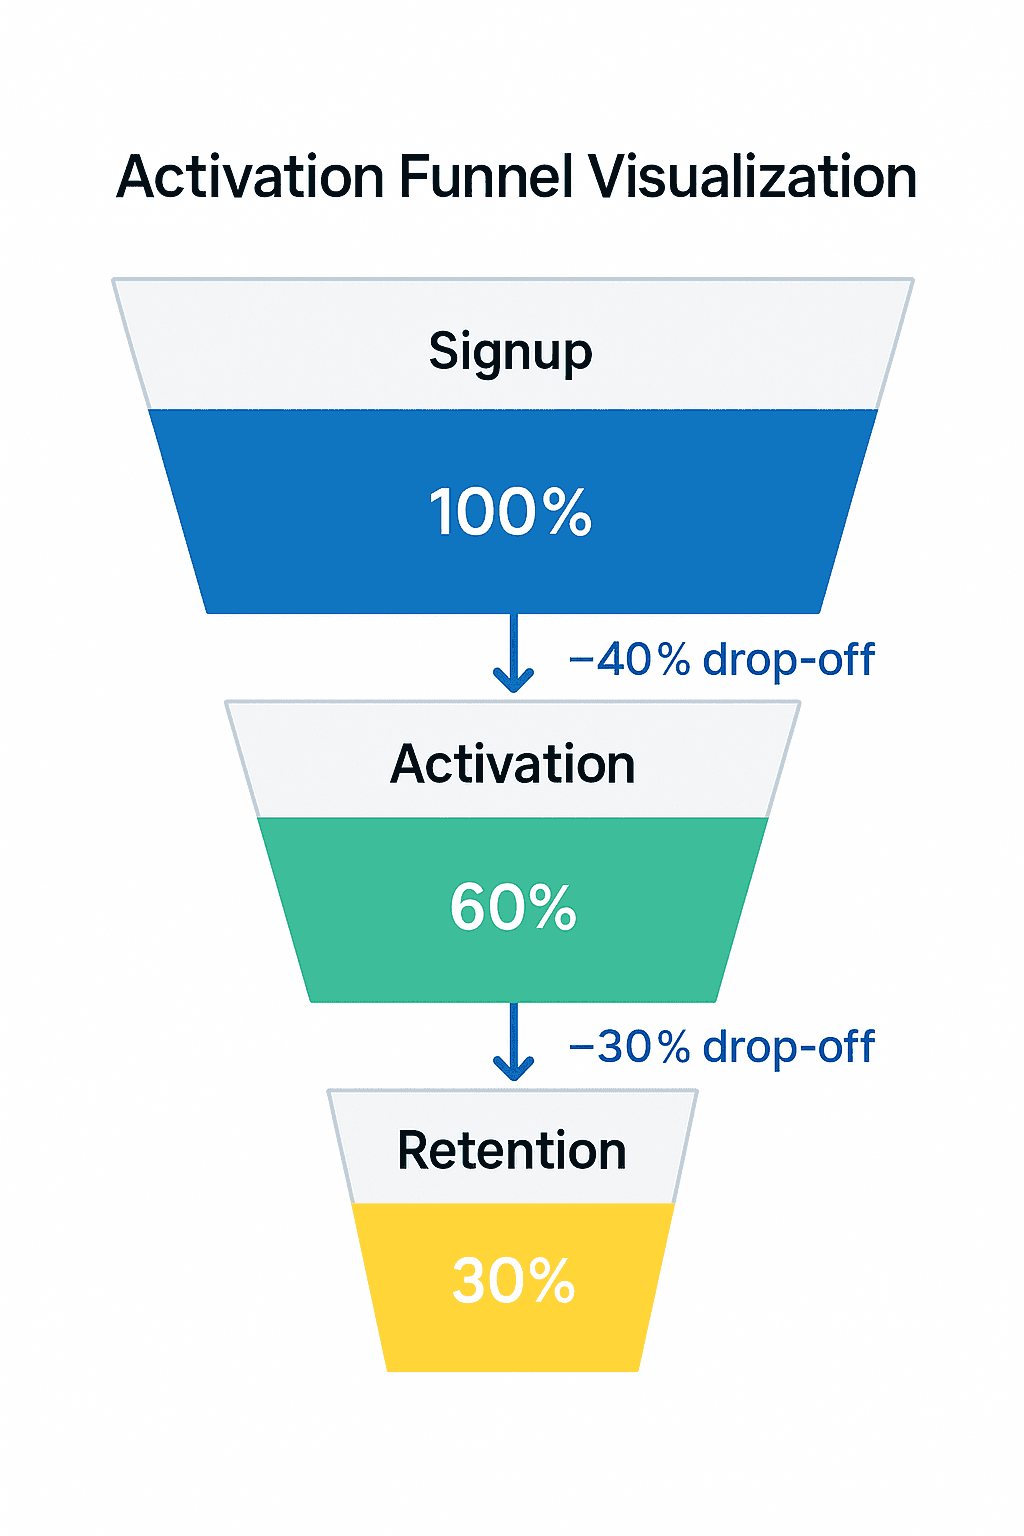
Activation Rate
What it measures: The percentage of new users who complete key actions that indicate successful product adoption.
Why it matters: Activation rate is a leading indicator of long-term customer success. Users who don't activate are highly likely to churn.
How to calculate: (Users who completed activation events ÷ Total new users) × 100
Critical consideration: Define your activation event carefully – it should represent genuine value delivery, not just feature usage.
AI-Powered Product Analytics: The Game Changer
The biggest shift in product analytics isn't just about what metrics to track – it's about how you access and act on those insights. AI-powered product analytics tools are transforming how product managers work with data.
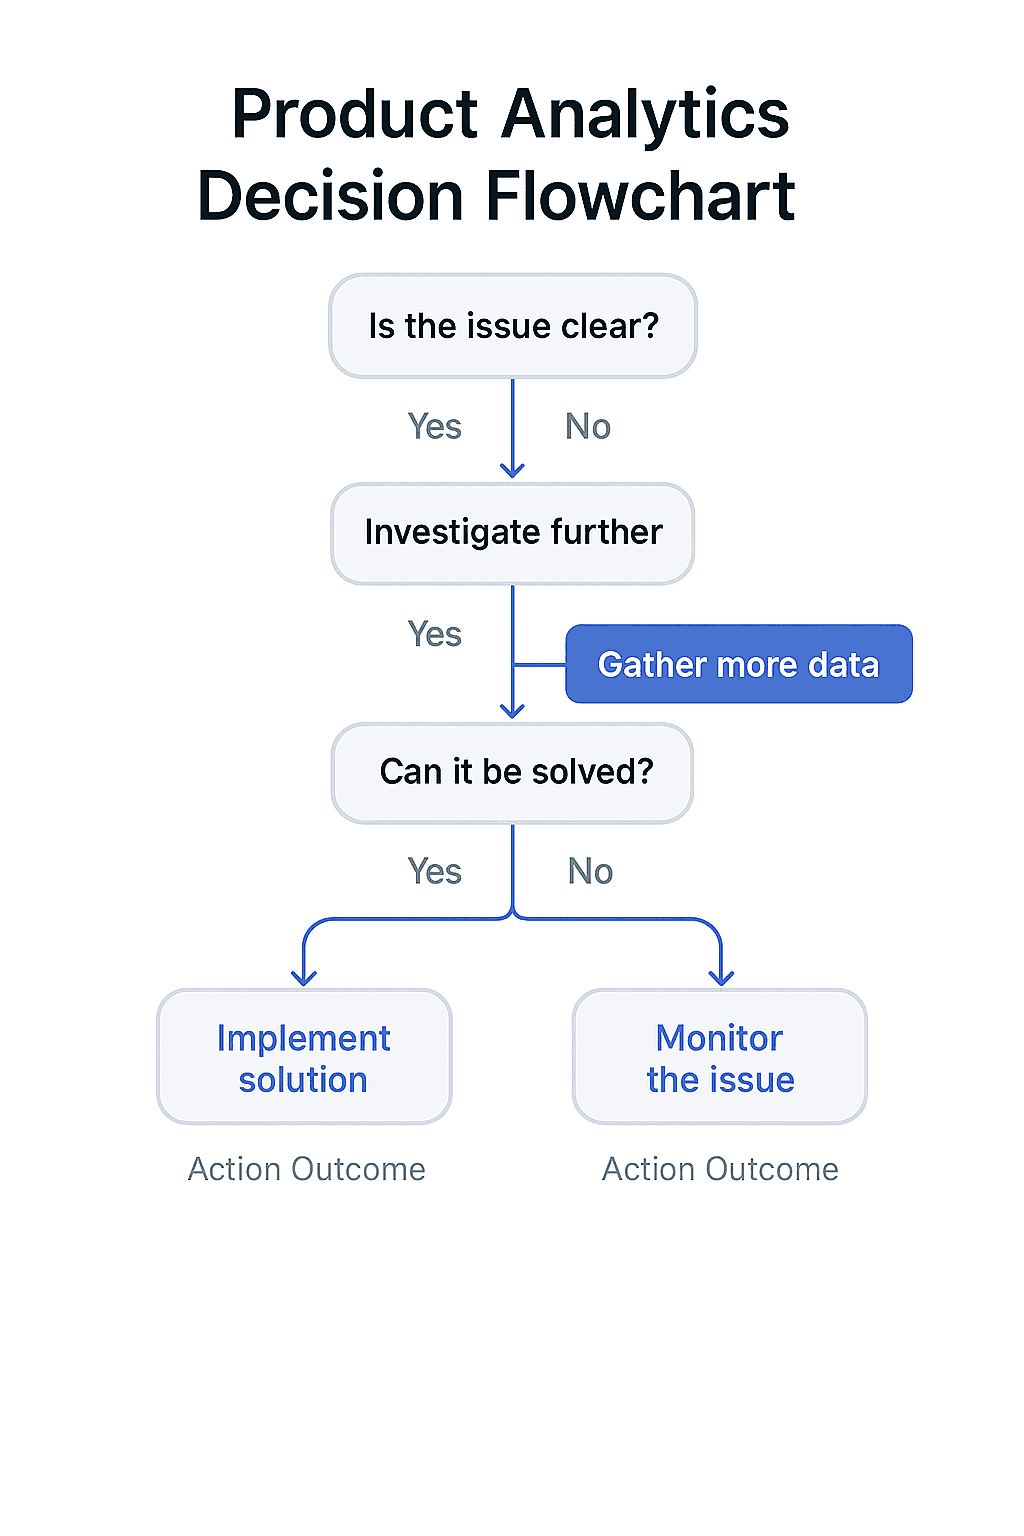
Traditional product analytics process:
-
Identify question
-
Request data from analytics team
-
Wait 3-5 days for response
-
Receive static report
-
Ask follow-up questions
-
Repeat cycle
AI-powered analytics process:
-
Ask question in plain English
-
Get instant insights with visualizations
-
Drill down with conversational queries
-
Receive proactive alerts about changes
-
Share insights instantly with stakeholders
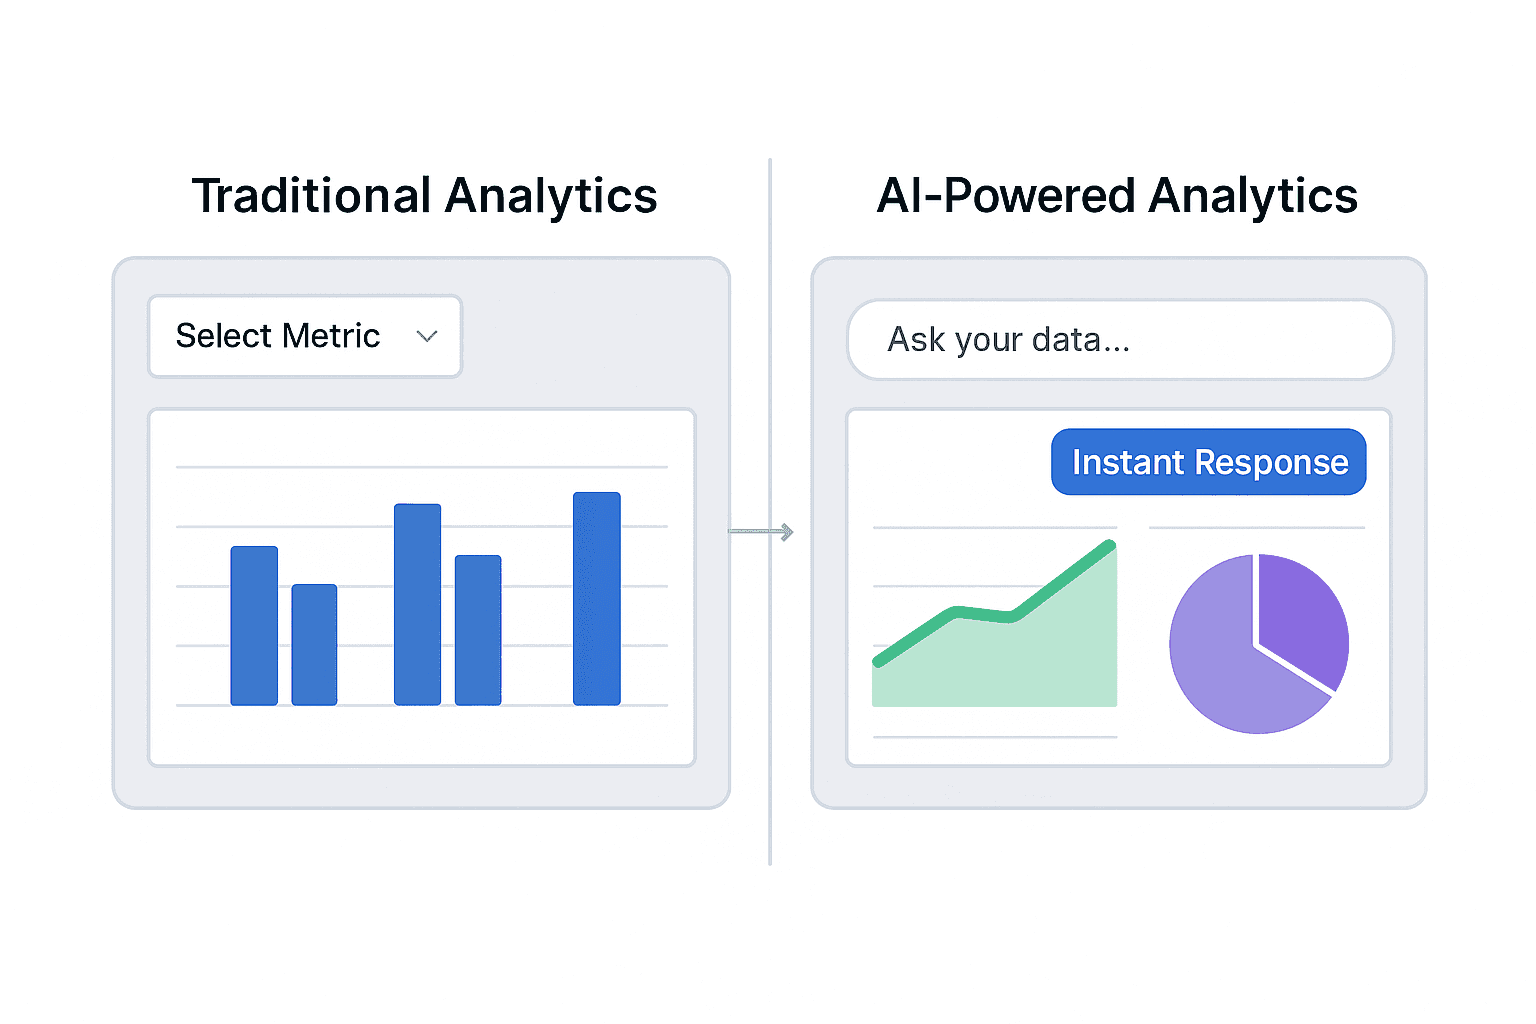
The Power of Conversational Analytics
Instead of learning complex dashboard interfaces, product managers can now simply ask: "How did our activation rate change after the onboarding redesign?" or "Which customer segments have the highest churn risk?"
This conversational approach to product analytics eliminates the technical barriers that have historically slowed down product decision-making. Tools like Datapad's AI analyst can connect to your existing data sources – Google Analytics, Facebook Ads, PostgreSQL, MongoDB – and provide instant answers to complex product questions.
Best Practices for Product Analytics Implementation
Focus on Your North Star Metrics
The most successful product teams identify 2-3 key metrics that directly correlate with business success. These "North Star" metrics should:
-
Align with your company's strategic objectives
-
Be measurable and actionable
-
Reflect genuine user value
-
Be understandable across the organization
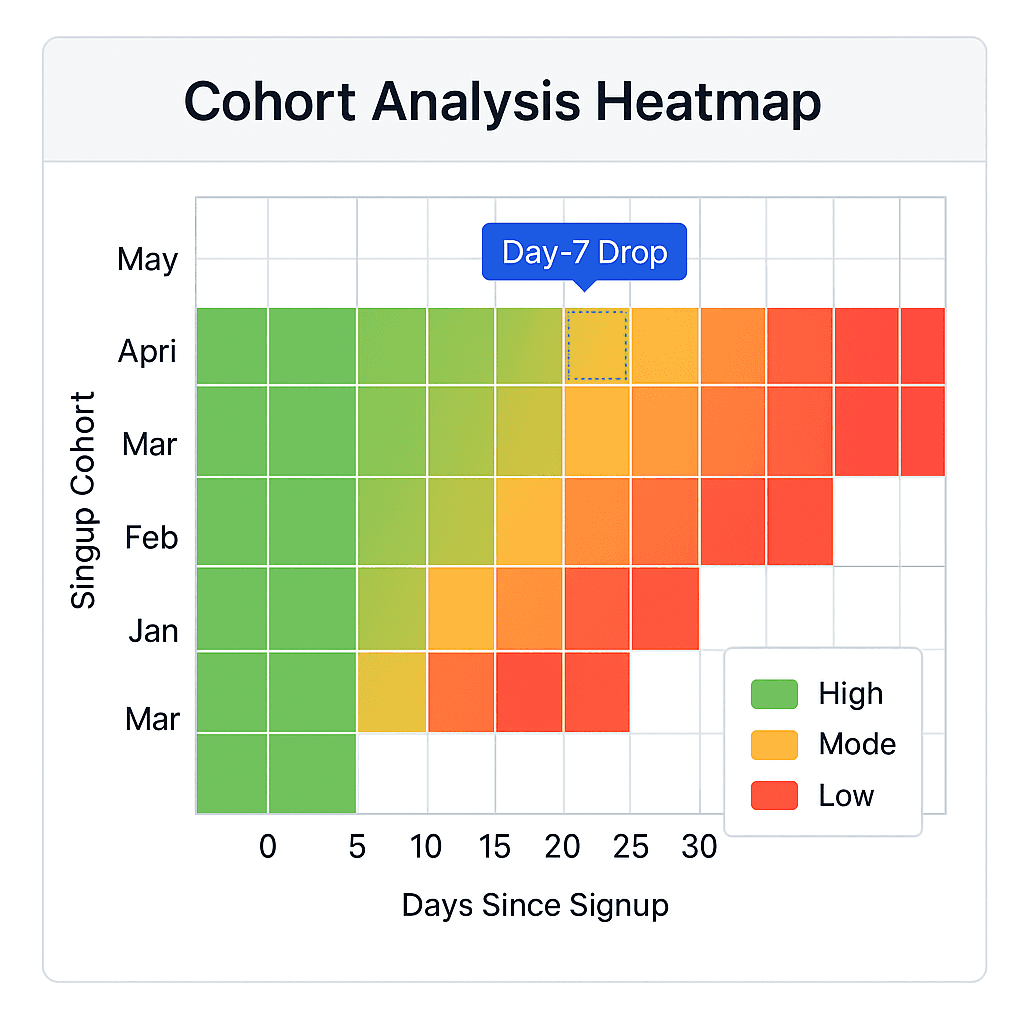
Implement Cohort Analysis
Cohort analysis allows you to track how different groups of users behave over time. This is particularly powerful for understanding:
-
How product changes impact user behavior
-
Which acquisition channels provide the highest-quality users
-
How customer behavior evolves with product maturity
Set Up Automated Alerts
Rather than checking dashboards constantly, set up intelligent alerts that notify you when important metrics move outside expected ranges. This proactive approach ensures you catch issues early and capitalize on positive trends quickly.
Regular Metric Reviews and Adjustments
Product analytics isn't a "set it and forget it" process. Schedule regular reviews to:
-
Assess whether your current metrics still align with business goals
-
Identify new metrics that have become important
-
Eliminate vanity metrics that don't drive decisions
-
Adjust benchmarks based on market changes
Common Product Analytics Pitfalls to Avoid
The Vanity Metrics Trap
Vanity metrics like total page views, app downloads, or registered users can make you feel good but don't necessarily indicate product success. Instead, focus on metrics that predict business outcomes.
Replace vanity metrics with actionable ones:
-
Instead of "total users," track "active users"
-
Instead of "feature usage," track "feature adoption depth"
-
Instead of "email opens," track "email-driven conversions"
Over-Reliance on Lagging Indicators
While metrics like revenue and churn are important, they're lagging indicators. Balance these with leading indicators like:
-
Product engagement scores
-
Feature adoption rates
-
Customer satisfaction surveys
-
Support ticket volume
Analysis Paralysis
Having access to massive amounts of data can be overwhelming. Combat analysis paralysis by:
-
Starting with your most critical business questions
-
Focusing on metrics that directly inform decisions
-
Using AI-powered tools to surface the most important insights
-
Creating regular reporting cadences
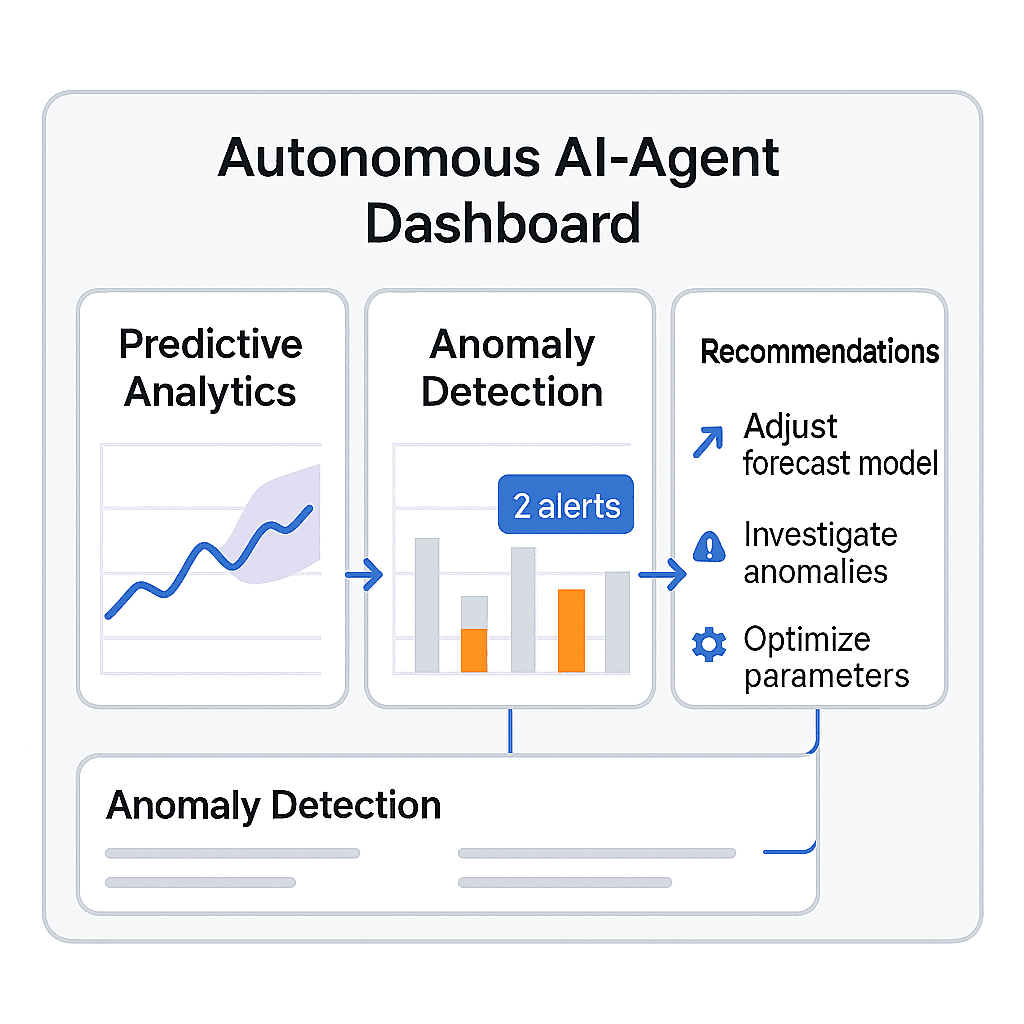
The Future of Product Analytics: Autonomous AI Agents
The next evolution in product analytics is already here: autonomous AI agents that don't just answer your questions but proactively monitor your product metrics and surface insights you wouldn't have thought to look for.
These AI agents can:
-
Detect anomalies in user behavior before they become problems
-
Predict churn with higher accuracy than traditional models
-
Recommend product improvements based on usage patterns
-
Automatically generate reports for stakeholders
-
Integrate external context like market trends and competitor actions
For product managers, this means shifting from reactive data analysis to proactive product optimization. Instead of spending hours in spreadsheets, you can focus on strategy and execution while your AI agent handles the heavy lifting of data analysis.
Getting Started with Modern Product Analytics
Ready to upgrade your product analytics approach? Here's your action plan:
1. Audit Your Current Metrics
-
List all the metrics you currently track
-
Identify which ones actually influence decisions
-
Eliminate vanity metrics that don't drive action
2. Define Your North Star Metrics
-
Choose 2-3 metrics that align with business goals
-
Ensure they're measurable and actionable
-
Get stakeholder buy-in on these priorities
3. Implement AI-Powered Analytics
-
Choose a tool that integrates with your existing data sources
-
Look for conversational interfaces that reduce friction
-
Prioritize tools that provide proactive insights, not just reactive reporting
4. Establish Regular Review Cycles
-
Set up weekly metric reviews with your team
-
Schedule monthly deep dives into user behavior
-
Conduct quarterly reviews of your metric framework
Conclusion: From Data Dependency to Data Autonomy
The era of waiting days for basic product insights is over. Modern product analytics, powered by AI and conversational interfaces, puts the power of data directly in product managers' hands.
The most successful product teams in 2025 will be those that embrace this new paradigm – moving from dependency on data teams to autonomy in data analysis. They'll make faster decisions, identify opportunities earlier, and respond to market changes with unprecedented agility.
The question isn't whether to upgrade your product analytics approach – it's whether you can afford not to. Your users are generating valuable behavioral data every second. The teams that can turn that data into actionable insights fastest will win.
Ready to transform your product analytics? Try asking your data a simple question in plain English. You might be surprised by how much faster you can move when the friction is removed from finding answers.
Want to experience the future of product analytics? Get started with Datapad and ask your first question in seconds, not days.