
Do you know that Facebook’s potential advertising reach is over 2.11 Billion people? 🤯
That’s an impressive reach for any social media platform, right? Besides, this reach covers 63.7% of all Americans above 13 years of age.
So yes, running your marketing campaigns and advertisements on Facebook is a good decision. But how will you track these millions and billions of data coming your way?
It's pretty simple, track Facebook KPIs.
Wondering what we mean by Facebook KPIs? Read this article to know all about them!
What are Facebook KPIs?
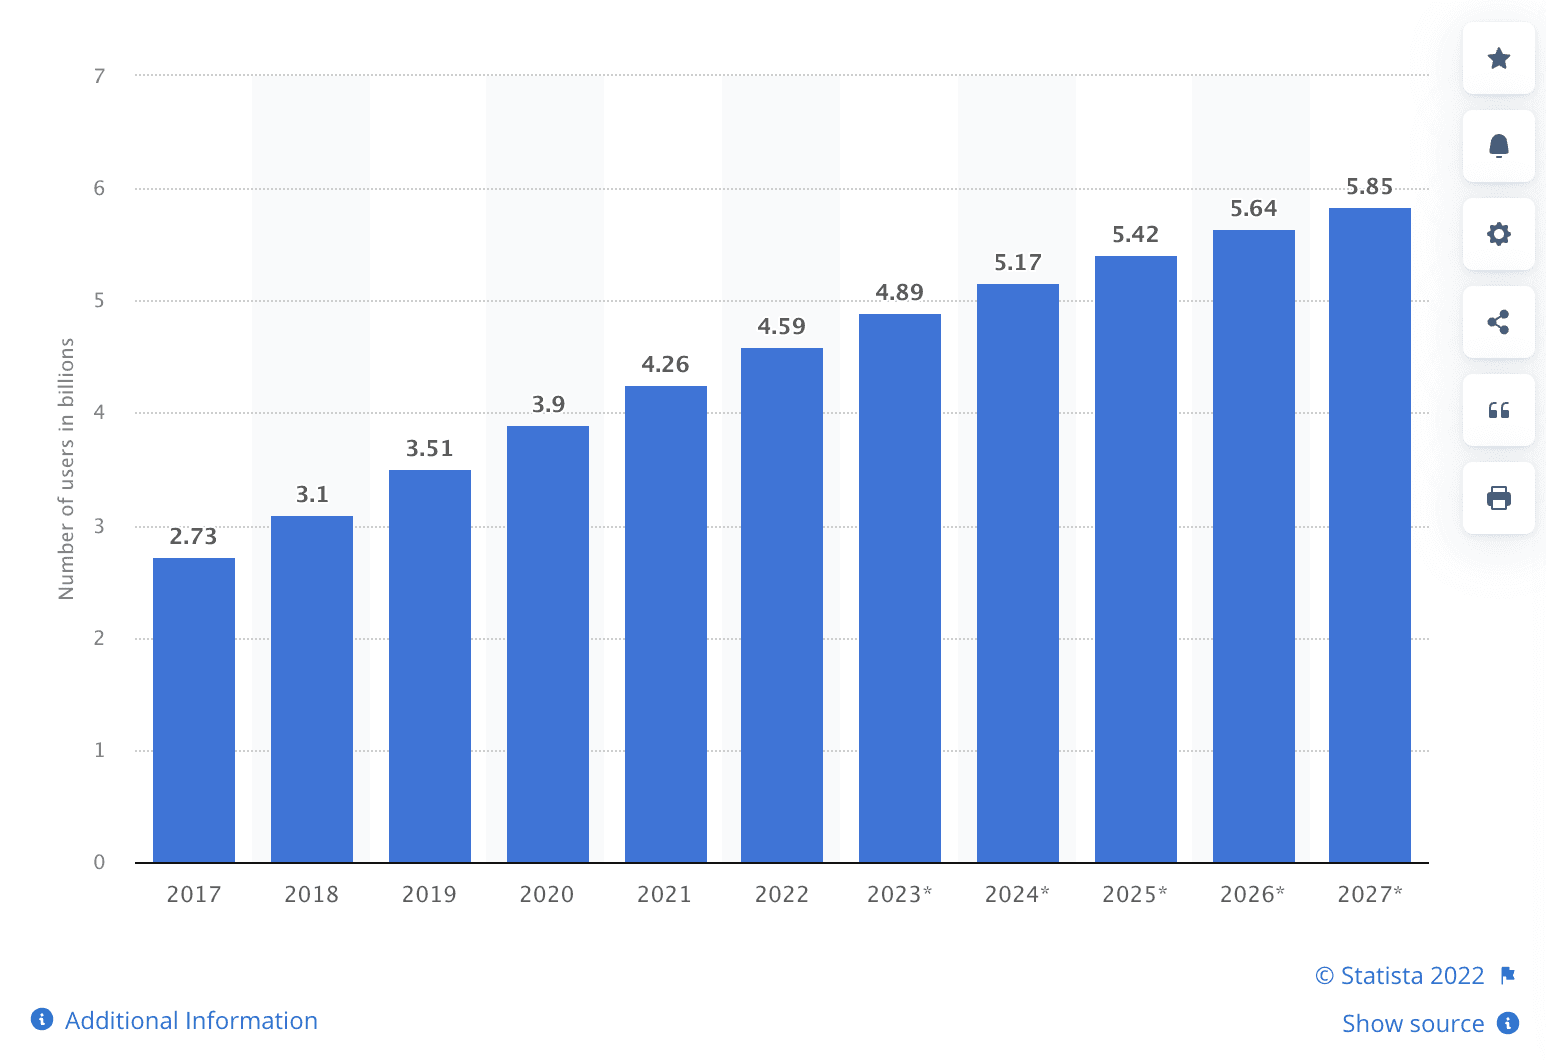
Facebook is the world's most active social media platform, with over 2.934 billion monthly active users. Since the user base is significantly higher, the data coming across to you becomes complicated with time.
We say so because the platform has tons of information to share with you. 😉
Here, we're not talking about private info but the insights collected from your activities, posts, campaigns, and ads. Here's when Facebook KPIs come into play.
Facebook KPIs are a set of quantifiable measurements used to gauge the performance of a Facebook page. It measures specific details related to your Facebook pages, like the number of shares, post engagement, follower growth, link clicks, and more.
But that’s not it.
There's another category of Facebook KPIs, popularly known as Facebook Ad KPIs, that specifically measure the performance of your ad campaigns on the platform.
Evidently, a cluster of businesses relies on Facebook ads to build an audience, attract customers, and drive relevant traffic back to the site.
Facebook ad KPIs help you to dig deeper into your ad campaigns and get insights related to ad relevance, quality, and performance. Unlike Facebook's organic KPIs, they monitor a business's core advertising and marketing analytics.
Why Are Facebook KPIs Important?
You see, social media has a global outreach of 4.2 billion users.
More or less, 9 out of 10 people who surf the net use social platforms. This user base is spread across various platforms like YouTube, Instagram, Twitter, and Facebook.
For the most part, Facebook has the most extensive user base. In the U.S itself, it has 182.3 million active users.
This brings us to the fact that tracking and monitoring Facebook insights are important.
Here's what we think tracking Facebook KPIs can do for your business:
-
🧪 Help You Iterate Strategies: Every ad campaign has an end goal. May it be sales, lead generation, or brand awareness. Your end goal is what determines your KPIs. If your campaigns are not performing as expected, you can briefly look at the KPIs to understand what needs to be worked on.
-
📈 Spot Patterns and Trends: KPIs are not for single-time use. They help you track and compare your performance consistently, believing you have the same goals in place. Hence, Facebook KPIs can immensely help you identify the pattern, trends, and user behavior toward your campaigns or Facebook page.
-
👀 Gauge Ad Campaign Performance: Facebook KPIs are the right set of analytics to gauge your campaign performance. They present you with a detailed overview of campaigns or ad performance.
-
✅ Plan Predictive Growth: When you set SMART Facebook KPIs, you're one step away from accurately predicting growth. These KPIs can let you forecast monthly or annual growth and help you plan ahead to accommodate that growth.
Facebook KPIs and Facebook Ads KPIs: What is the Difference?
Facebook KPIs are classified into two categories: Organic KPIs and Ad KPIs.
When we talk about organic KPIs, we measure posts that don't require an investment, sponsor, or marketing budget. Facebook organic ads are closer to SEO; therefore, the traffic and leads you generate from them are free of cost.
Some examples of Facebook organic KPIs include the number of post likes, share of voice, organic impressions, and organic reach.
On the other hand, ad KPIs are used to gauge the performance of a clearly organized and funded campaign on Facebook.
Now, you might have a question, Is it necessary to measure your organic and inorganic growth individually?
The answer is - Yes, at all times. Doing this allows you to examine your marketing efforts distinctively and lays a clear boundary between your paid and organic results.
What are the Most Important Facebook Organic KPIs to Track?
KPI #1. Organic Impressions
Impressions, in organic terms, measure the number of times your content landed on a user's Facebook feed. Simply put, it's the number of times your content was viewed.
Why Is It Important?
Tracking impressions becomes vital because the ultimate goal of marketing teams is to increase brand visibility. You must ensure that your content is seen by a larger audience.
The fewer the impressions, the lesser the visibility on the platform, and the fewer chances you have to acquire customers or leads.
Sticking to the organic side, impressions are a clear indicator of your organic marketing efforts.
Moreover, measuring this KPI is no rocket science. It doesn't even have a formula. You can sign in to Facebook Creator Studio and click on the content library to access these insights.
KPI #2. Organic Reach
Reach refers to the number of unique users on Facebook that have viewed your content. Although impressions and reach seem to be alike, they have distinct purposes.
You see, reach is defined as the number of users that have seen your content at least once, while impressions define the number of times your content was displayed to the audience.
Why Is It Important?
The higher your organic reach, the higher the chances of generating more leads and acquiring more customers.
Reach can be categorized into two types:
-
Post Reach: The number of unique viewers of your Facebook post
-
Page Reach: The number of unique viewers of your Facebook fan page
Tracking both of these is pretty straightforward. You can easily measure them via Facebook analytics or Datapad.
Here's the Fun Part: If the same user views your content twice during a given timeframe, Facebook measures it as one unique visitor.
So, no matter how often someone re-views your content, it will still be considered as one unique user or counted as one reach.
KPI #3. Organic Followers Growth
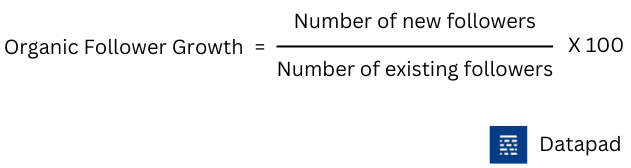
This KPI measures the change in the number of followers on your Facebook fan page over a given period. It specifically measures follower growth from organic marketing strategies.
Why Is It Important?
Tracking organic follower growth over a weekly or monthly basis tells you how well your content resonates with the target audience.
A positive follower growth indicates that your marketing efforts are right in place and your Facebook page is progressing and improving with time. Whereas, a negative trajectory is a bad sign.
KPI #4. Engagement Rate
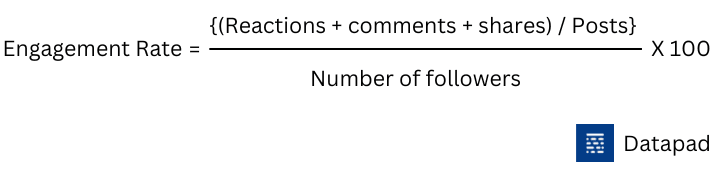
This KPI measures the rate at which your audience engages with your content. Facebook engagement is typically measured via three indicators:
-
Likes 👍
-
Share 🔂
-
Comment 💬
Why Is It Important?
The engagement rate goes a long way in building your brand reputation. It identifies how many of your followers are actually resonating with your content.
You see, following a page and liking its content are two different user behaviors. One might follow your FB page but never interact with any of your content.
From an SEO perspective, a lousy engagement rate decreases page reach. Because if people (even your followers) are not engaging with your content, algorithms have no reasons to show it to a larger audience.
KPI #5. Engagement Per Follower
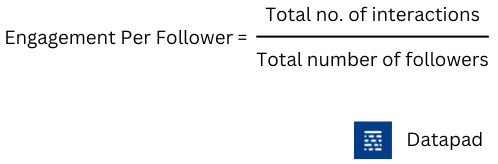
When you post on Facebook, people tend to engage with it, and calculating it can give you a boatload of insights.
Why Is It Important?
For a social page, it's important to measure engagement against the number of followers. We mean a fan page with millions of followers, yet 3-figure likes on posts aren't impressive enough.
Moreover, this KPI specifically tells you what amount of your followers are actually resonating with your content. The higher the number, the more interactive your fan page is to your followers.
KPI #6. Video Engagement Rate [VER]
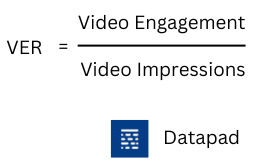
This KPI explicitly measures the percentage of impressions that lead to some form of engagement on your video content.
Why Is It Important?
Factually, video content has gained significant popularity in recent times, probably because it generates more engagement than any other content type.
Usually measured as a percentage, a low engagement rate indicates that the video is not capturing the viewer's attention or that the content is not enough to persuade viewers to engage.
The best way to visualize this KPI is via a line graph. Or, you can analyze it via Datapad simply and quickly (more on this later).
KPI #7. Share of Voice
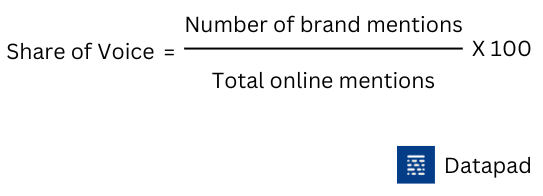
Share of voice, or the number of shares, measures the total number of times your content is shared during a given period.
Why Is It Important?
Although 'share' is counted as a measure of engagement, it has more to it. Unlike likes or comments, sharing content amplifies its reach and visibility.
Moreover, when someone shares your content with their network, people are more likely to engage with it since it comes from a promising source.
Besides promoting brand awareness, the share of voice highly impacts word-of-mouth marketing and thus is always a popular metric among social media marketers.
KPI #8. Referral Traffic
This KPI measures the number of visitors who landed on your website after clicking an inbound link from another website.
Why Is It Important?
Referral traffic from Facebook can be of great importance. Tracking this metric can help you gain meaningful insights into potential customers. You can use Google Analytics to track the amount of referral traffic from Facebook.
KPI #9. Reach by Post Type
This KPI explicitly tells you which post types are performing better on Facebook. That said, Facebook posts are of several types, namely,
-
Single post
-
Carousel
-
Text-based post
-
Videos
Why Is It Important?
Not every content format is desirable for every social platform. For example, videos on Facebook have a higher engagement rate than image posts. But you can't be sure about it; testing all kinds of posts is the best way to know what works for your account.
Hence, the reach by post type KPI can help you figure out what truly works for you and your audience. Thereby creating better content strategies to serve the need.
KPI #10. Follower Demographics
The follower demographic KPI helps you to identify who your followers are, where they are from, and what devices they use to consume your content.
Why Is It Important?
Getting to know your audience can help you define your overall channel strategies.
By breaking your follower demographics into Country, Gender, or Language, you can customize your content to their specific requirements.
Moreover, if a specific gender drives maximum engagement to your brand, you can tweak your brand tone for the same.
Enough about organic key performance indicators, let’s dive into Facebook Ads KPIs.
What are the Most Important Facebook Ads KPIs to Track?
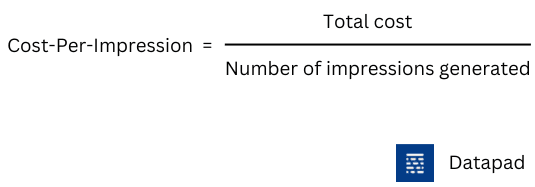
KPI #11. Ad Impressions
This KPI simply measures the number of times your ad was displayed to the audience.
Why Is It Important?
Ad impressions is a metric that shows how many times your ad was displayed on the user's Facebook feed. This becomes important for marketers who strive for better reach and visibility.
Low impressions indicate that the Facebook algorithm isn't serving your ads to people. This could be due to a number of factors like low quality-score, targeting the wrong audience, minimal budget, etc.
Measuring this KPI plays a major role in calculating key metrics such as Click-through-rate, Conversion Rate, cost-per-click, and more.
KPI #12. Click-Through-Rate (CTR)
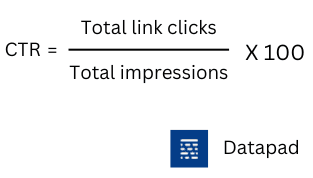
This KPI measures the percentage of users who clicked on an advertisement to the ad's total number of impressions.
Why Is It Important?
CTR is the most popular metric among advertisers and marketers.
That’s because Facebook doesn't intend to gain backlash by showing irrelevant content.
A high click-through rate is vital to your ad campaign success since it directly affects your Quality Score.
If you’re getting a low CTR, your campaign might have:
-
Unattractive ad design
-
Poor ad copy
-
Wrong audience targeting
If any of these is true, your ad CTR will be significantly impacted, and so will your quality score. For a Facebook Ad, a CTR of 1.5% is quite good.
KPI #13. Cost-Per-Click
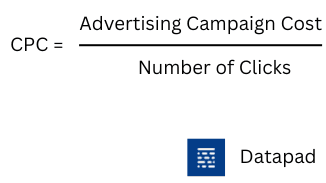
This metric measures the amount of money you pay whenever someone clicks on your advertisement on Facebook.
Why Is It Important?
CPC is the money companies pay to advertisers every time a user clicks on their ad. This amount can be whatever you like, depending on the bidding system.
Tracking this becomes important to measure your ROAS (Return on Advertisements). Although it's great if your ad is getting more clicks, at the same time, it's useless until you can convert those leads into buyers.
KPI #14. Cost Per Thousand Impressions [CPM]
Cost-per-thousand impressions, or CPM, refers to the amount you pay for your ad to get a thousand impressions.
Why Is It Important?
Although this may not be the best metric for conversion-based campaigns, it's also beneficial when running campaigns for brand awareness.
This KPI is best used for evaluating ad effectiveness and can provide valuable insights into your advertising strategies.
KPI #15. ROAS
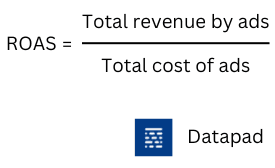
Return on Ad Spend is a marketing metric that measures the revenue generated from every dollar spent on ads.
Why Is It Important?
ROAS generally measures the conversion rate of your ads. For example, if you make $10 for every dollar spent on ads, your ROAS is 10:1.
Simply put, the basic idea behind ROAS is to get back more money than you’re spending on ads.
KPI #16. Conversion Rate
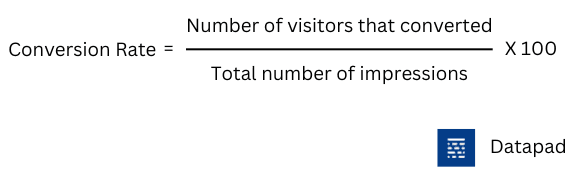
The conversion rate measures the number of people who took action after seeing your ad. The action can be as complex as enrolling for a free trial to as simple as visiting your website.
Why Is It Important?
Conversion rate is a metric used to gauge the success of an ad. Simply put, it tells you the exact percentage of visitors that convert from your ad.
A lower conversion rate indicates your ad quality needs to be improved, and you need to run A/B tests to see what's working.
KPI #17. Link Clicks
When running ads, you ought to have a CTA, and most of your CTAs will be a link either taking your audience to your website to buy something or a link to fill out a form.
Why Is It Important?
This metric tells you how engaging or compelling your ad is to your audience. Besides, keeping track of this KPI also allows you to track other primary PPC metrics such as CPC, CTR, and more.
KPI #18. Video Audience Retention
This KPI measures the time duration within which a user is engaged with the video published on the platform.
Why Is It Important?
Even though it’s a complex KPI to track, it can provide you with actionable insights. As a benchmark, a 50% video retention rate is considered good.
Besides, to calculate this metric, you can make use of Facebook insights or a reporting software.
KPI #19. Cost Per Conversion
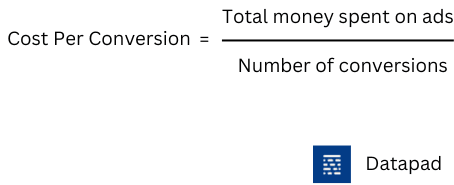
Cost per conversion, or CPC, refers to the total cost incurred in generating one conversion. It’s calculated by dividing the total money spent on advertising and marketing by the total number of conversions.
Why Is It Important?
Tracking CPC is yet another easy way to figure out how well your ad campaigns are doing.
A high cost per conversion indicates that something is wrong with your ads. It might be poorly drafted ad copy, or maybe you’re targeting the wrong audience.
In the same way, a lower CPC could mean your ads are well-optimized for your target audience; hence they convert easily.
How to Track Your Facebook KPIs For Free with Datapad?
Tracking and monitoring 19+ KPIs can be overwhelming. It might require several resources to streamline the tracking process.
But what if we say you can track, monitor, and analyze these Facebook KPIs at your fingertips?
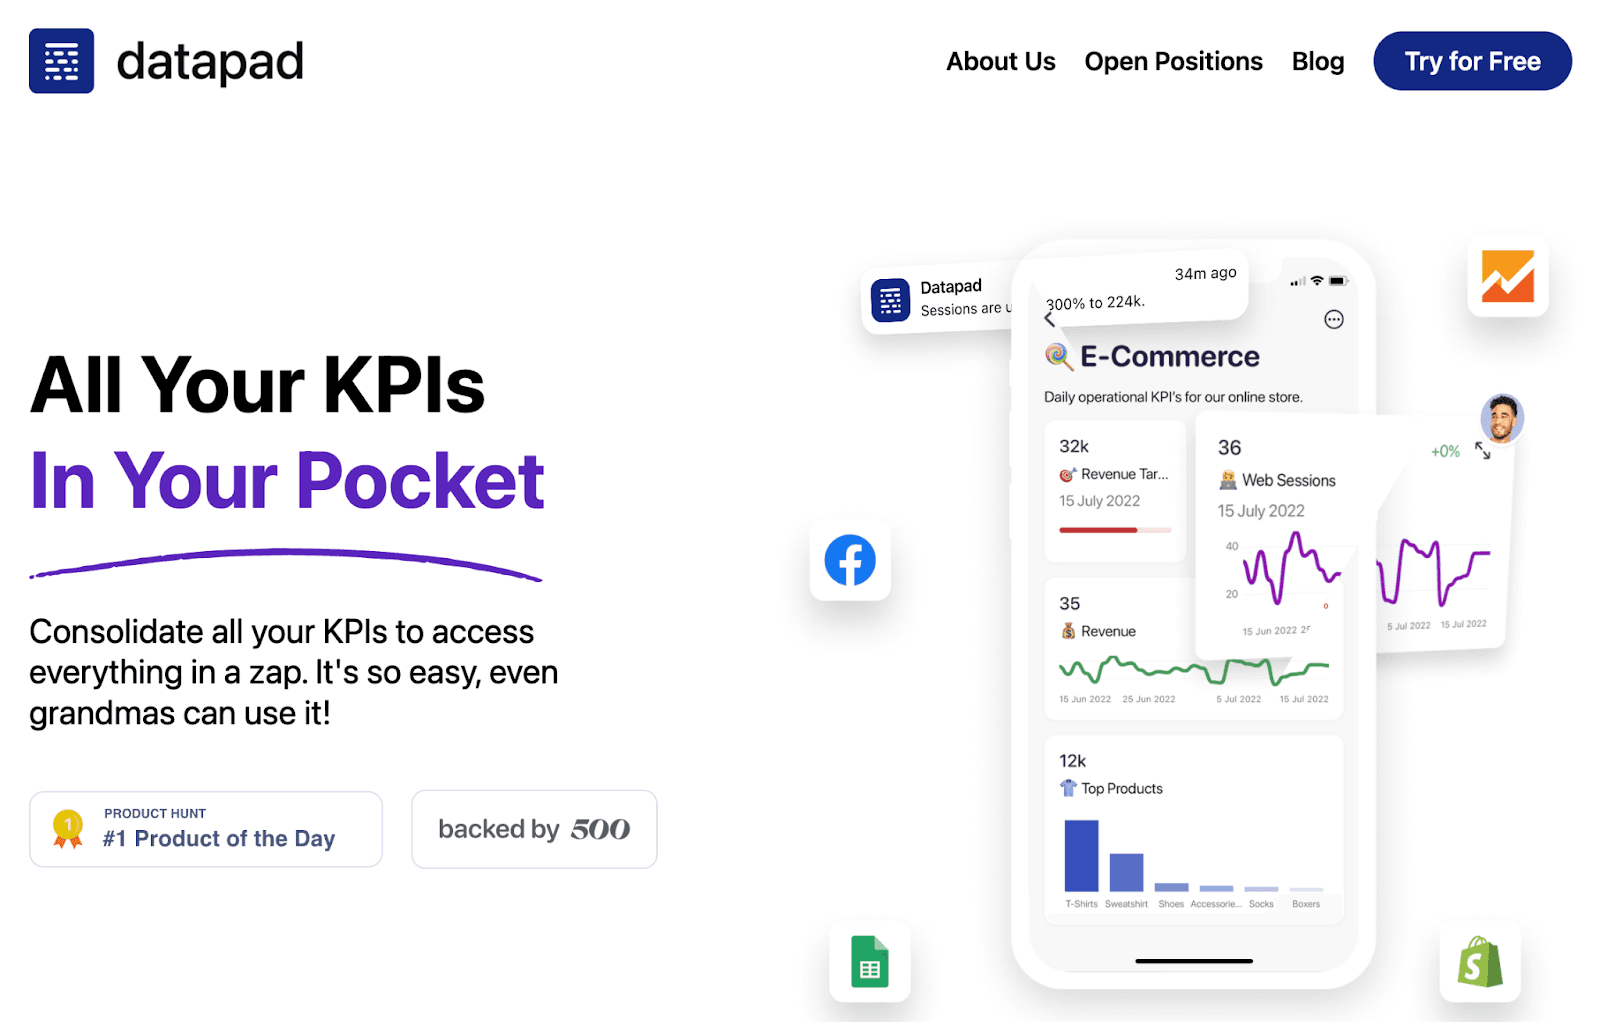
Datapad is a mobile-friendly dashboarding tool that is capable of collecting, monitoring, and visualizing Facebook KPIs from anywhere around the world – without writing a single line of code.
Our tool can create beautiful dashboards and perform all the functions of a typical desktop dashboarding tool in a power-packed mobile application.
Scan the QR Code to get the Datapad app for Free today!
