
Are you a business owner who wants to track KPIs but don't know about them? Wondering how you can track business KPIs to stay on top of things?
Everyone in the business world knows that KPIs are important. But when asked why they are important or how to get the most out of them, people often have little to no idea.
If you’re one of them, don’t worry, we’re here to clear the why and how of key performance indicators (KPIs).
This guide will cover what a KPI is, the difference between KPIs and OKRs, the types of KPIs, and many more things you should know about them before tracking them.
So let’s get started.
What is a KPI?
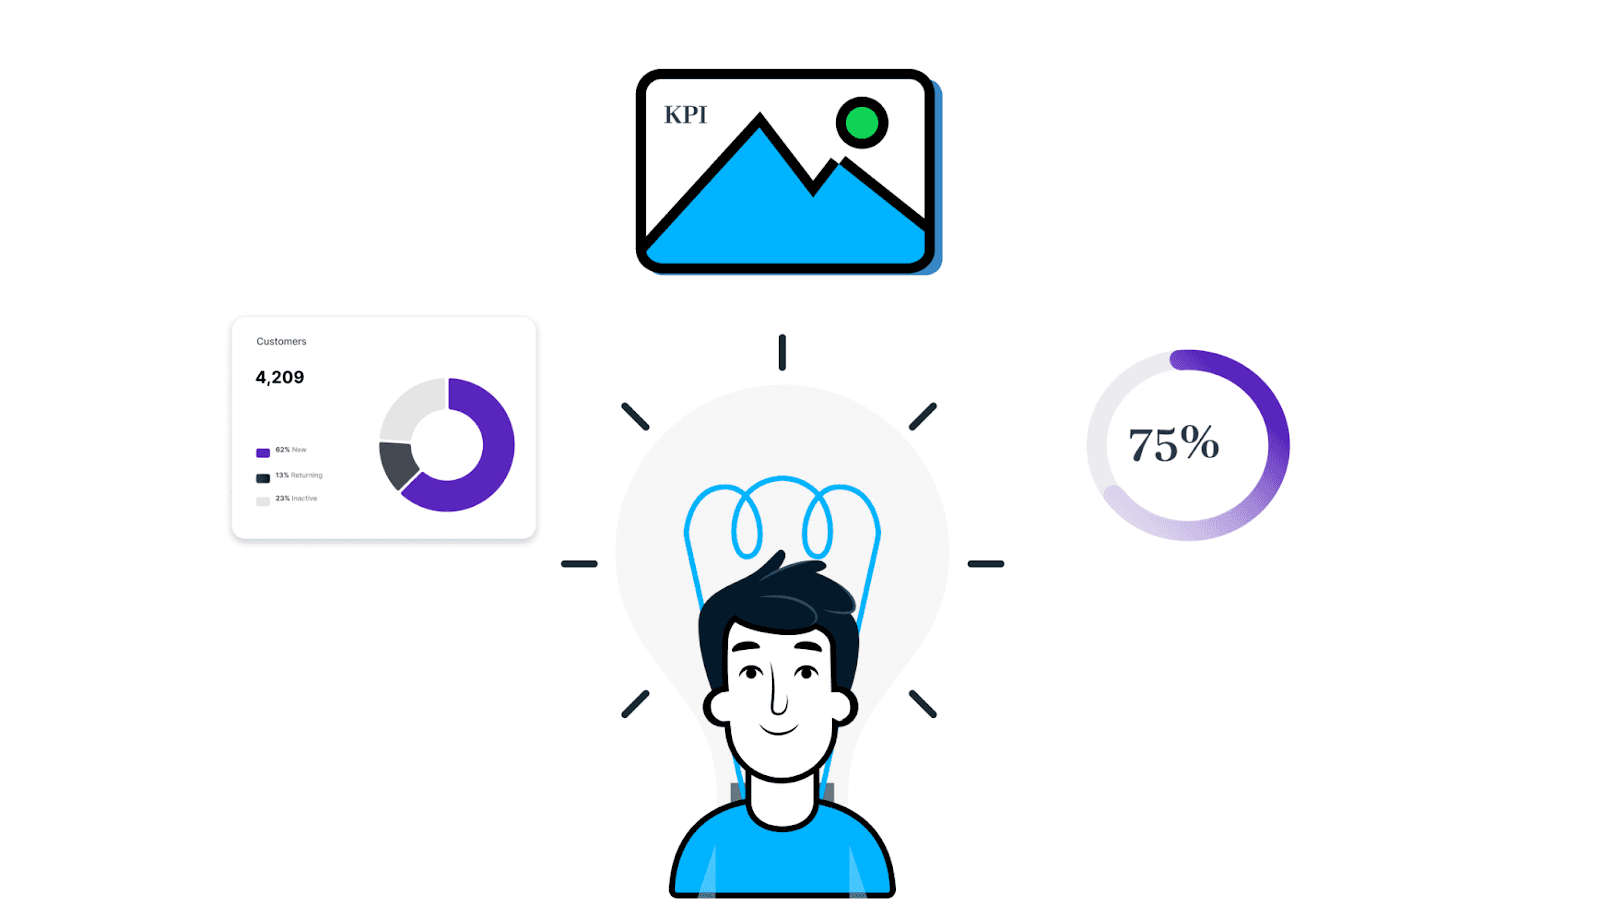
KPI (key performance indicator) is a quantifiable measure of business performance and measures how a team, project, or overall department performs.
It's measured by comparing performance against set goals and objectives. Measuring KPI isn't just a vital process for any business; it also helps potential investors decide whether to invest in your business or not.
In simple terms, KPI is a goal that you work towards achieving. For example, your goal for 2022 might be to 'Get 500 new customers for your product.'
Therefore, the KPI to track here is the ‘Number of New Customers Acquired.’
Like the example above, there are numerous KPIs that you might want to measure for different departments of your business (more on this later).
But first, let’s see why you should measure KPIs in the first place.
Why is KPI Important for Your Business?
Businesses don’t track KPIs for no reason. There are several benefits of tracking KPIs. Let’s look at the top reasons why a business would measure them.
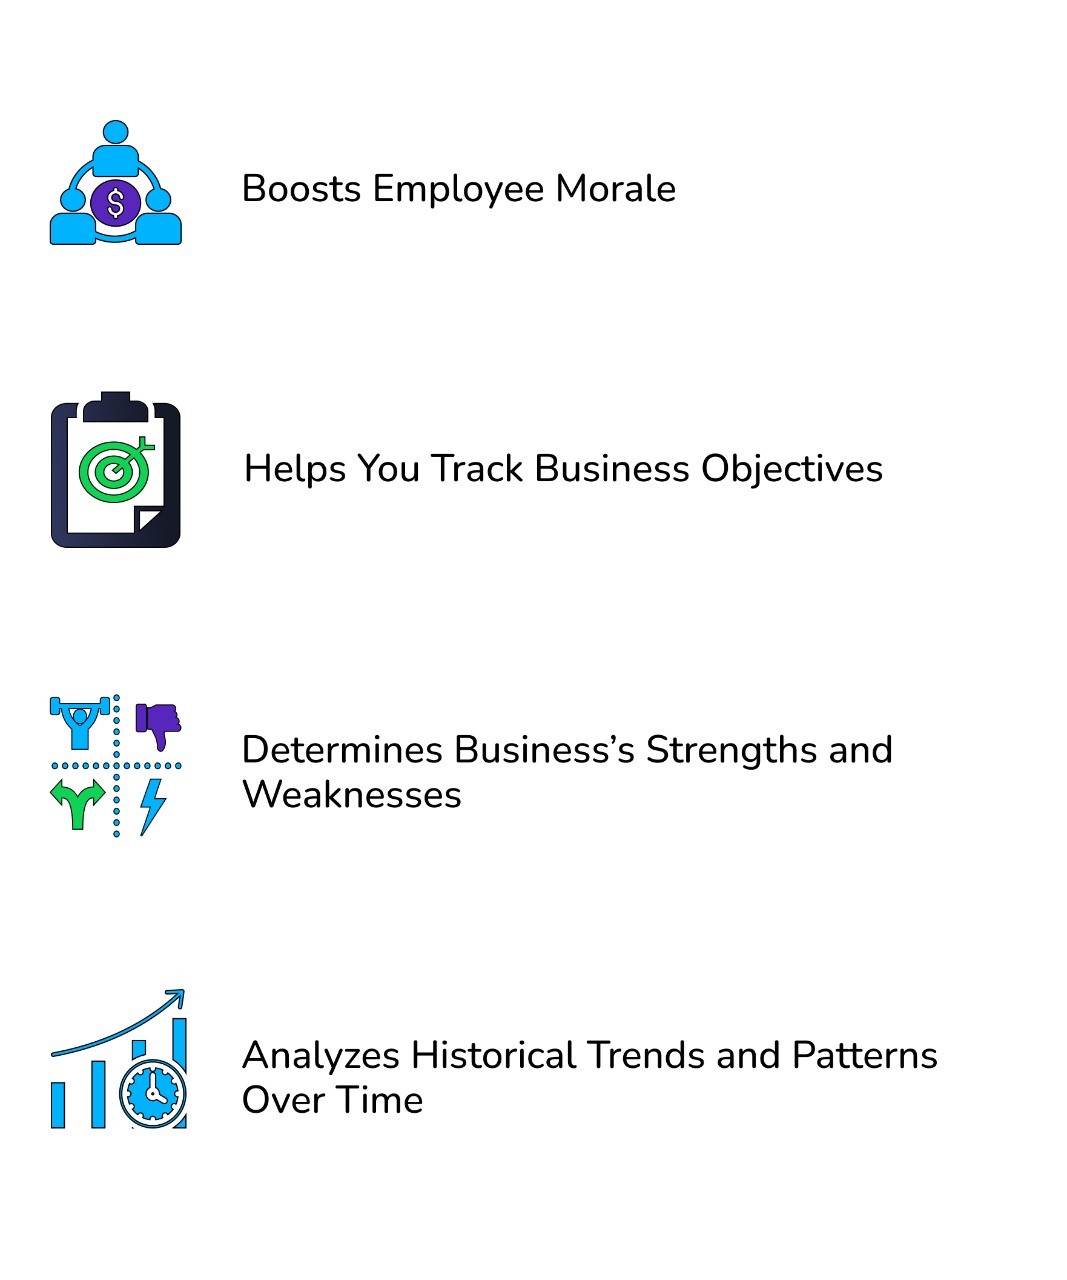
Reason #1. Boosts Employee Morale
The primary reason why a business tracks KPIs is to know about the performance of everyone in the organization.
But that’s not it!
Many companies also track KPIs along with their team to make them feel motivated.
Imagine sharing the number of sales calls every sales rep in your team booked and commending them for the same.
How happy and motivated your sales rep will be!
This also boosts employee morale and motivates them to do better next month.
To kick things up a notch, you can set milestones for your team and incentivize them upon achieving them.
Reason #2. Helps You Track Business Objectives
As mentioned in the previous point, the primary goal of tracking KPIs is to track business performance, meaning tracking business objectives.
Setting objectives, goals, and milestones for any business is crucial, and keeping track of them is even more important.
Key performance indicators help you drill down data, compare it with business objectives, and know how many objectives you set are met and which ones need to be worked on.
Reason #3. Determines Business’s Strengths and Weaknesses
Are you aware of the SWOT analysis? For those of you who aren't aware, SWOT (Strengths, Weaknesses, Opportunities, and Threats) is a technique that summarizes all major aspects of any business.
By doing a SWOT analysis on each and every KPI you track, you can know about your business’s strengths and weaknesses.
Suppose you track NPS and the average score of the survey for March comes out to be negative. This means your customers aren't getting satisfied with the product.
Here’s how you can do a SWOT analysis for NPS KPI and know about your business’s strengths and weaknesses.
-
Strength: Segregate all the promoters and see what they like about your product
-
Weaknesses: Segregate all the detractors and see what are your customer's pain points
-
Opportunities: Look for how you can improve your product features and satisfy customers
-
Threats: Look at the reviews and see if any of your customers mention a competitor's name
Doing such calculations will help you determine where to improve and put your most effort.
Reason #4. Analyzes Historical Trends and Patterns Over Time
If you have a huge database, tracking KPIs can help you analyze trends and patterns that form over time.
Every aspect of business, be it revenue, cart abandonment, or employee satisfaction, has a specific trend. When we say trend, we mean that there might be a certain pattern that a KPI might repeat after a specific time.
For example, if you have an eCommerce website that sells winter wear in the US, most of your sales might occur in the winter season, and for the rest of the year, you might see minimal sales. You will observe this every year, and it becomes a trend.
Analyzing historical trends and patterns will help you plan things well in the future and be ready for a slow or hyperfast market.
Many people confuse KPIs with OKRs, but they’re not the same. Here’s the difference between them.
KPIs vs. OKRs: What are the Differences?
KPIs and OKRs are two completely different chapters of the same book- performance measurement. While they might overlap in some places, each is set out for a unique purpose.
Let’s start with KPIs.
What are KPIs?
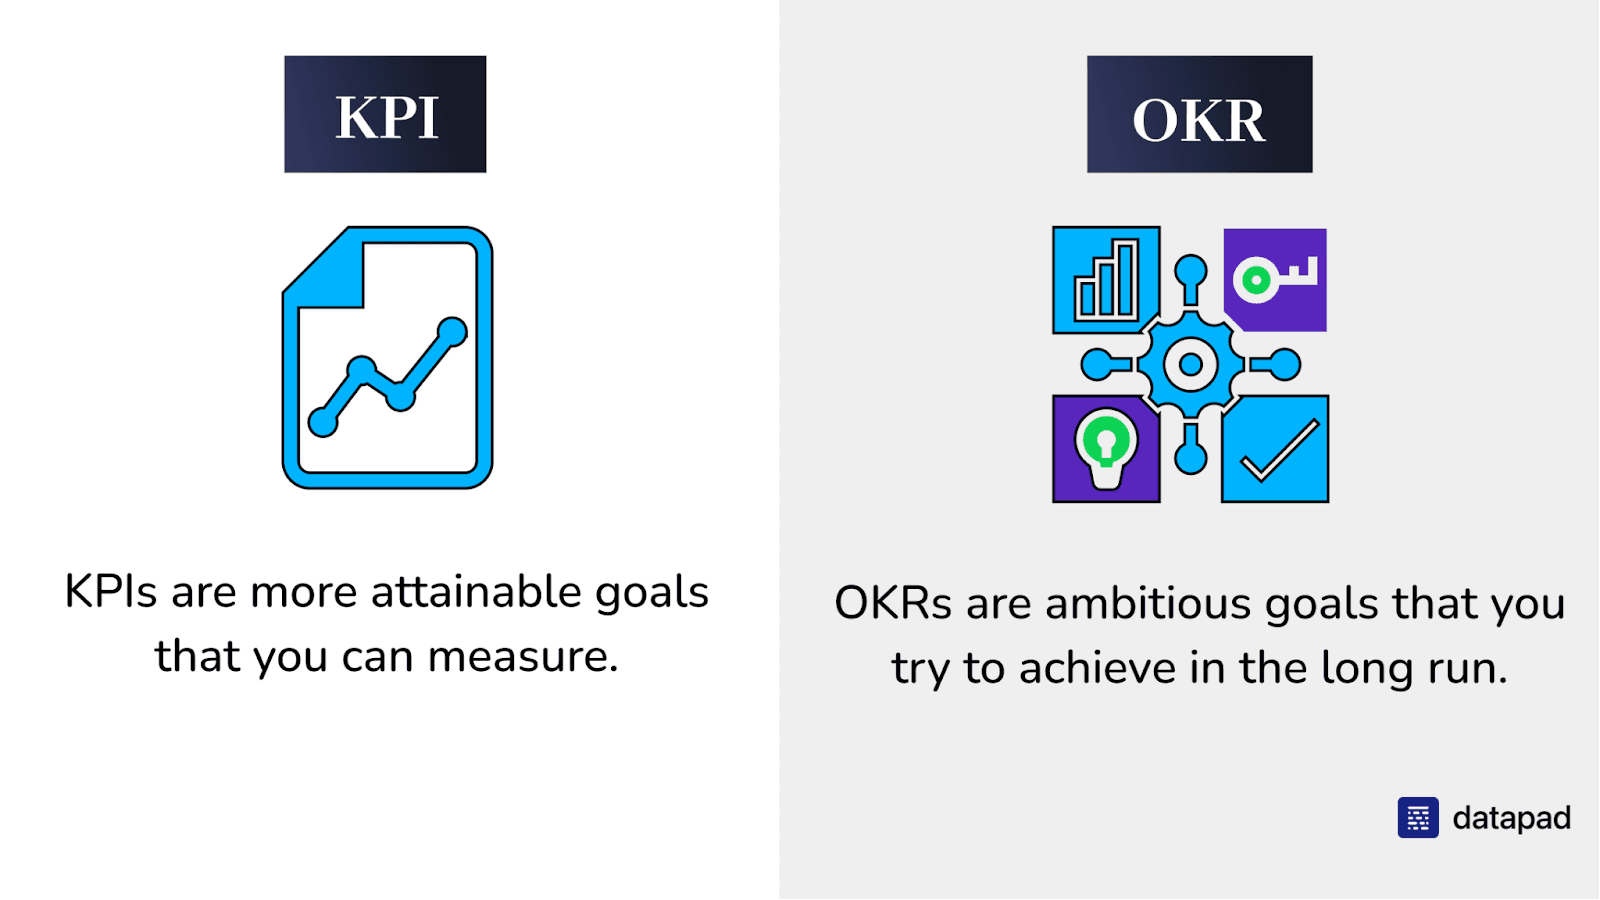
Key Performance Indicators, or KPIs, are a set of measurements used to gauge the overall performance of your business. A KPI is always set to provide numeric targets for organizational goals.
Simply put, KPIs are meant to demonstrate your business's health.
In most companies, KPIs are tracked daily, monthly, or quarterly. There are a few selective KPIs that might be tracked yearly.
KPI Example
Suppose a SaaS-based company aims to decrease its Customer Acquisition Cost (CAC) by 15% in 3 months. This sounds like a SMART goal; it's specific, measurable, achievable, relevant, and time-bound.
Therefore, the KPI to track here is customer acquisition cost (CAC).
Tracking this KPI monthly can help you identify what strategies are working and which aren’t. Moreover, you get access to crucial insights such as:
-
Prominent sources of acquiring customers
-
Performance of marketing campaigns
-
Close rate of sales calls
-
Cost per lead
And much more.
Adding quantifiable measurements makes your hefty data easily understandable and effectively comparable with whatever you measure.
What are OKRs?
Objectives and Key Results (OKRs) are metrics that align company or team 'objectives' alongside 'key results.' Unlike key performance indicators that are generally steady, OKRs are aggressive, bold, and reserved for big-picture goals.
If we put out a one-liner - OKR is a strategic framework within which KPIs act as a set of measurements.
Typically, OKRs reflect areas of improvement (strategic objectives) for your business. It measures 'key results' that track the impact of changes and modifications made by your team on the set KPI targets.
OKR Example
Marketing Team OKRs
Objective: Increase brand recognition and awareness
Key Results
KR#1: Launch customer referral program by 1st December
KR#2: Increase the number of content shares on Instagram from 20 to 80
KR#3: Leverage UGC (User-generated content) for better word-of-mouth marketing
KR#4: Increase click-through rate by 30% by Q4
Let's get to the bottom line here.
KPIs and OKRs are bound towards attaining organizational goals, but a thin line differentiates them during the action.
Key Performance Indicators
Objectives and Key Results
Purpose
Measure progress and business health
A goal-setting methodology that lets you set and measure goals
Scope
Identifies leading and lagging indicators (compare past performance to reflect future goals)
Future-focused and directional
Nature
Steady-state; act as benchmark for day-to-day operations
Aggressive and bold; directed towards achieving the impossible
Time-Frame
Measured monthly, quarterly or yearly
Measured on an ongoing basis
11 Types of KPIs You Should Be Aware of
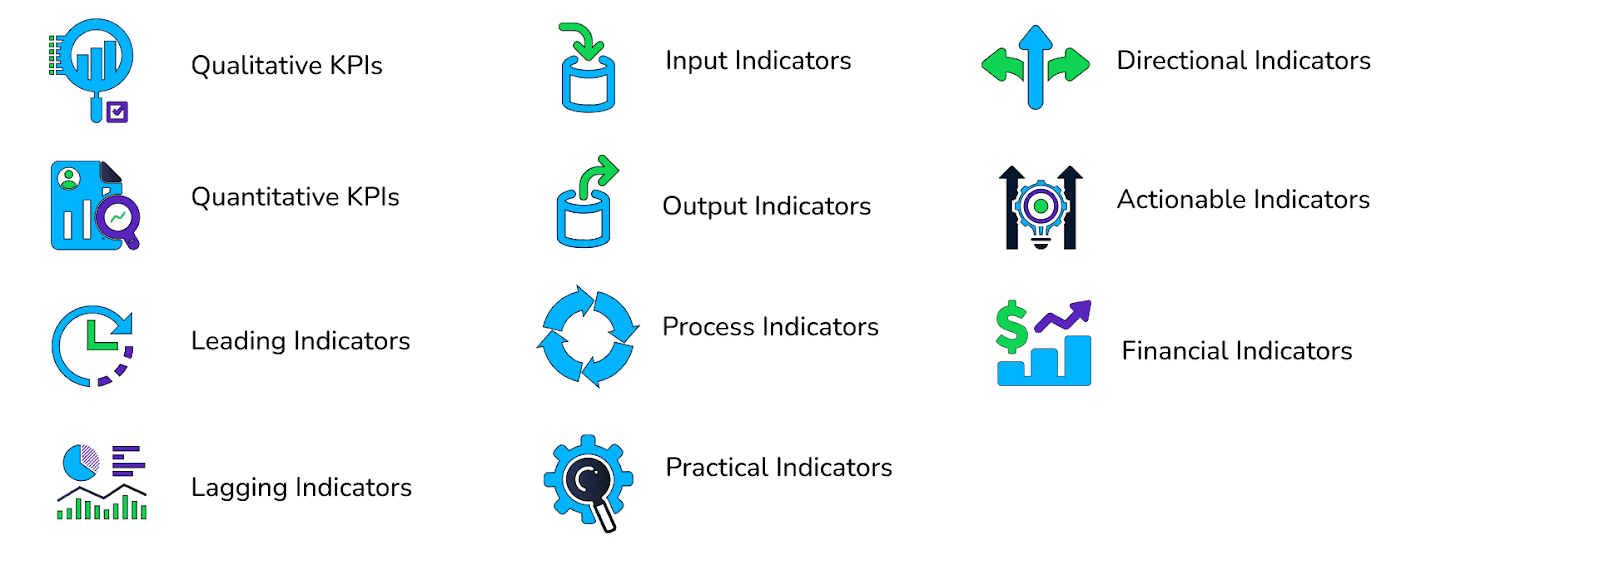
#1. Quantitative KPIs
As the name suggests, quantitative KPIs are the types you can measure. They have a specific formula to calculate, and the result is either a number, fraction, percentage, or ratio.
Examples: Monthly revenue, cart abandonment rate, monthly email signups.
#2. Qualitative KPIs
Unlike quantitative KPIs, you don’t get a measurable number when you track a qualitative KPI. Your results might be a graph or in text form.
By tracking qualitative KPIs, you could know if it has a positive or negative impact on your business, but you can't know exactly how much impact it has.
Examples: Customer reviews, survey results, etc.
#3. Leading Indicators
Businesses track leading KPIs or indicators to know about future trends and forecasting. These KPIs help you and your business draw a long-term road map for the company. Leading indicators can be any long-term goal you have in mind.
Examples: Improve your app’s experience, decrease website bounce rate, etc.
#4. Lagging Indicators
Lagging indicators is something you can only know after a certain business process is completed.
Unlike leading indicators, you can't predict or calculate the outcome for lagging KPIs. But with these, you can surely decipher a pattern that's occurring over time.
For example, if the unemployment rate in your company has been increasing for the past 3 months, there are high chances it will increase in the 4th month as well.
#5. Input Indicators
Every business has multiple processes running, and for every process, you need resources. Input indicators are those resources that go into each project so that you get the intended outcome.
Example: Your sales team is an input indicator to sell your product.
#6. Output Indicators
Output indicators are the exact opposite of input indicators. These indicators reflect the final result of the KPI you might be calculating. With output indicators, you come to know if a specific business process is a success or not.
Examples: Monthly recurring revenue, number of customers acquired, customer acquisition cost, etc.
#7. Process Indicators
A business tracks process indicators to gauge the overall performance of a process. And if the process doesn’t perform as expected, these indicators can help you fix it as well.
Examples: KPIs like support tickets raised, tickets resolved, response time etc., are the process indicators for your business's customer service department.
#8. Practical Indicators
Practical indicators are the ones you can leverage to know about the specificity of any project or business process when it's still running. With practical indicators, you can predict how the process will end and if the outcome will be favorable or not.
These indicators vary with the type of process a business runs.
For example, a business that runs PPC campaigns might see CAC or CTR as practical indicators.
#9. Directional Indicators
Directional indicators help you gauge your company’s performance against set benchmarks or competitors. You can also use them to spot, analyze, and rectify trends.
Example: One directional indicator that most companies use is time on site. It's the time your company's developer or technical assistant spends fixing bugs and troubleshooting problems for your client on-site. An increased time on site is often considered bad for a business.
#10. Actionable Indicators
Actionable indicators are the set of KPIs that come into the picture after all the processes you're running for your business have ended, and it's now time to optimize them.
Meaning these indicators help you optimize business processes, thus increasing business performance.
#11. Financial Indicators
As the name suggests, financial indicators show where your business finances are at. In layman's terms, these indicators show your business's financial performance.
When clubbed with other KPIs, financial indicators bring out the bigger picture and show you where your business is overspending or underspending.
What are the 5 Main KPIs to Track?
#1. For Business Owners
If you’re a business owner, you might often fall short on time and prefer tracking KPIs that heavily impact your business operations.
These KPIs will use the most resources of your company but, at the same time, deliver the most impactful results.
Some of the KPIs that a business owner must track are:
-
Gross Profit Margin: The amount of money left after paying the cost of goods sold, manufacturing costs, worker costs, and all other expenses
-
Revenue Growth Rate: The rate at which your company’s revenue is growing
-
Inventory Turnover Rate: Number of units sold in a given period of time
-
Customer Retention: The number of customers who bought from your repeatedly in a set period of time
-
Quick Ratio: The ability of your company to pay off debts with cash or near-cash assets you have right now
#2. For Marketers

Your marketing team is responsible for bringing the product to market and promoting it to spread brand awareness.
It's the marketing department of your company that will have several processes running for multiple marketing channels simultaneously. So tracking KPIs for every channel is crucial.
The KPIs marketers should track will depend on the type of processes the team runs, but here are the most significant marketing KPIs:
-
Cost Per Acquisition: The total marketing spend to get a new customer
-
Customer Lifetime Value: The total money spent by a customer in their lifetime on your website
-
Return On Investment (Marketing): The ratio between the revenue generated and the amount spent on marketing campaigns
-
Traffic-to-Lead Ratio: The number of visitors that converted into a hot or cold lead over a period of time
-
Lead-to-Customer Ratio: Total number of qualified leads that the marketing team successfully converted into customers
#3. For Finance

Finance is all about numbers, so the finance team should track KPIs that measure growth and tell you if your business is making a profit or loss.
Pro Tip: For every process you run in your business, be it in any department, try keeping your finance team in the loop.
Here are some KPIs that a finance team can track:
-
Operating Cash Flow: The total amount of money generated by your business’s daily operations
-
Burn Rate: The speed at which the company is spending money
-
Net Profit Margin: Amount of money your company receives as profit after selling the product
-
Working Capital: Total money the business has to meet its short-term goals and obligations
-
Budget Variance: Shows you how projected budgets compare to actual budgets
#4. For Operations
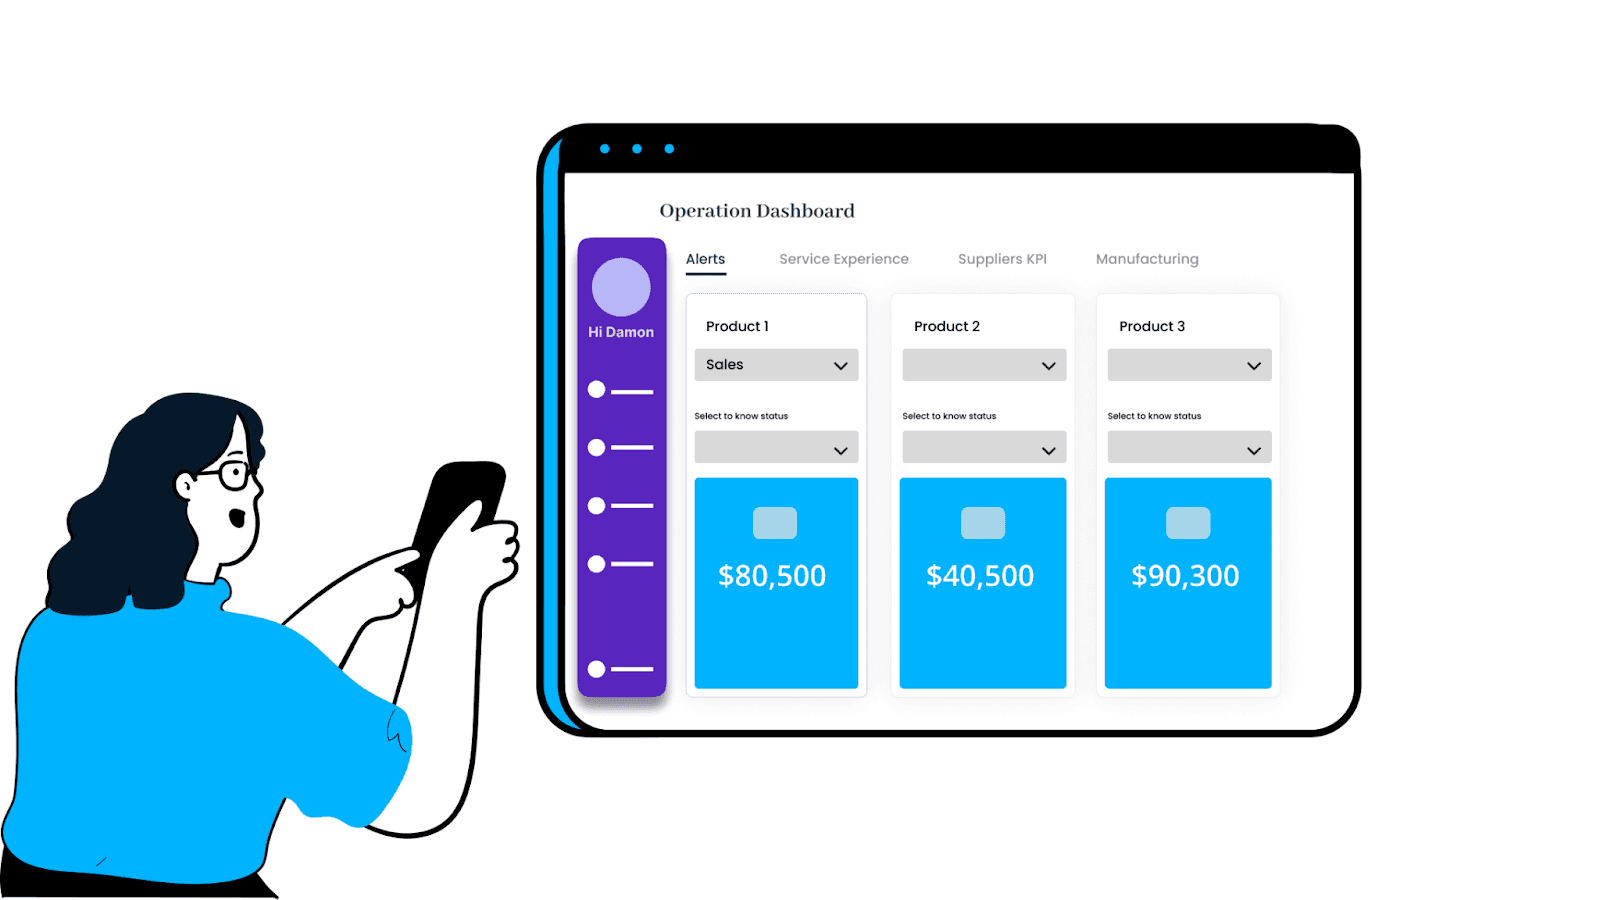
Operation KPIs are a broader niche of metrics that your chief operating officer or you as a CEO can track and know how every process in your business is performing in real time. Tracking KPIs for operations becomes vital for decision-making.
Here are some KPIs that your COO or you as a CEO can take initiative to track:
-
Cash Conversion Cycle: The time taken for a business to convert its inventory into cash
-
Throughput: A manufacturing operations KPI that tells you about the capability of your plant to produce new products
-
Click-Through Rate: A marketing operations KPI that gives you the ratio of impressions to click on any of your campaigns
-
Sales Cycle Length: A sales operation KPI that gives you the average time taken to close one deal with a customer
-
Absenteeism Rate: A human resource operation KPI that tells you about the number of days an employee didn’t work in a month or year
3 KPI Examples
KPI #1. Gross Profit Margin
Gross profit margin measures the profit earned from the sale of goods and services after deducting the cost of goods sold.
The two main factors determining gross profit are revenue and COGS (cost of goods sold).
Why Is It Important?
Down the lane, it's better to know whether your product is profitable or not - and gross profit tells you exactly this.
This KPI signals whether your sales and production processes are running efficiently. A low gross profit indicates that you’re incurring higher COGS. This means you must work through the production and operational processes to cut costs.
Here's the defined formula to calculate the gross profit margin:
GPM = [(Total revenue - COGS) / Total revenue] X 100
KPI #2. Customer Retention Rate
Customer Retention Rate (CRR) refers to the number of customers who repeat purchases from your business over a specific time period.
Why Is It Important?
Retaining existing customers is economical in all ways because:
-
Acquiring a new customer is 5X costlier
-
Existing customers comparably spend more on your store or website
-
Building a loyal customer base is good for referral sales
A higher CRR is a prolific indicator of customer-centric culture and policies. Besides, a happy customer is always a promoter of your business.
Here's how you can measure your customer retention rate:
CRR = [(E-N)/S] X 100
Where,
E = Customer at the end of the period
N = New customers added during the period
S = Customers at the start of the period
KPI #3. Customer Satisfaction Score (CSAT)
Customers are the whole and soul of your business, and you ought to ensure their happiness.
This KPI is popularly used by businesses to measure the satisfaction level of customers after interacting with their products or services.
Why Is It Important?
Undoubtedly, successful brands like Amazon and Apple prioritize customer experience over anything else. And it's nothing you can’t do as well.
You can share feedback forms or surveys with customers to measure your customer satisfaction score.
These surveys have a scale from 0 to 5, or, even better, they include three options, namely 'Very Satisfied' (4-5), 'Satisfied' (3), and 'Not Satisfied (0-2).
Now, to calculate CSAT, take the data of customers who voted 4 & 5 and place it in the below formula:
CSAT = Number of 4 & 5 respondents / Total no. of respondents X 100
Read more: KPI Examples: Here Are the Best 30 You Can Find in 2022
How Can You Use KPIs in Your Business?
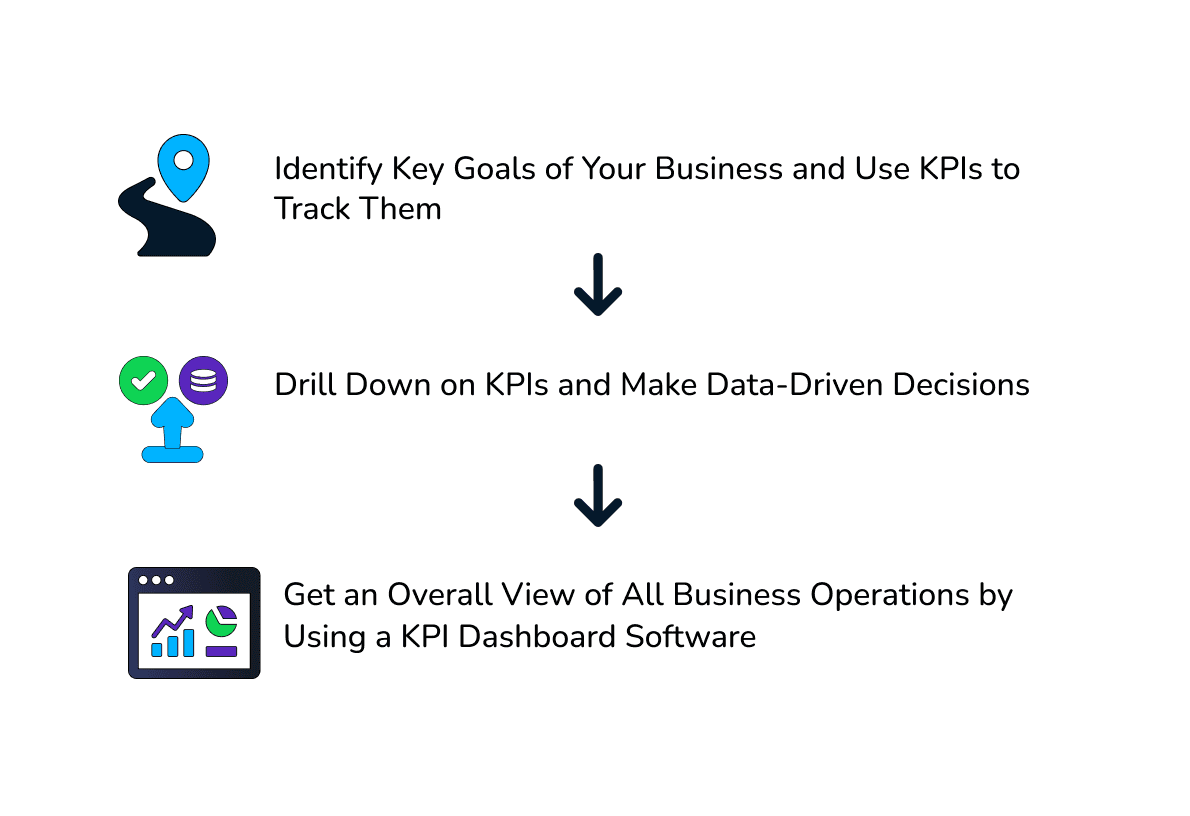
Step #1. Identify Key Goals of Your Business and Use KPIs to Track Them
The first and foremost thing to do in a business is to list down your short and long-term goals.
Setting strategic goals for marketing, sales, finance, etc. helps you keep track of things and stay on top of your business. But tracking business goals isn’t possible without tracking KPIs.
Therefore, for every attainable goal you set, have at least one KPI you can track and know how close you are to achieving the set goal.
For example, if your goal is to ‘Get 100 new sign-ups in November,’ the ideal KPI to track here is the ‘number of sign-ups.’ Other supporting KPIs might be conversion rate, bounce rate, CAC, and many more.
Step #2. Get an Overall View of All Business Operations by Using a KPI Dashboard Software
In the last point, we said to set specific goals and track relevant KPIs. But how will you track these KPIs?
You can’t just manage everything on Google Sheets. It might work initially, but when you have a larger customer base and a lot of processes going on, tracking KPIs on Google Sheets will become a nightmare.
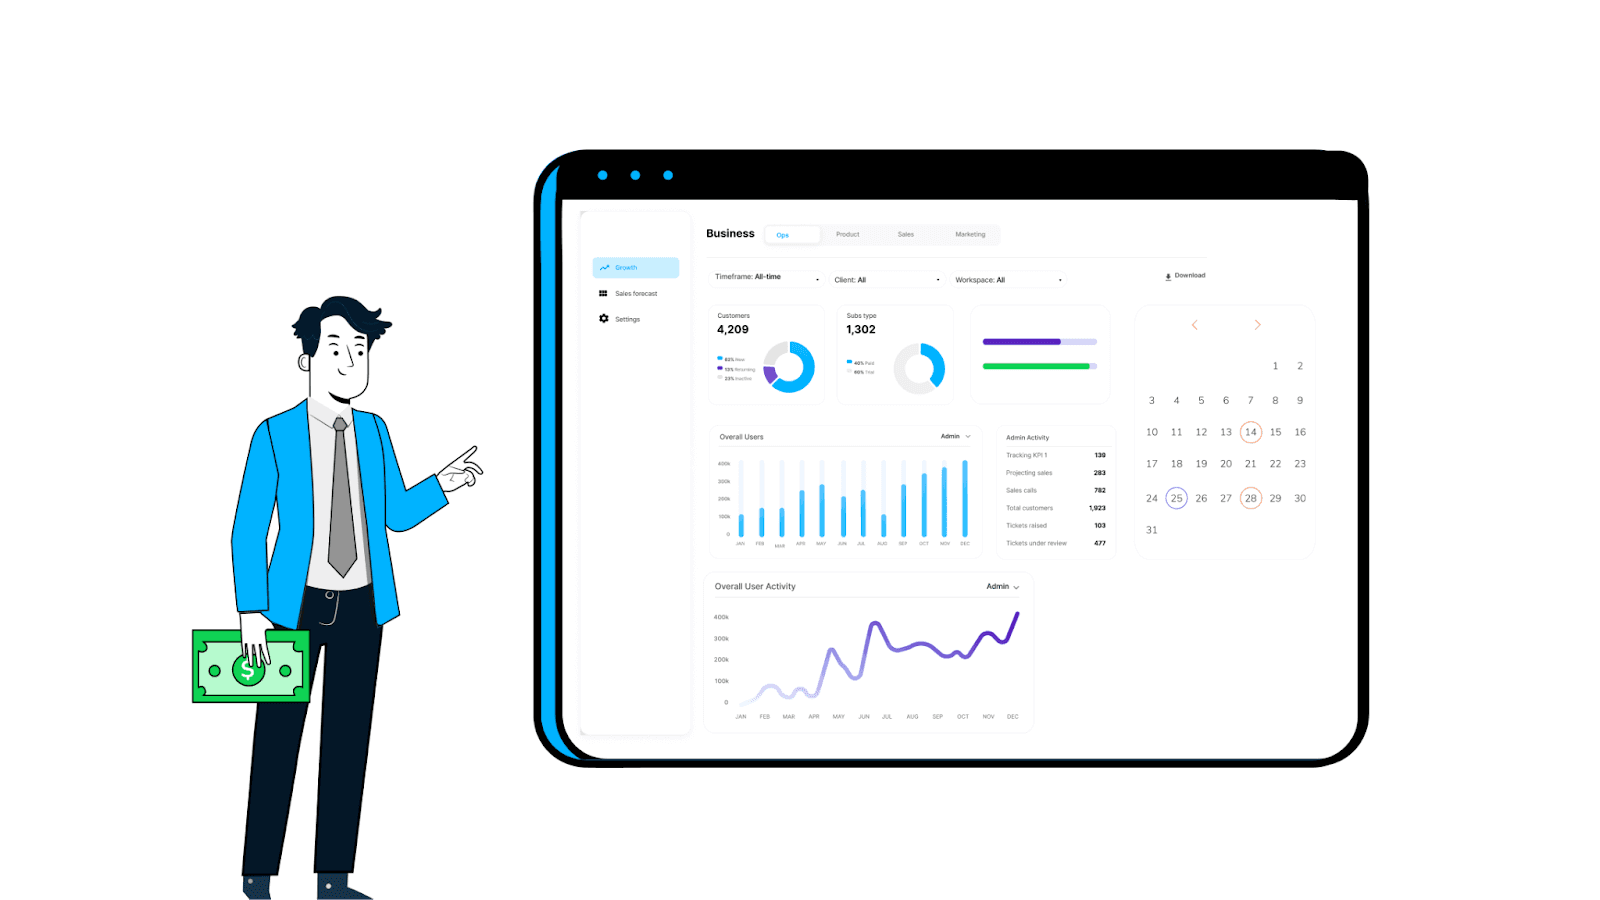
Instead, use a KPI dashboard software like Datapad to track KPIs on the go.
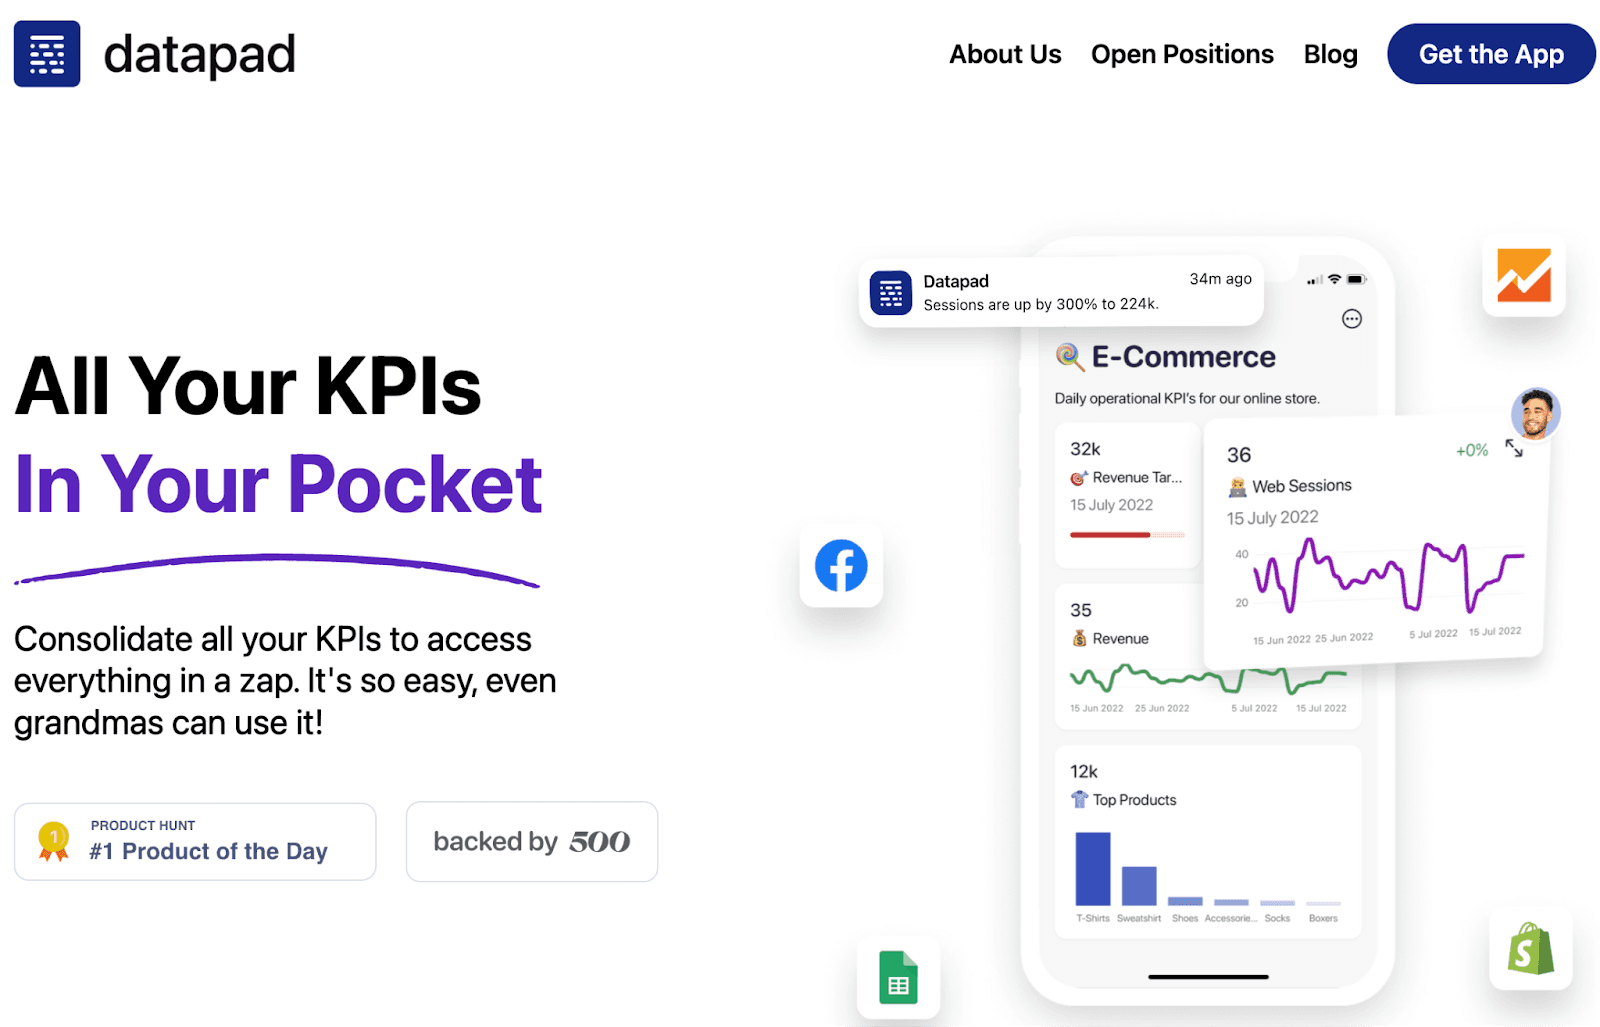
With dashboarding software like Datapad, you can create dashboards in seconds, import data automatically or manually, and track KPIs from your mobile phone.
Along with this, you can do so much with Datapad:
-
Bring your team onboard by sending them email invites
-
Communicate with your team via the live comment section below every KPI
-
Assign every team member a KPI and set goals for them
-
Search KPIs via Datapad’s search bar feature
-
Import data from popular data sources with our 1-click integrations
-
Customize your dashboards to match your brand’s color scheme
And the list goes on…
Note: Datapad is meant for business owners who're short on time and want to glance at the KPIs quickly. It's not an ideal dashboarding software for drilling down on data.
Step #3. Drill Down on KPIs and Make Data-Driven Decisions
Where Datapad helps business owners and managers get a quick glance at business KPIs, some software like Tableau, Metabase, Redash, etc. helps your team drill down on data and get in-depth insights about a specific KPI.
It's important for your team to understand the reason behind the under or overperformance of a KPI they track.
That’s because if they don’t know the reason, they might not be able to optimize the processes they run to make your business profitable.
5 Things to Avoid When Setting Up Your KPIs
-
📏 Don't Measure Everything You See: A common mistake entrepreneurs make is to measure every data they hold. It's wiser to plan your long-term objectives and growth ambitions and then create a mix of KPIs aligned with your goals.
-
📊 Don't Rely On Industry Benchmarks: There's a treasure trove of industry and team-specific metrics on the web. Although it's great for inspiration, use them only to orientate yourself and then set achievable targets from your business perspective.
-
😓 Lack of Accountability: KPIs need consistent monitoring and analysis to be effective, and thus, accountability for it shouldn't be a grey area. Make sure you keep someone who performs all the actions related to tracking, monitoring, and analyzing KPIs.
-
💵 Luring Financial Incentives to KPIs: Adding incentives to completing a goal or objective can harm your business. When you include rewards with KPIs, employees tend to alter information or data to get rewarded. So, it's better to set realistic and achievable goals that employees would want to achieve without any bonuses on their heads.
-
❌ Not Acting On Insights: In today's time-sensitive market, insights generated from KPIs shouldn't have any red tape. Instead, make sure the insights are discussed and worked upon in every meeting with employees and stakeholders.