
Rome was not built in a day, and the same goes for your business.
A successful business is the outcome of restless days, tracking and analyzing the five pillars of your business - finance, marketing, sales, manufacturing, and staffing.
However, measuring every operational kpis, going around in different departments can be an overwhelming process.
And so, in this article, we will walk you through the key performance indicators in operations. We’ll also discuss the 15 most important KPIs one should measure to streamline daily business operations.
Let’s dive in!
What Are Operational KPIs?
Operational KPIs are KPIs or metrics in operations are quantifiable measurements used by business owners to gauge the performance and efficiency of their day-to-day operations.
If you're among those companies who track their daily operations by the number of trucks that went in and out or counted the number of employees milling around, you are lagging far behind your competitors.
Progressive companies use operations KPIs to track and analyze their day-to-day working efficiency. From production to sales, marketing, and HR - operation KPIs measure the performance of each department on a daily basis.
Benefits of Tracking KPIs in Operation
The best thing about tracking KPIs in operation is that you get real-time data. You’re aware of how core operations are functioning as they happen.
This becomes vital in time-sensitive situations where prompt decision-making is required.
Suppose, we say, the trajectory for a manufacturing operation KPI is projecting negative trends, you can instantly dig deeper into the problem and prevent your business from any downtime.
Likewise, if the operational metric is positive, operations managers can do more of what works best for the organization.
To ease your trouble, we have already researched and listed the most important metrics to track in multiple operations in a business.
15 Best Operational Metrics That Every Business Must Measure
We interviewed experts to give you the most important metrics to track for your business.In this section we are going to give KPI examples for operations that you should be tracking in 2023.
#1. Finance Operations KPIs
KPI #1. Working Capital
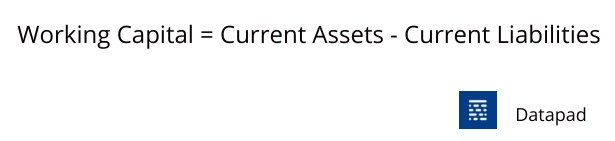
Working capital is the sum of dollars remaining with a company after subtracting its current assets from current liabilities.
Your assets include your on-hand cash, accounts receivable, inventory, etc.
While your current liabilities are all that you owe to pay within the financial year, such as bank operating credit, loans, taxes, and other expenses due.
Why Is It Important?
In simpler terms, working capital means immediately available cash.
When it comes to day-to-day operations, you need some capital in hand to operate – money that can be put to work at the moment.
This KPI is all about measuring your business’s financial health to fulfill short-term financial obligations.
Besides, it can also help financial managers decide how aggressive a company should be in pursuing growth opportunities.
Here’s the formula to calculate working capital:
Note: High working capital results from two reasons, either your company is performing efficiently well, or it’s not investing the excess cash.
KPI #2. Net Profit Margin
If you’ve watched Shark Tank, you might’ve heard of net profit margin or gross profit margin almost in every entrepreneur’s pitch.
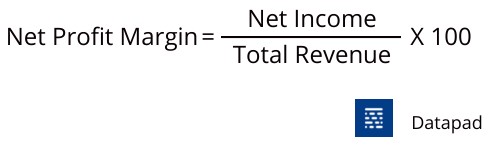
The net profit margin is the profit made by a business after subtracting all operating expenses (including depreciation and taxes) from the total revenue.
Why Is It Important?
As we said, this KPI is directly related to your business's financial health. It shows how efficient a company is in turning revenue into profits.
The net profit margin reflects the profitability of a company. At the end of the day, this is what matters to a CFO. Besides, the KPIs also help you track your company’s status quo among its competitors.
In most cases, net profit is calculated as a percentage, the higher the net profit, the more profitable your business stays. Plus, a surplus net profit also shows how fast your business can grow in the long term.
Here’s a simple formula to calculate net profit:
KPI #3. Cash Conversion Cycle [CCC]
The cash conversion cycle is the amount of time it takes for a company to convert its inventory into cash.
It takes into account both the time it takes to sell inventory, and the time it takes to collect payment from customers.
Track this operation KPI if you want to know more about your business’s cash flow.
Why Is It Important?
CFOs would always want to see the CCC remain stagnant or decrease over time. This is because the longer it would take to convert goods into cash, the longer it might take you to clear out your liabilities.
Basically, a higher CCC will impact your inventory purchasing power, working capital, and day-to-day operations.
Here’s how you can measure your Cash Conversion Cycle (CCC):
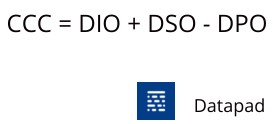
Here,
DIO means days of inventory outstanding
DSO refers to days Sales Outstanding
And DPO refers to the days payables outstanding.
CCC is generally measured in days, and if the number of days starts increasing, an in-depth analysis should be made to screw in the weaker points.
However, the cash conversion cycle differs across industries based on the nature of business operations, so there's no defined strategy to ace this KPI.
#2. Manufacturing Operations KPIs
KPI #4. Throughput
Throughput is a crucial manufacturing KPI as it measures the capability of your manufacturing plant to produce the number of goods in a certain period.
Why Is It Important?
Throughput measures the production capability of your machines, product line, or plant in real time. Thereby helping production managers get insights into the day-to-day production line functioning and optimum utilization of machinery.
Manufacturing and production lines are time-sensitive processes. A lazy downtime or breakdown can disfigure your overall operations. Hence, a manufacturing head always stays tuned to the overall throughput rate.
A constant decrease in throughput rate means your production line is facing an issue. For the most part, you can increase it by reducing machine downtime, replacing the human touch with automation, or reducing short-stops.
Here’s a quick formula to calculate Throughput:
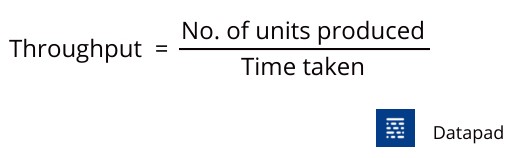
To calculate the Throughput Rate, simply multiply the above result by 100.
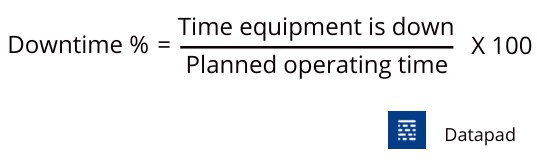
KPI #5. Machine Downtime Rate
Machine downtime rate refers to the rate at which the manufacturing equipment is suffering from planned or unplanned stops. This may be due to scheduled maintenance drives or sudden equipment failures (or malfunctioning).
Why Is It Important?
An hour of machine downtime can cost a company an average of $260,000. But besides the monetary losses, you must also count on the lost time and productivity.
So, as a whole, an hour of downtime can cost you more than a lost sale.
To reduce machine downtime rate, make sure of these three things:
-
Establish failures codes for the machine's so that workers are aware of the issue before the machine stops working
-
Perform preventive maintenance like regular checkups and servicing
-
Conduct daily inspection of machines before starting the production unit to ensure machines are lubricated and good to function
The formula for calculating machine downtime is pretty straightforward:
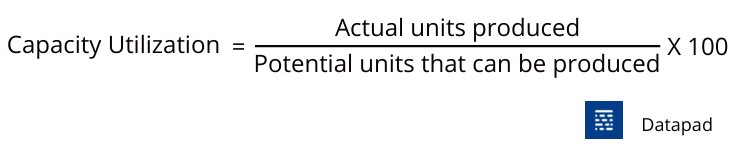
KPI #6. Capacity Utilization
As the term suggests, capacity utilization is the measure of how efficiently the production capacity is utilized when compared with the optimum utilization.
Why Is It Important?
After having spent $$$ on high-end machinery, you don’t want to keep them idle.
The point is to maximize the capacity utilization so that your machines work at an ideal cycle time. And when they do, they’re said to be working at 100% capacity.
This KPI also gives a snapshot of the maximum order quantity that your production line can fulfill when utilizing its resources at the optimum level.
Thereby allowing production managers to make data-driven decisions on the orders to be taken and the delivery time to be provided - for transparency in the organization.
The higher the percentage, the greater the chances to scale up your operations in the long-term and vice versa.
#3. Marketing Operations KPIs
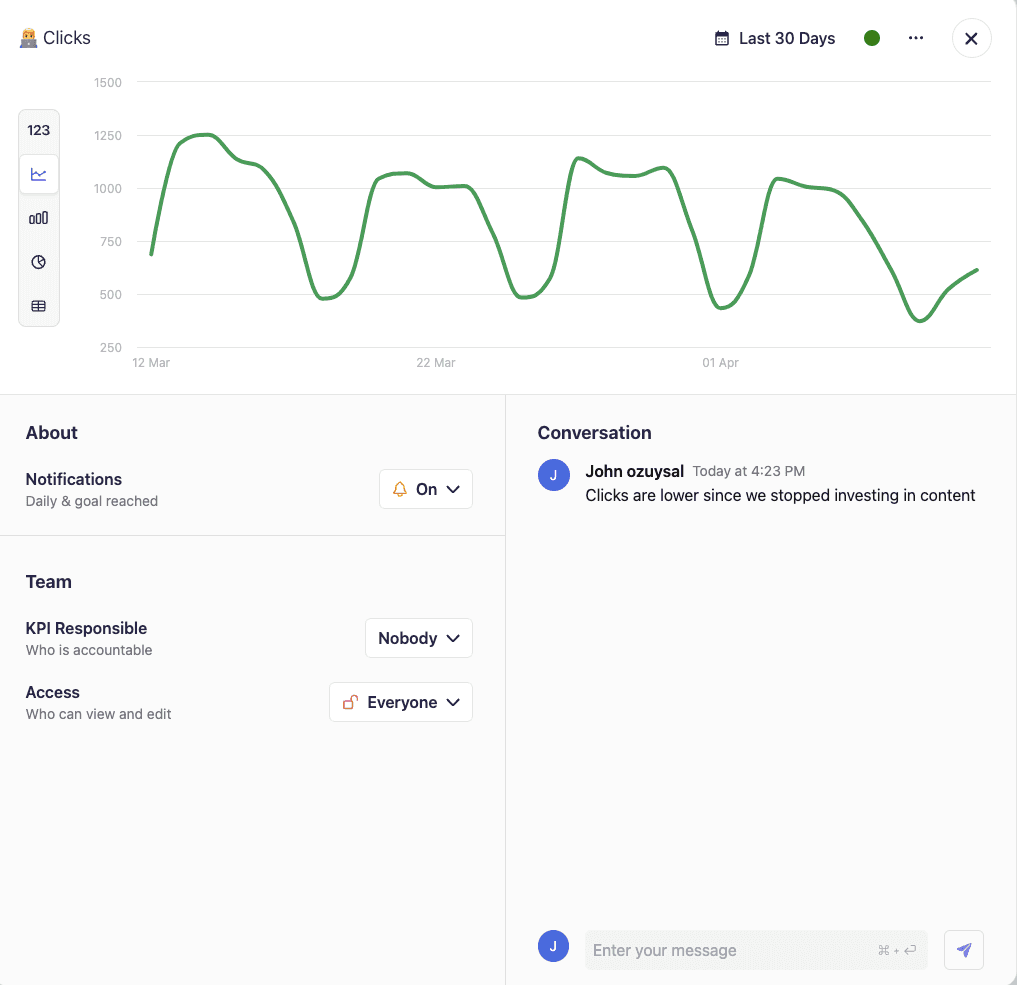
KPI #7. Click-Through Rate [CTR]
The click-through rate is a business performance metric that reveals the number of clicks your ad receives vs. the number of impressions it gets (used to track social media posts, website traffic, etc.).
Simply put, this KPI measures the percentage of impressions that resulted in a click.
Why Is It Important?
Marketing professionals use this key metric to get a better understanding of a company’s marketing campaigns. It’s measured per 100 impressions and popularly used to gauge PPC ads.
Besides, the click-through rate determines how well your headlines, CTAs, blogs, and on-page content are resonating with your audience.
As per Wordstream, the average click-through rate across all industries is 6.18%.
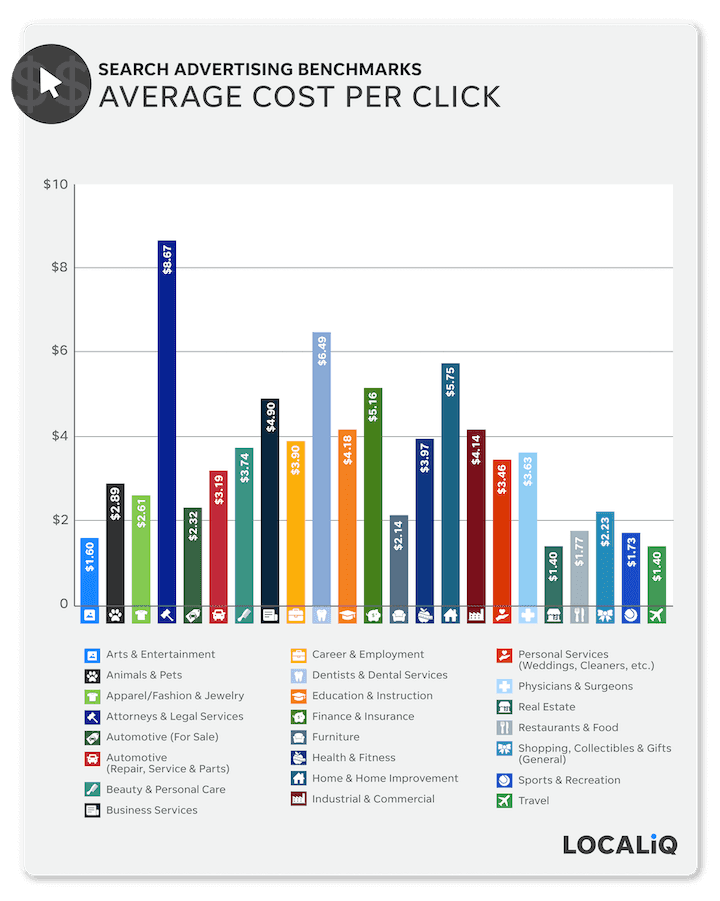
So, if your CTR is lower than 6%, you need to address your marketing team immediately. An ideal CTR percentage varies from industry to industry, so you may opt for strategies based on your industry type.
Here’s how you can calculate CTR:

For example, if your ad has 1000 views and gets 20 clicks. Your ideal CTR is 2%.
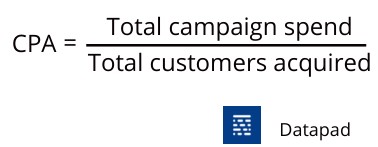
KPI #8. Cost Per Acquisition [CPA]
Cost per acquisition is the total money, time, and resources you and your business spend on acquiring new customers.
In contrast to other marketing KPIs like conversion rate or cost per impression, CPA focuses on the cost for the overall journey from first contact to becoming a customer.
Why Is It Important?
Cost per acquisition is a refined version of customer acquisition cost. It demonstrates the costs incurred to transform a potential lead into a customer.
This metric helps you evaluate the ROI on customers, meaning it tells you if you're spending more on acquiring a customer than the customer lifetime value (CLV).
In fact, if your CPA is higher than the CLV, you might soon be dipping into losses because the money you are spending is more than the revenue generated.
CPA can be calculated by dividing the money spent on a campaign by the number of customers acquired from the campaign.
KPI #9. Customer Retention Rate
Customer retention is the number of customers that a company retains in a certain time period. This KPI accounts for your customer satisfaction efforts and strategies that you put up to keep your customers engaged and loyal to your brand.
Why Is It Important?
Comparably, retaining existing customers will do more good to your business than acquiring new customers.
You may ask why?
An increase in CRR by 5% leads to an increase in profits by 25% to 95%. While acquiring new customers may cost you 50 times more, it won't yield any immediate sales.
This is because existing customers are more likely to try a new product and spend 31% more than new customers.
So, the customer retention rate is a crucial KPI that marketers track for a substantial increase in the company's revenue.
Here’s how you can calculate it:
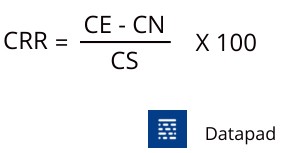
Here,
CE is the number of customers at the end of the period
CN is the number of new customers acquired during the period
CS is the number of customers at the start of the period
#4. Sales Operations KPIs
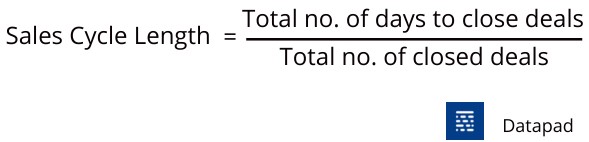
KPI #10. Sales Cycle Length
Sales cycle length measures the average time taken to close a sale from the time of first interaction with the lead. It might be hours, days, or weeks, depending on your sales team's efficiency and, of course, the decision maker.
Why Is It Important?
Measuring this KPI helps you answer three important questions:
-
How long does it take to get the data ready for prospecting?
-
How long does it take to get that first meeting booked with the key decision-maker?
-
The time it takes to close the deal?
Getting answers to these questions helps you improve your sales processes and train your sales team in a better way. Plus, you can also identify any upsell opportunities lying between the sales cycle.
How to calculate it?
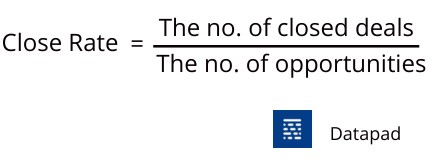
KPI #11. Close Rate
The close rate is the percentage of prospects that are converted into actual customers over a given period of time.
Why Is It Important?
This KPI demonstrates the efficiency of sales professionals or your sales team in getting you valuable customers.
A lower close rate means your sales rep is not performing well in terms of converting leads into customers. This can be improved by providing proper training for sales calls, persuasive skills, customer-centric sales scripts, and more.
Here’s how you calculate the close rate:
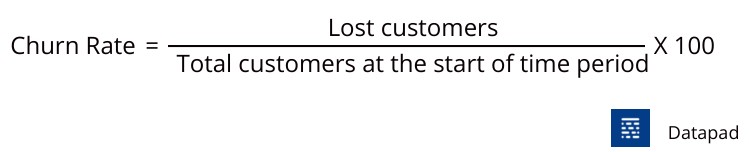
KPI #12. Churn Rate
Churn Rate refers to the rate at which customers stop using your products or services. Typically, this KPI is measured in percentage and tells you how satisfied your customers are with your products or services.
Why Is It Important?
Churn rate helps you identify how your retention strategies are working. Moreover, you get to know the relationship with your customers.
That is why a higher churn rate depicts vital issues either in your product quality or your customer relation management reps, any of these will need immediate attention. The longer a customer stays with your business, the lower your business's churn rate.
Here’s how you calculate the churn rate:
#5. Staffing and Human Resource Operations KPIs
KPI #13. Overtime Hours
Overtime hours is the measure of extra hours that employees are working post the determined working hours.
Why Is It Important?
Sometimes economic growth or a high volume of orders can lead to extra workload, making employees work overtime. Although, if this happens once in a blue moon, it's good for employee productivity.
But working overtime way too often can have a negative impact on employees' self-esteem and hamper overall productivity.
This KPI can also be used during recruitment processes since you will be able to demonstrate the company’s work environment and use this as an argument for hiring negotiations with potential candidates.
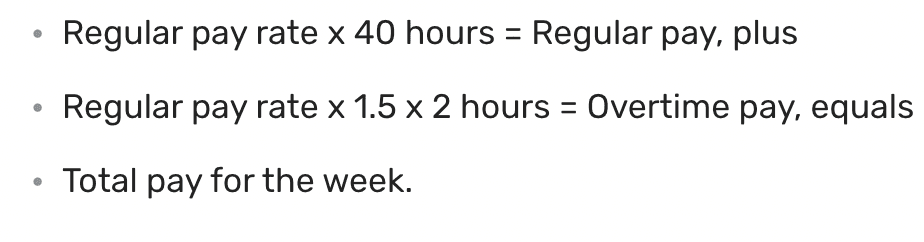
Note: The number of hours can be on a daily, weekly, or monthly basis.
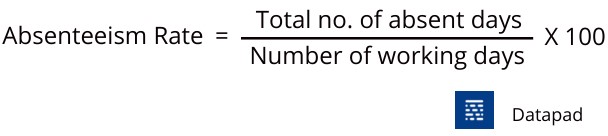
KPI #14. Absenteeism Rate
Absenteeism rate refers to the frequency at which employee(s) are taking leave from the organization.
Why Is It Important?
This KPI inclines toward the company's work culture. If a number of employees take leave very often, it can negatively impact the overall performance of the company and its efficiency in meeting deadlines.
Here’s how you can calculate the absenteeism rate:
KPI #15. Employee Turnover Rate
Employee turnover rate is the measurement of the number of employees who leave an organization during a specified time period.
Why Is It Important?
Turnover can be of two types: Voluntary and Involuntary.
Voluntary turnover is when an employee wishes to leave the organization due to personal factors.
Involuntary turnover is when the organization finds the employee unfit for the position or terminates him/her due to interdisciplinary actions.
In both cases, the company faces a higher turnover rate. Hence, they need to perform the hiring and training process from ground zero.
Eventually, this costs organizations their time, money, and resources. Therefore, a higher turnover rate is deemed to be poor by HRs and recruiters.
Here’s how you calculate it:
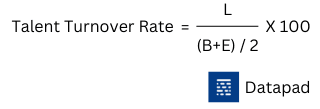
Here,
L represents the number of employees who left
B refers to the number of employees at the beginning of the period
And E is the number of employees at the end of the period
How to Track KPIs in Operations with Datapad

Datapad is a mobile-friendly dashboarding tool. Its mobile-first approach allows you to track and measure the performance of all your business operations from your mobile phone.
Our tool comes with a dedicated mobile app, which, indeed, is architectured by UI/UX experts to function seamlessly on any device. Moreover, we have tested Datapad's compatibility on all known devices.
And guess what?
It ticked all boxes ✅.
Now that you know how cool a dashboarding tool Datapad can be, here's how easy it is to track KPIs in operations with Datapad.
Step 1: Sign Up and Create Your Workspace
Download the Datapad app on your device (available on the App store and Play store), and sign up with your preferred email address.
Once we have verified your email, you can create your own workspace in Datapad. Put in a proper name and tap Create Workspace.
Step 2: Create a Dashboard
After your workspace is all ready and set up, press the 'new dashbaord' sign to create a brand new dashboard.
You can then name the dashboard and fill in other details. Click on Create when you’re done.

Step 3: Team Onboarding
Since you're measuring operation KPIs, you are pulling almost every department into a single dashboard.
Implementing operations KPI tracking without a team can be overwhelming.
While some people might be techies, most of them aren't much familiar with a dashboarding tool.
But no worries, we took care of that!
Team onboarding with Datapad is a seamless process. It's a matter of minutes before each team member from every department is onboard. Moreover, unlike other dashboarding tools, Datapad doesn’t have a steep learning curve.
Even people from non-technical backgrounds can easily navigate and work through KPIs.
You can easily invite your team members to the dashboard via email.
You may also have complete control over who can view and edit the dashboard.
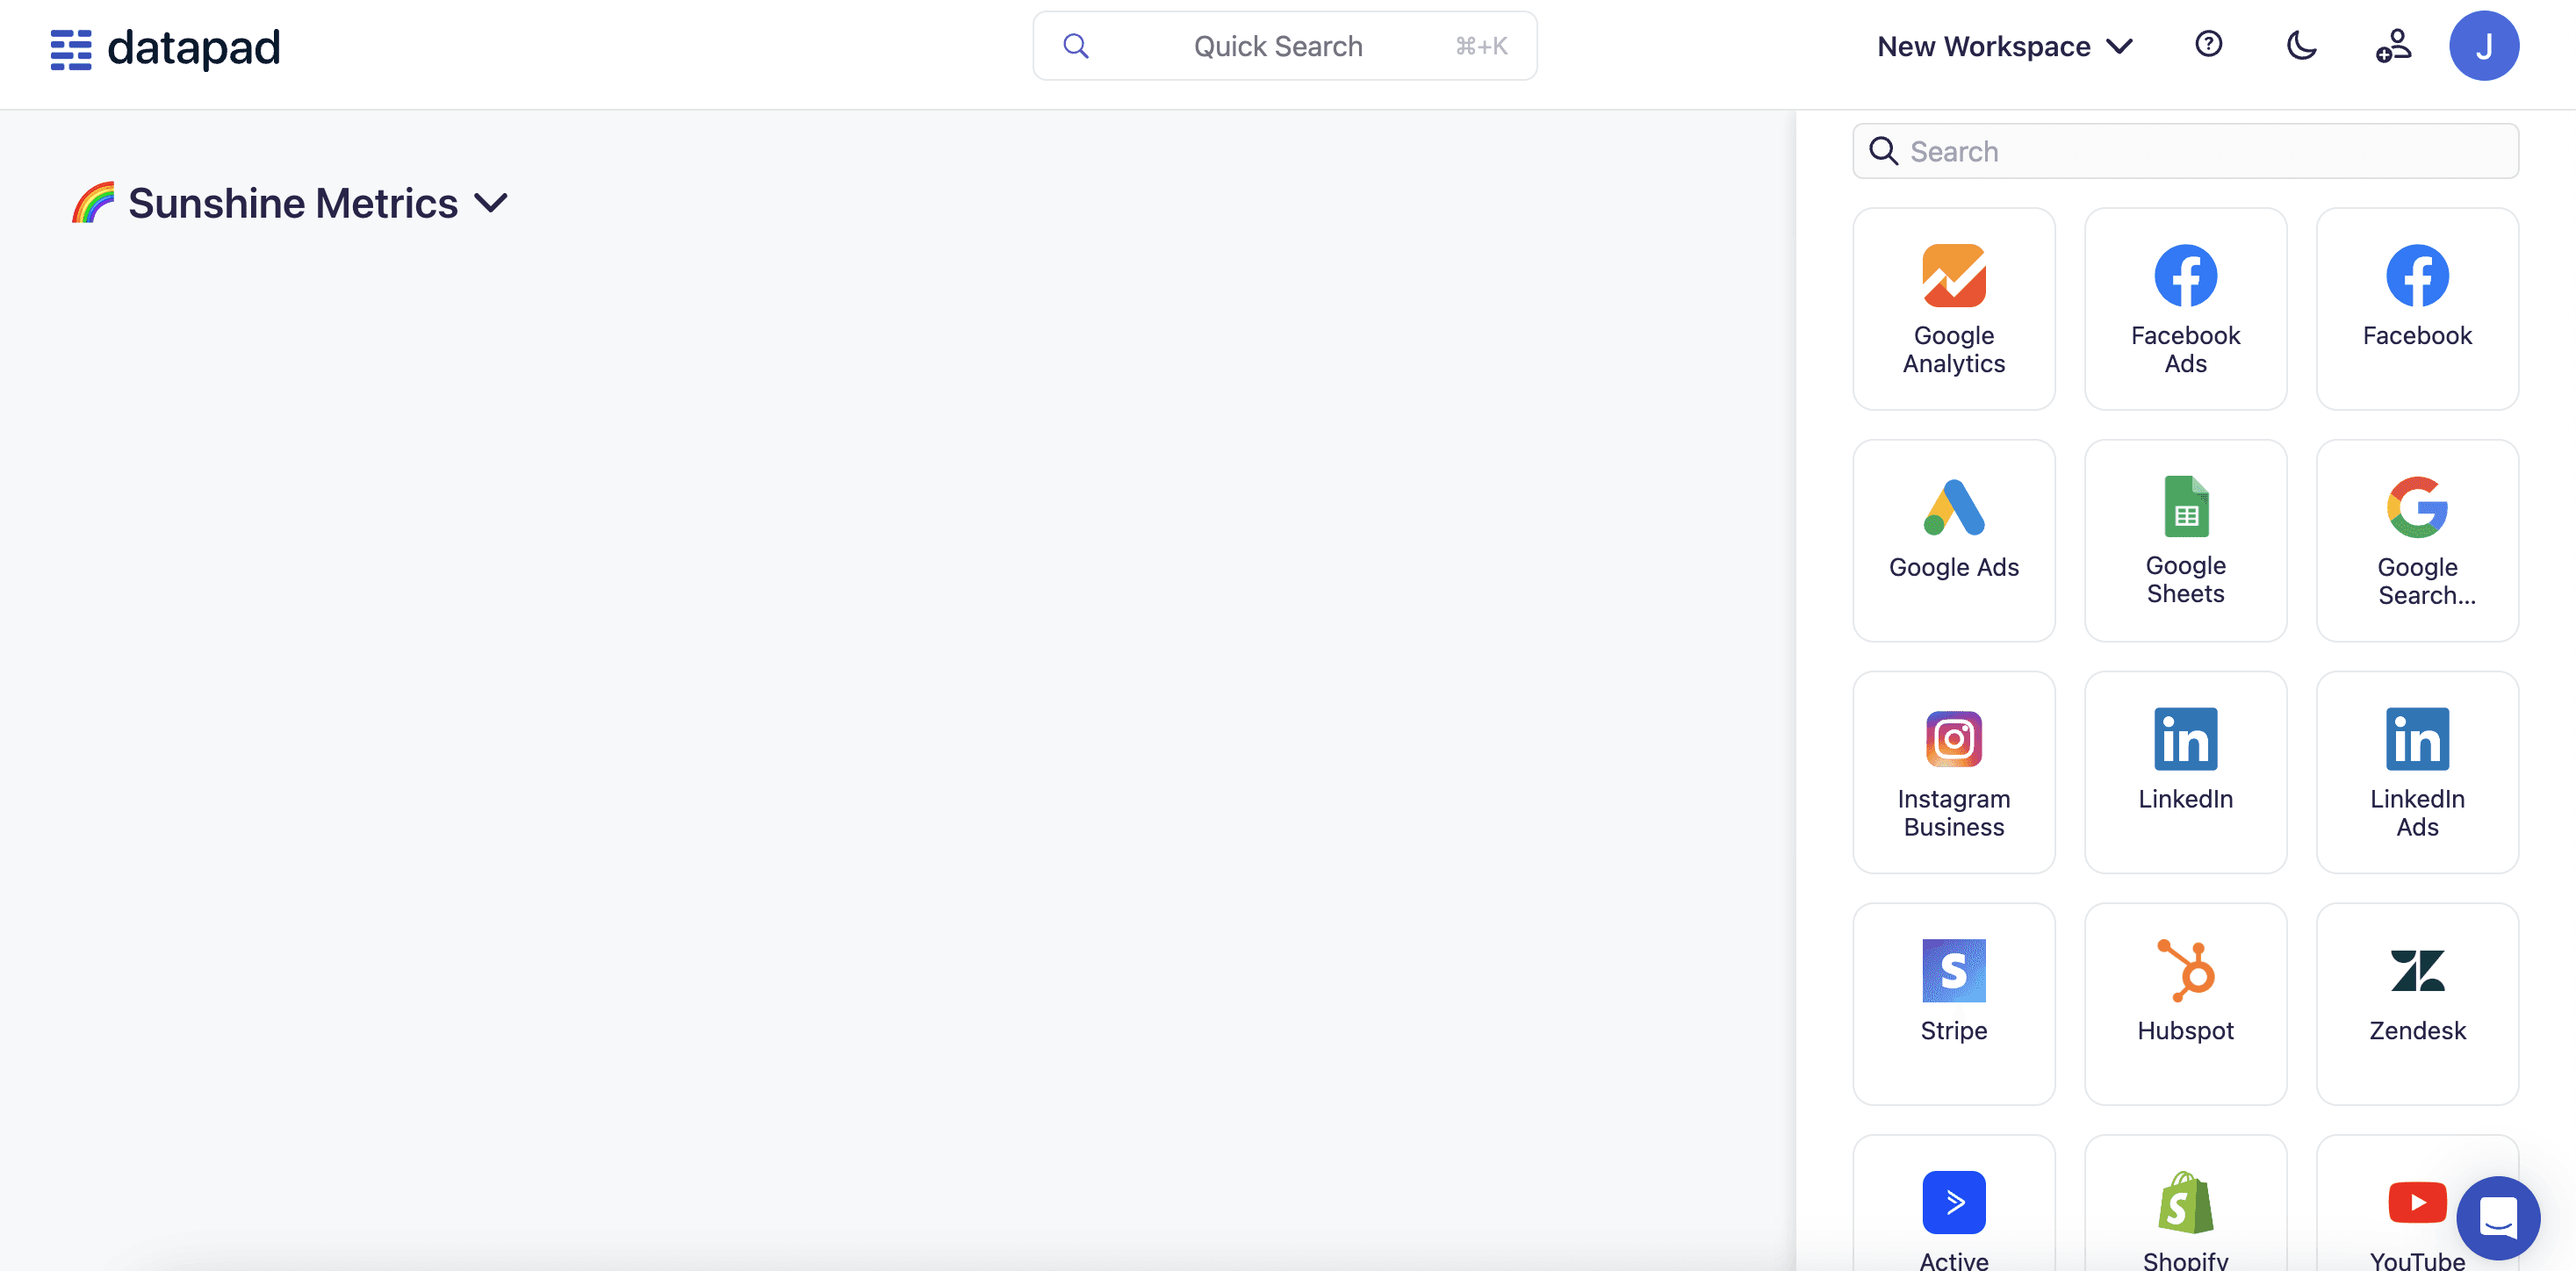
Step 4: Import Data from Multiple Data Sources
Once you’ve onboarded your team, data collections and importation is next in line.
Our tool allows you to import data within couple of minutes.
You can connect to available data sources and start importing metrics instantly.
Step 5: Customize on The Go
Once your dashboard is ready for operations, you can change the look and feel of the dashboard to fit your branding.
Datapad offers tons of pre-built data visualization elements and widgets to help you quickly customize your dashboard. Moreover, its intuitive drag-and-drop customizations are bliss for non-tech users.
You can even set benchmarks and assign KPIs to your team members.
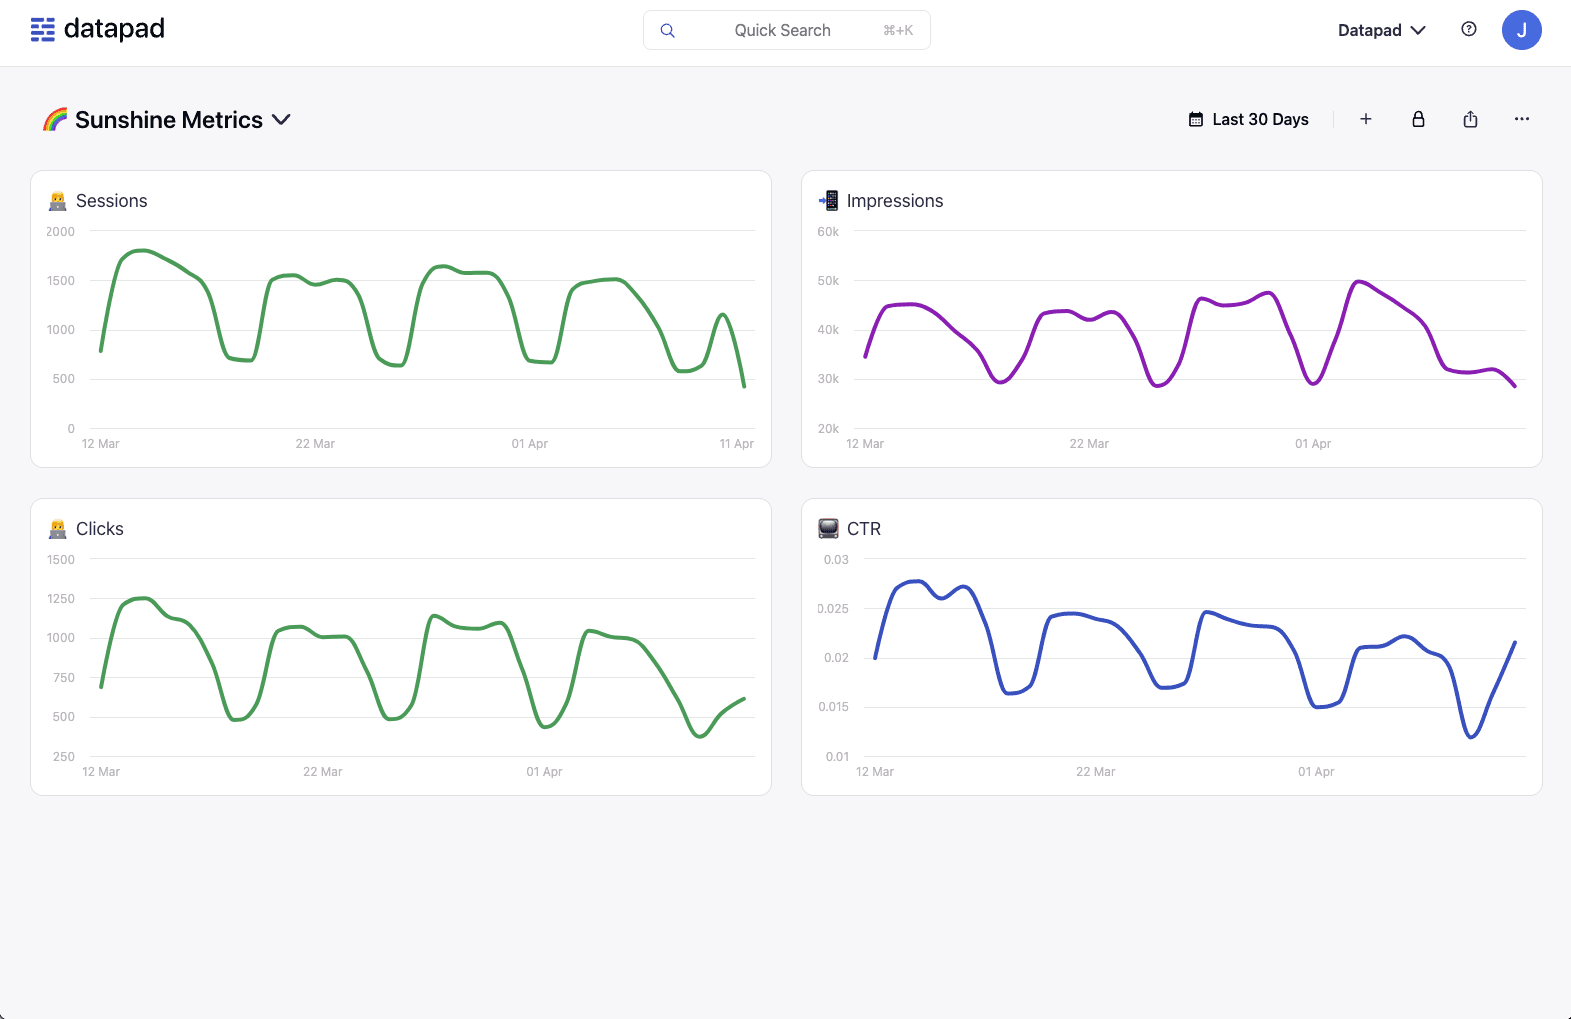
And there you have it; a fully functional operation KPI dashboard is ready. Tracing kpis for operations has never been easier!
Try it out for yourself. Sign up for Datapad for free today.
Related:
Top 13 HR KPIs & Metrics You Should Track For Your Team
13 Most Important SEO KPIs Every Business Owner Should Track in 2022
13 Email Marketing KPIs Every Marketing Professional Should Track
13 Software Development KPIs Every Dev Team Should Track
15 KPIs for Logistics Every Logistic Manager Should Measure
13 Best Product Manager KPIS You Should Be Tracking In 2022
15 Important Retail KPIs & Metrics to Track For Better Understanding of Your Business
10 Startups KPIs You Need to Track [We Asked to the Experts]
13 Recruitment KPIs Every HR Professional Should Track