
Managing a flagship product isn't everyone's cup of tea. You need to know right metrics to track.
So, here, in this article, we have got you the 13 best product manager KPIs you should measure and the why and how of them.
Ready for another successful product launch?
Let’s get started.
What Are the Product Management Metrics a Product Manager Should Know About?
Product management KPIs are quantifiable measurements used by product managers to gauge the performance of products or services offered by the company.
These product KPIs allow product teams to track, monitor, and analyze the success of a product. They also help you identify issues, set SMART business goals, and make data-driven decisions.
For the essentials, a product manager's key deliverables involve business cases, market analysis reports, product roadmaps, and collecting and presenting data in an easy-to-understand manner.
To perform these functions seamlessly, product management key performance indicators come into play.
For example, let’s assume you’re working with a SaaS company as a product manager that’s planning to launch a health tracker which is completely accessible from a mobile app (no additional equipment).
Now, as a product manager, you're asked to launch an MVP (Minimum Value Product) and test its performance. To do so, you need to cater to a particular audience segment and measure the following KPIs:
-
Customer Count
-
Defect Rate
-
Average Session Duration
-
Support Tickets Raised
-
Customer Satisfaction Score
And more such indicators to gauge your MVP’s performance.
Imagine having so much to track just for a minimum value product; what if you are handed over a flagship product? 🤔
Food for thought, we have curated a detailed list of the 13 most important product management KPIs. These are the KPIs every product manager must track to stay put in today’s competitive product market.
But before that, let's understand how and why these KPIs are important.
Product Management KPIs Benefits
Keeping track of product management KPIs can be beneficial in enormous ways:
#1. Measure Product Performance
Anything that's measurable can be improved. The same goes for your product.
That's why tracking, monitoring, and analyzing your product's overall performance is of utmost importance - from financial success to customer satisfaction.
Moreover, these KPIs are focused on the performance of your product. Hence, they are not influenced by other things going around in your organization. This makes them perfect for gauging your product's performance against set goals.
#2. Track Product Development
Product management KPIs are not just about measuring performance. They have had your back since your team started product development.
Some KPIs like delivery on time, team velocity, and resource availability help you streamline your product development processes. This way, you can control the activities and actions taken during the product development stage.
#3. Focus on Product Quality
Quality is the thing that will make or break your product.
Therefore, as a product manager, you need to ensure the quality of products delivered to the audience - whether virtual or physical - should be top-notch because most of your success will depend on it.
Few KPIs like product testing, number of support tickets, and defect rate are indicators of product quality.
#4. Analyze Product Usage
The product management KPIs also guide you through the activities and actions customers perform via your product. For example,
-
How much time does a user spend on a page?
-
How do they navigate through your product?
-
When and where do they terminate their buyer's journey?
-
Which feature of the product do customers engage with the most?
Getting answers to these questions might help you plan your way ahead.
Now that you know why to track product management KPIs, let's have a look at some most crucial KPIs.
What Are the 13 Most Important KPIs For a Product Manager?
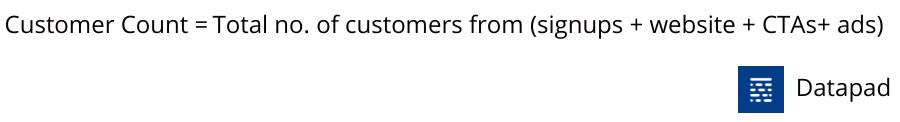
KPI #1. Customer Count
Customer count measures the overall customers you attract from all the traffic channels (organic or paid). It's one of the first KPIs that a product manager tracks.
Why Is It Important?
Measuring this KPI is important because all your efforts are inclined towards increasing your user base.
Besides that, it can also be used to understand growth requirements, as the customer count can affect the operating capacity (this applies particularly to a SaaS business).
You can calculate Customer count by simply adding the number of converted customers (not leads) from marketing channels and ads.
Also, you can refine the metric to count the number of existing and new users using a specific product feature.
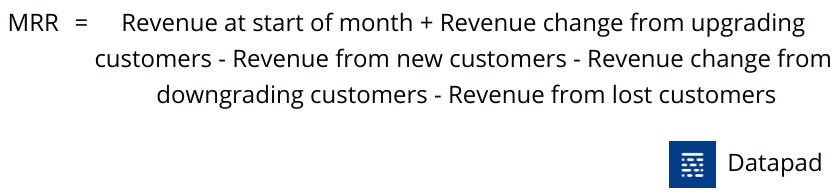
KPI #2. Monthly Recurring Revenue [MRR]
Monthly Recurring Revenue is an excellent KPI for measuring a product's financial success. It accounts for the revenue generated from your product - or how much customers spend on your monthly subscriptions.
Why Is It Important?
Now, this KPI becomes important because it will help you recognize your adoption trends. How your customers spend, and which subscription models fit right into their budgets.
This KPI is helpful for companies that have a subscription-based revenue model.
Plus, since it's monthly, you can always compare your past and current month's revenue and tweak your strategies accordingly.
To calculate Monthly Recurring Revenue, use this formula:
KPI #3. Average Revenue Per User [ARPU]
The average revenue per user is the volume of money a company expects from individual users over a period (likely on a monthly or annual basis).
Why Is It Important?
Measuring average revenue per user helps you understand your finances granularly. You get to know why users and purchasing what they are purchasing and how much.
ARPU can help gauge the impact of iterations made in strategy subscription plans or pricing. It also helps businesses identify which tier customers add more value to their business.
A low ARPU with high marketing and acquisition costs will downgrade your ability to scale and vice versa.
Here's a simple formula to check ARPU:
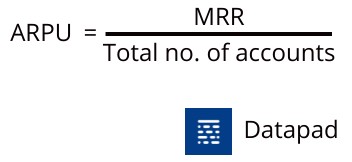
We have used MRR here; however, you are free to use total or average revenue for a given period to measure ARPU.
Here's a quick example.
Suppose you have 100 monthly active customers, and the monthly revenue per customer stands at $ 5000. In that case, the ARPU would be:
ARPU = 5000/100 = $50
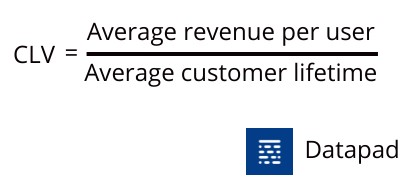
KPI #4. Customer Lifetime Value [CLV]
Customer Lifetime Value (CLV) refers to the total revenue you can expect from an individual customer over their relationship with the company.
Why Is It Important?
CLV is yet another crucial KPI for measuring financial success. The higher the CLV, the more profitable your business grows.
Besides, measuring this KPI helps you in:
-
Financial forecasting and planning economic stability
-
Establishing budgets for marketing and retention strategies
For a better ROI, your Customer Acquisition Cost (CAC) should always be lower than the Customer Lifetime Value (CLV).
Plus, if your CLV is high, it means you have a loyal customer base. Or else, you get opportunities to improve your weaker sections and define better retention strategies, thereby reducing the churn rate.
Calculating customer lifetime value is straightforward:
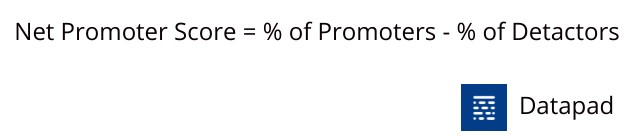
KPI #5. Net Promoter Score [NPS]
Net Promoter Score or NPS is part of the customer service KPI. Basically, it's a KPI dedicated to measuring customer satisfaction.
It measures the ratio between the number of customers who are likely to recommend a product to others and those who don't like it and won't be recommending it. The KPI typically measures this via a scale numbered from 0 to 10.
This can be a one-time survey form or a particular form. You send it to your customers and ask them to rank your product on anything between the number scale.
For those who give it 0 to 6 points are known as Detractors, users with 7-8 points are neutrals, and those who give it 9-10 are promoters.
Why Is It Important?
The NPS is a measure that helps understand your customers' opinions towards your product or service. From a product perspective, this can help guide product development strategy and new features.
A high NPS leads to growth; in fact, you can witness a staggering 20-60% growth in organic traffic. Moreover, understanding your customer's opinions can prompt teams to create innovative ideas and more customer-centric products.
To calculate the net promoter score, divide the % of promoters by % of detractors.
KPI #6. Product Stickiness Ratio
The product stickiness ratio is the measure of the percentage of users that are active on a daily (DAU), weekly (WAU), or monthly (MAU) basis.
This granular metric allows you to identify the number of unique users your product is getting.
A unique user is one who visits a website (or performs an action) at least once within a given timeframe.
Why Is It Important?
For this KPI, the term 'active users' varies from business to business. It might be simply logging in to an app or performing an important function like downloading.
But not every product needs to measure users on a daily basis.
That's why this metric is essential for B2C startups who have high-recency products. This helps them determine how sticky their product is, such as social media apps.
To measure the product stickiness ratio, simply divide the number of daily active users by the number of monthly active users.
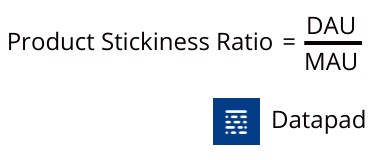
Note: If DAU / MAU is below 20 percent it’s considered a good sign.
KPI #7. Session Duration
Unlike the average user session ratio, session duration is a mighty comprehensive KPI.
Session Duration measures the amount of time a user spends on its product since it was first launched.
Why Is It Important?
The longer a customer stays put to your app or product, the more likely they're to make a purchase from you.
Not only this but measuring session durations can also help you identify which product page or feature customers interact with most and which product items they wave off.
Moreover, If you groom the data of bounced and churned users and calculate their overall session duration, in that case, you may discover endless opportunities to improve user interaction and understand what made them exit your website or app.
Here's a simple formula to calculate Session Duration:

Pro Tip: Google Analytics is an excellent tool to dive deeper into your user sessions and granularly explore their interactivity across your product.
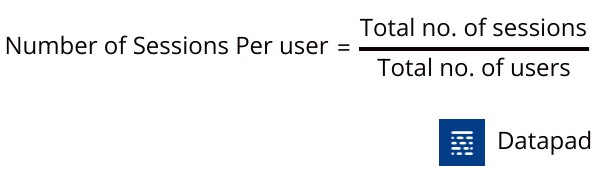
KPI #8. Number of Sessions Per User
This KPI metric tracks the average number of sessions initiated by each user. Typically, it's used by businesses to track the frequency of repetitive users.
Why Is It Important?
As said, since you can measure the number of times each user is using your product, you get to address your loyal customer base.
The higher the individual user sessions, the wider your loyal customer base. Moreover, the frequency of use is often a positive sign that customers are adopting the product.
When it comes to word-of-mouth marketing, Net promoter Score and sessions per user go hand in hand to determine your loyal customer base.
Here's a simple formula to calculate the number of sessions per user:
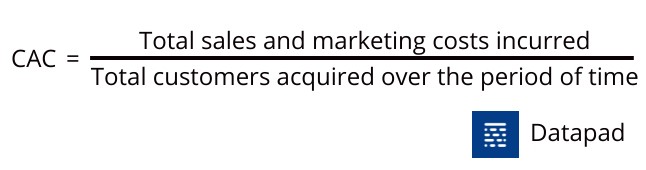
KPI #9. Customer Acquisition Cost [CAC]
Customer Acquisition Cost (CAC), is the cost incurred in acquiring new customers. This includes the time, resources, money, and effort it takes to convert leads into paying clients.
Why Is It Important?
With a 50% increase in customer acquisition costs over the last five years, businesses are bound to measure this metric.
Because if their CAC is more than the CLV (Customer Lifetime Value), their overall growth will suffer as the costs incurred are more than the profits generated from acquiring new customers.
For the most part, CAC helps leaders ensure that they get a better ROI from investing in their customers. And if that isn't the case, it's time to reconsider the pricing and marketing strategies to survive in the long term.
You can calculate CAC via multiple formulas, but here's the simplest one:
KPI #10. Customer Retention Rate [CRR]
Just as we discussed how important it is to maintain a lower CAC than CLV, customer retention is the way to accomplish it, and customer retention rate is the right way to measure it.
CRR is the percentage of customers who stay with your business for a longer term. It's an outcome of your marketing strategies and retention efforts that make up this KPI.
The metric also demonstrates your business's ability to engage your existing customers and make them spend more on your product.
Why Is It Important?
Retaining existing customers cost you way less than acquiring new customers. Besides,
-
Increasing CRR by 5% leads to an increase in profits by 25% to 95%
-
Existing customers are more likely to try a new product and spend 31% more
Moreover, having a good retention rate tells a lot about your brand's loyalty programs and customer-centric marketing strategies.
Here's how you can calculate CRR:
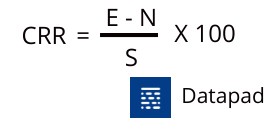
Here,
E refers to the number of customers at the end of a period.
N is the number of new customers gained during the same period.
And S is the number of customers at the beginning of the period.
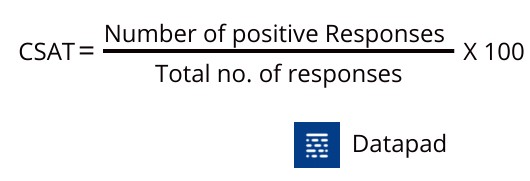
KPI #11. Customer Satisfaction Score [CSAT]
This KPI might feel similar to the Net Promoter Score, but it isn't the same. The CSAT is the measure of how products and services sold by a company meet customer expectations.
While both NPS and CSAT are subjective customer scores, product managers tend to use both KPIs for distinct measurements.
Why Is It Important?
This metric becomes important to track because customers - the heart and soul of your business - need to be satisfied with your offerings.
Any decline in the trajectory will directly impact your company's financial health.
Moreover, you can use CSAT to derive customer satisfaction from using a particular feature of the product. In this way, you better understand what's working for your customers and what's driving them off.
To measure CSAT, ask for user feedback at several points through the customer journey cycle and do it before another subscription renewal so you have time to introduce improvements.
A customer satisfaction score is often measured as a percentage. Here's how you do it:
KPI #12. Number of Support Tickets
Get this; the number of support tickets doesn't necessarily imply an underlying issue faced by the customer. It could be a general request for assistance or random queries about the product.
Ideally, regardless of minor updates to the product, the support ticket count usually shouldn't increase per customer or a subset of customers for best practice.
Why is it important?
Reducing escalations of support tickets is a key function of an effective support system. It ensures that the correct issues are received well while the usual ones can be handled without escalation.
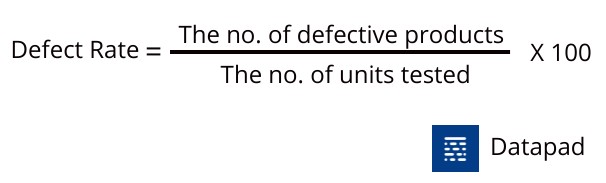
KPI #13. Defect Rate
Analyzing product defects and their frequency is key to spotting big product problems. A defect rate test benchmark should be in place to assess any feature to ensure a smoother rollout for all your customers worldwide.
Why is it important?
Without analyzing potential test failures, you might ship lousy unpolished features to customers of every type, and patching it up later in the stages is a far more complicated process than conducting thorough tests before the product is launched or shipped.
To calculate the defect rate, simply divide the number of defective products observed by the total number of units tested.
How Can a Product Manager Create Dashboard with Datapad?
Datapad is a mobile-first dashboarding tool.
It can be a boon for a product manager because we understand the multitasking a product manager performs on a daily basis (we see our product manager working like crazy all the time 😉).
And so, we simplified the overall process of collecting, monitoring, analyzing, and visualizing your product's data via Datapad.
Datapad is a mobile-friendly reporting and dashboarding tool that helps you instantly track and manage crucial product KPIs from your mobile phones.
Now that you know how Datapad is a dear friend to product managers, here's how easy it is to create a product management dashboard in Datapad:
Step 1: Create a Dashboard
First and foremost, download the Datapad app for your device (available on both App Store and play store), and sign up with your preferred email address.
Once logged into the app, you are prompted to create a workspace. Put in a proper name and tap Create Workspace.
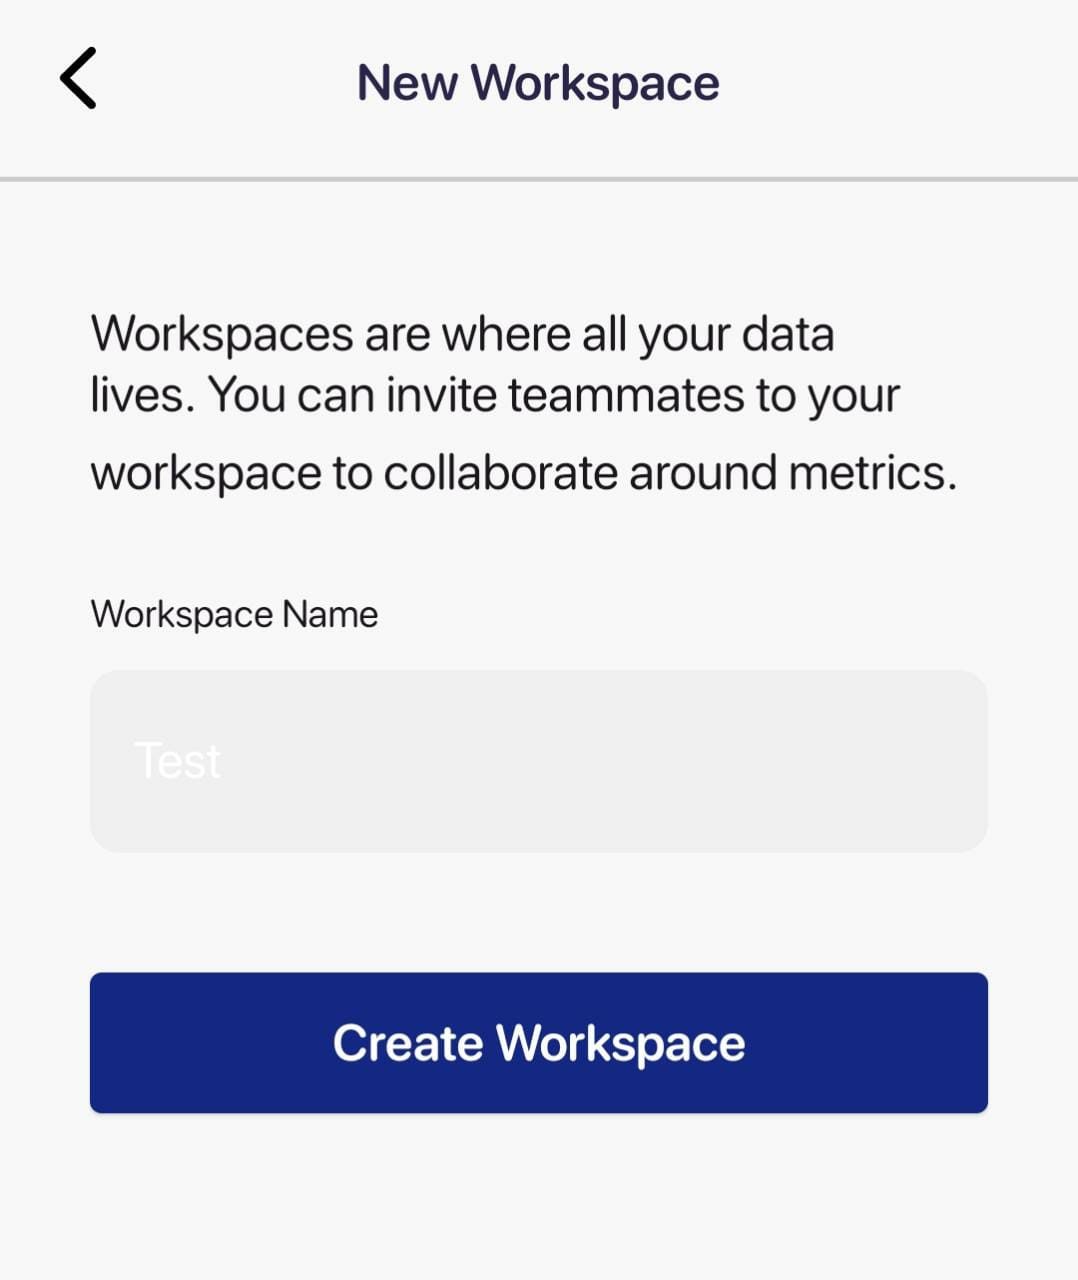
Then press the '+' sign on the top right corner to create a brand new dashboard.
Name it, describe what the dashboard’s for, and use an emoji if you want. Click on Create when you’re done, and that’s it!
Step 2: Start Onboarding Your Team
Team onboarding with Datapad is a seamless process. It's a matter of minutes before your associate product managers and team members are ready, set, and good to start with KPI tracking.
You can invite your team members to the dashboard via email.

Moreover, you have access to role-based management, i.e., complete control over who can view and edit the dashboard.
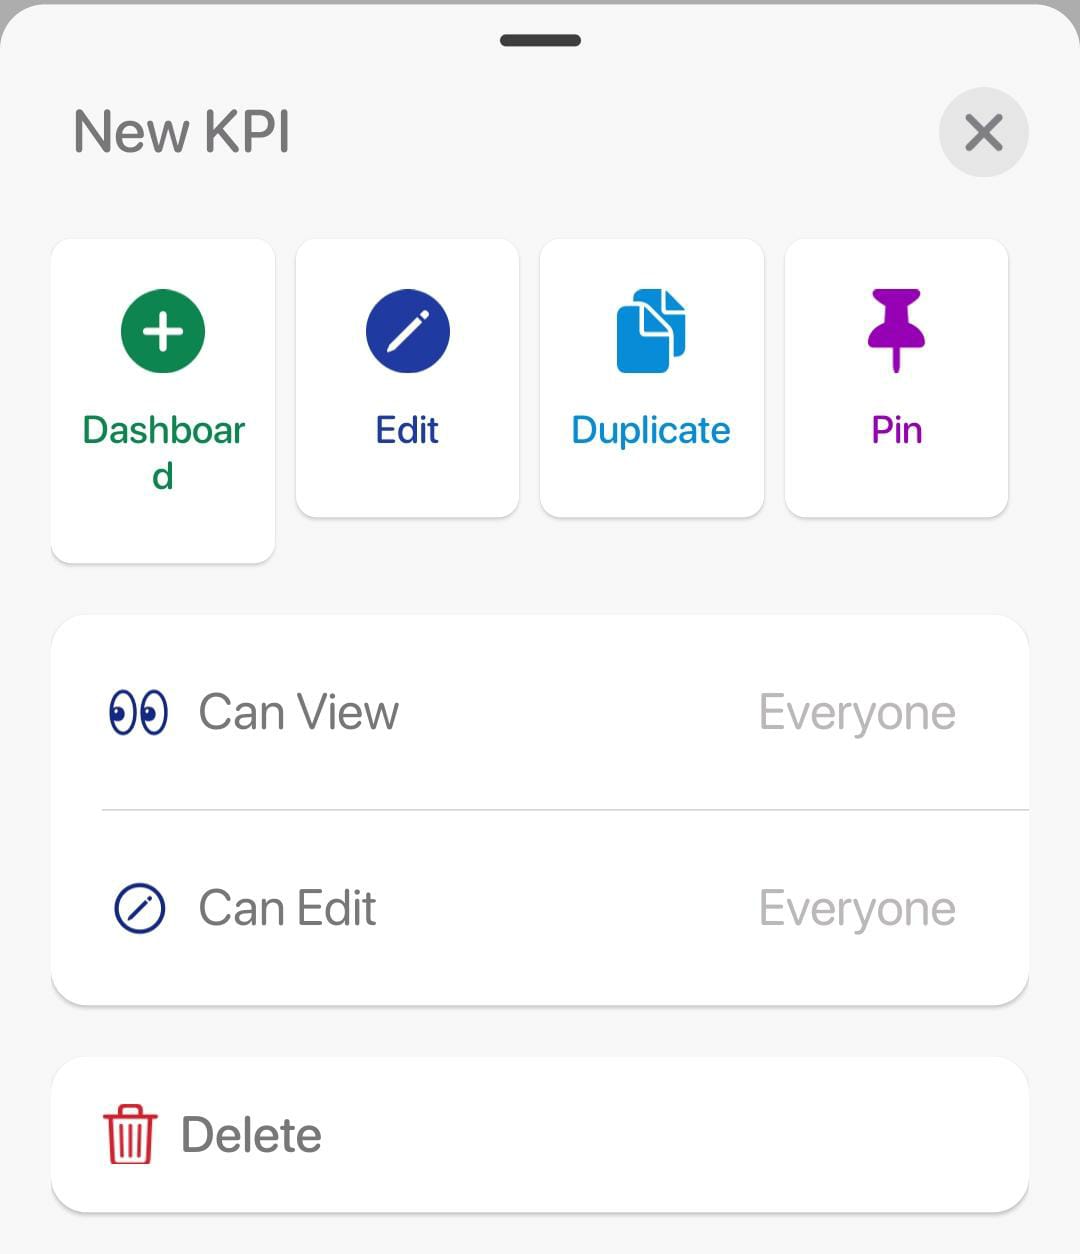
Meanwhile, you're always welcome to supervise your employees' activities and actions from an admin viewpoint.
Step 3: Import Data from Multiple Data Sources
Importing data is another sought-after feature in Datapad. Our tool allows you to import data both ways: Automatically and Manually.
Let's first see how you can import data automatically via our one-click integrations.

And if you have a comparatively smaller dataset, here's how you can import data manually.

Step 4: Customize on The Go
Once you have everything put in place, it's time to wake the sleeping artist in you.
Our tool offers tons of pre-built charts, bars, tables, and other data visualization elements to help you visualize your data quickly and efficiently.
You own the freedom and flexibility to fully customize your dashboard, from colors to texts and more.
While it took 10 mins to write the steps and design the GIFs, it would take just a couple of minutes to create a dashboard in Datapad.
Sign up for our free-to-use mobile app, and impress your CEO by creating a product management dashboard today to track product manager KPIs.
Top 13 HR KPIs & Metrics You Should Track For Your Team
13 Most Important SEO KPIs Every Business Owner Should Track in 2022
13 Email Marketing KPIs Every Marketing Professional Should Track
13 Software Development KPIs Every Dev Team Should Track
15 KPIs for Logistics Every Logistic Manager Should Measure
15 Best KPIs for Operations that Are a Must for Every Business to Track
15 Important Retail KPIs & Metrics to Track For Better Understanding of Your Business
10 Startups KPIs You Need to Track [We Asked to the Experts]