
Heard the story of the race between the rabbit and the tortoise? Our grandma used to narrate the story every once in a while.
In the business world, the rabbit is the likes of Amazon and Walmart, which offer one-day delivery, and the tortoise is those businesses that deliver a product in a week.
Unlike the OG story, ‘Slow and steady doesn’t win the race’ in the business world.
With the E-commerce economy surging to $26.7 Trillion, logistics are an important reason behind the success of e-commerce giants.
Food for Thought: What’s the use of a one-click purchase with a delayed delivery or getting the wrong product?
To prevent such incidents, logistic KPIs come into play, kpis for logistics are defined to manage your logistic operations with ease and transparency.
In this article, we’ll drill down the fundamentals of logistic KPIs, how they are important, and the best KPIs every logistic manager should measure.
What are KPIs in Logistics?
When tracked, Key Performance Indicators (KPIs) give you an idea of how your business performs against the set goals or industrial benchmarks.
Logistics holds a crucial place in driving business success because a proper logistics system will streamline delivery time.
Logistic KPIs ease the process of managing logistic departments within organizations. These KPIs quantify every possible process that goes into purchasing, warehousing, order fulfillment, and transporting them and present you with actionable data and insights.
Benefits of Tracking Logistic KPIs
Logistics managers use logistic KPIs to gauge processes against set industry benchmarks. These KPIs help managers remain updated with their daily production, cost, and quality rates.
Moreover, in the logistics area, these insights can help you consistently monitor and evaluate granular metrics related to your supply chain.
Let's see it the other way around.
One of the top goals of logistic managers is procuring adequate resources, testing and properly packing the goods, and transporting them to the right location and, of course, to the right person.
Now to perform so many tasks simultaneously, managers ought to get some help.
It's not uncommon among production lines and supply chain staff to call out a strike in case of disruption.
Measuring the right set of logistic KPIs lets you operate with fewer disruptions and higher productivity.
Now you might wonder, ‘What are the Logistics Key Performance Indicators (KPIs) you should track to measure your logistic operations?’
We got you covered.😉
15 Best Logistic KPIs Every Logistic Manager Should Track
KPI #1. Operating Ratio
The operating ratio is measured by comparing the total operating expenses of a company to net sales.
As said, this KPI shows the relationship between the amount of revenue earned and the total cost incurred in running the logistic operations.
Why Is It Important?
Tell us one thing; If your expenses are more than your revenue, how are you planning to manage your finances?
In the same context, a lower operating cost indicates better higher profits. But cutting down your operating expenses on the cost of quality will result in blunders.
Instead, be creative in cost cutting, such as purchasing inventory in bulk, adopting automation wherever feasible, and more.
Typically, an operation ratio between 60-80% is considered as good. However, the lower, the better.
Here's how you can calculate the operating ratio:
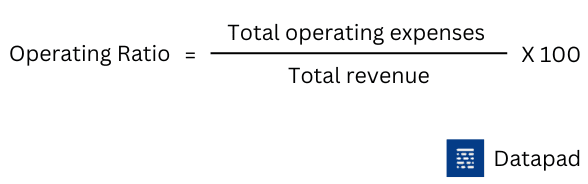
For example, if your operating expenses account for $5000, and the total revenue is $15000
Your operating ratio equals $5000/$15000 = 33.33%
KPI #2. Inventory Turnover Ratio
Inventory turnover, preferably known as stock rotation, is a valuable logistic KPI.
It’s the measure of how fast your inventory is sold during a given period of time.
Why Is It Important?
By measuring inventory turnover, you identify what amount of stock you need to purchase to fulfill the demand. Tracking this KPI also lets you figure out the demand for certain products compared to others.
This can eventually help you purchase the right products in the right quantity. Plus, having a surplus stock of an in-demand product can skyrocket your sales.
To calculate the inventory turnover ratio or stock rotation, divide your total sales by the average inventory value.
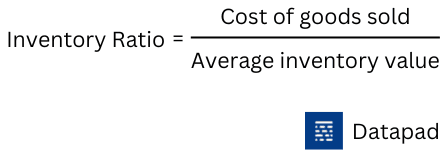
A higher inventory turnover ratio indicates a strong sales strategy and a high demand for goods you sell.
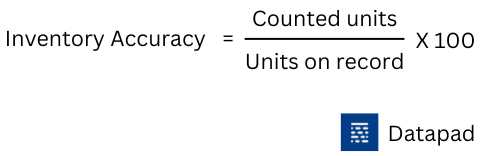
KPI #3. Inventory Accuracy Rate
What if you never know what's lying in your inventory? And what if a customer orders something that isn't in your stock but is displayed in your catalog?
That's where inventory accuracy comes in.
This KPI lets you measure the difference between your warehouse stock records and real-life inventory.
What Is It Important?
A sustainably higher difference between said, and real-life inventory can make or break your business.
We sound so harsh because an inaccurate inventory results in unexpected backorders and can show you surplus inventory in stock while you're down to your last unit.
That's what makes tracking inventory accuracy ratio so important.
Here's how you can measure inventory accuracy:
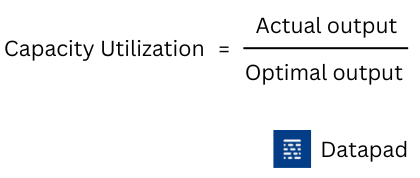
KPI #4. Capacity Utilization
Capacity utilization measures the number of resources utilized vs. the total available resources.
This one is a comprehensive KPI. Using capacity utilization logistic KPI, you can measure the equipment utilization rate, the load capacity of a transport vehicle or container, and much more.
Why Is It Important?
Although this KPI doesn't seem necessary, it has everything to do with logistics.
Unhealthy use of available resources can cost you a fortune if not directed in the right direction.
In the case of production, underutilizing your resources can hamper your supply chain. Moreover, lower capacity utilization is an omen of economic slowdown.
You can measure capacity utilization by dividing the actual output achieved by the maximum output that could have been achieved.
When it comes to transportation, low-capacity utilization simply increases the transportation cost by hiring another container. It's a simple KPI that can be improved by figuring out new ways to increase container capacity.
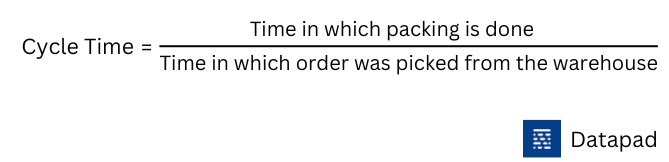
KPI #5. Pick and Pack Cycle Time
Pick and pack cycle time refers to the average time it takes for an employee to pick a product from the shelf and pack it.
Why Is It Important?
Every minute matters in logistics, and this KPI is important for logistics managers out there. Measuring this KPI on a monthly basis allows you to compare your warehouse employees' productivity over time.
Moreover, you can always work on improving this cycle time by enabling automation or increasing the number of employees in the packaging section.
However, try not to overload your employees with unachievable goals. It might get you to your goals but will also promote an unhealthy work culture in your company.
Here's a simple formula to measure cycle time:
To visualize this KPI, logistic managers use comparison charts to individually gauge the performance of multiple product lines.
KPI #6. Truck Turnaround Time
Truck turnaround time, also known as Truck turning, is the logistic version of average dwell time.
It measures the time from when a delivery truck enters the warehouse to collect or deliver products to when it exits the facility.
Why Is It Important?
Typically, this KPI measures a company's loading and unloading efficiency. It's a popular KPI among companies that offer road transportation.
Although the dwell time doesn't show an effect in real-time, it can cause major disruptions in the long term. And so, logistic managers try to keep a low truck turnaround time to ensure a smooth flow of operations.

KPI #7. Average Transportation Cost
The average transportation cost is the average cost of transportation expenses compared to gross monthly income.
Why Is It Important?
This KPI is preferably measured month over month. It will break down the cost incurred in order processing, administrative processes, inventory carrying, warehousing, and transportation.
This way, you get crystal-clear insights into the processes that cost you more. The goal is to decrease transportation costs while maintaining high-quality delivery operations.
Calculating this KPI is pretty straightforward. Simply divide the average transit cost by the monthly gross income.
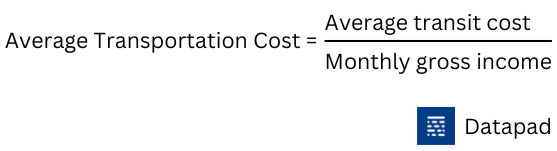
Here, the average transit cost is the sum of all costs incurred from processing to transportation by the total number of goods transported.
KPI #8. Freight Cost Per Unit Shipped
As the name depicts, this is a simple logistic KPI. It measures the amount of $$$ spent on shipping a product over a period.
Why Is It Important?
This KPI is interrelated to the capacity utilization metric.
Do you know how?
Companies desire a lower freight cost, so they want their container fully loaded. Doing this not only saves the company huge money but also accounts for fuller utilization of resources.
Meanwhile, no one wants to overload the container just to cut down on freight. That's a blur practice in play.
Here's how you can measure freight cost per unit.
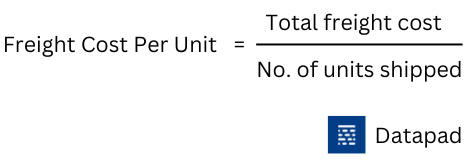
For example, if a company incurs $12,000 for shipping 6,000 units from point A to B. Their freight cost stands at $12,000 / 6000, i.e, $2/unit.
KPI #9. Number of Shipment
This KPI tracks the number of orders that are shipped out of the warehouse. The number of shipments is a pretty straightforward KPI and common among businesses.
Why Is It important?
This KPI evaluates the average number of shipments a company can handle over a period (weekly / monthly / yearly).
Any change in this trajectory indirectly impacts your revenue per sale and gross revenue over a period.
A higher number of shipments indicate positivity on all sides, that is, an increase in demand and your capacity to fulfill the orders.
By studying the insights from this KPI, logistics managers can figure out ways to improve the shipment capability of their supply line.
Besides, they could use this information to increase staffing and revenue accordingly.
KPI #10. Use of Packaging Material
Do you optimize your packing material usage? If not, you might miss out on 10 - 40% of revenue per product.
The use of packaging material is a logistics metric that measures the amount of raw materials used for packaging each product in your pick & pack process.
Why Is It Important?
On a lighter note, Amazon alone generated 465 million pounds of packaging waste. That amount of plastic waste is enough reasons to measure this KPI.
Besides, logistics managers should use sustainable, recyclable, and eco-friendly packing materials to lower logistics costs and reduce environmental impacts.
For example, recycled paper and plastic, reused cardboard, cellulose, compostable bags, sugarcane boards, and more.
KPI #11. On-Time Pickup Percentage
On-time pickup is a logistics KPI interlinked to the pick and pack cycle time.
It allows you to measure the number of items a freight carrier picked on time in full compared to the total number of shipped items.
Why Is It Important?
Typically, pick-up is the foremost step in the logistics process. And if the first step itself is delayed, the whole operation suffers a halt. Hence, logistic managers are keen on measuring the on-time pickup percentage.
From a broader perspective, this KPI shows how efficient your carrier services are in terms of punctuality.
Moreover, a higher on-time pick-up percentage indicates scheduled delivery and ensures customer satisfaction. At the same time, a lower on-time pickup percentage is the other way around.
Here's how you can calculate this metric.
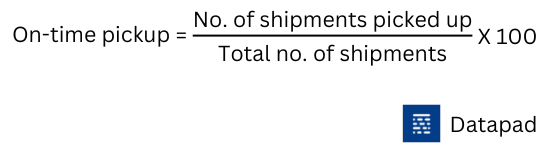
Any on-time pickup value above 90% is considered acceptable for most logistic managers, while anything below that needs improvement in terms of truck turning rate, staffing, or loading capabilities.
KPI #12. On-time Delivery Percentage
Do you know why brands like Amazon and Walmart are so strict about on-time delivery (of course, except during the pandemic)?
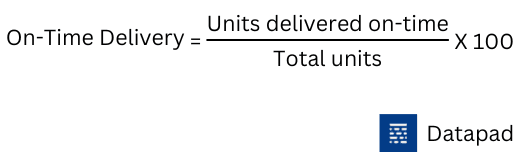
Because this metric significantly impacts customer satisfaction and loyalty. On-time delivery is the percentage of products delivered on time to customers vs. the total no. of orders shipped over a period.
Why Is It Important?
On-time delivery measures the success delivery rate for an entire order, and not in parts or segments. This KPIs is the heart and soul of the logistics industry or department.
It demonstrates your overall efficiency of logistics operations and how well things are put in place to get customers their orders on time.
A lower on-time delivery percentage indicates poor carrier and transportation services and might eventually repel customers from purchasing your product.
Here's how you can calculate on-time delivery:
KPI #13. Order Accuracy
What if you were waiting for a Macbook and got delivered an iPad? Or even worse, an iPad with a broken screen?
To avoid such customer nightmares, an order accuracy metric comes into play.
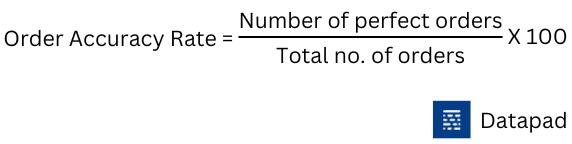
Order accuracy measures the number of orders packed, transported, and delivered perfectly vs. the total number of orders shipped over a period. In short it shows you the number of perfect orders.
Why Is It Important?
High order accuracy helps you stay in business, if your order accuracy is significantly low, no one would like to buy from you.
Moreover, poor order accuracy results in a higher product return rate, costing you time, resources, and revenue.
It also shows the efficiency of your supply chain and delivery services, encouraging customers to buy from you repeatedly.
Use this formula to calculate the order accuracy rate.
KPI #14. Cost Per Pound
You must have seen airlines measuring your luggage by weight and not by numbers.
Or, you might have paid extra delivery charges on orders that take space and more weight.
In both cases, the weight of the object matters. Hence, cost per pound is a performance metric that measures the cost incurred of shipments compared to their weight in pounds (preferable unit).
Here's a simple formula to measure this KPI.
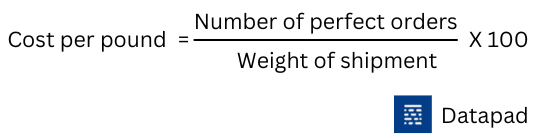
For example, a shipment of 2,000 Lbs of goods costs you $800. Therefore, cost per pound equals 800 / 2000, i.e., $0.4.
Note: The average industry cost per pound is anywhere between $0.06 and $0.75.
KPI #15. Warehousing Cost
The warehousing cost refers to the amount of money spent on goods while they are lying in the warehouse. Generally, it includes the cost of storage, such as labor costs, loading and unloading costs, energy cost, and more.
Why Is It Important?
This is a vital metric for companies that produce delicate goods. For example, packed food products might require cold storage, which will incur higher electricity bills, trained employees, and adequate space and maintenance of the warehouse.
Likewise, this metric also shares insights around warehouse dwell time and how the work there can be optimized for better functioning.
Warehousing cost is a component of another logistic KPI, transportation cost.
Using this KPI, logistic managers can also determine which warehouse operation is costing them a fortune and can work on effective cost-cutting strategies.
How To Track Logistic KPIs In Datapad?
Datapad is a mobile-friendly dashboarding tool that allows logistic managers to track, monitor, and obtain data-driven insights on their logistic operations via mobile phones.
In context to logistics, Datapad allows you to quickly create new KPIs, set a goal, and track progress in real-time.
Plus, since we now know that logistic KPIs can be subjective in nature, our tool provides easy-to-understand data visualization elements and charts to make things work for partners and stakeholders.
Here's how you can create a logistic KPI dashboard in Datapad.
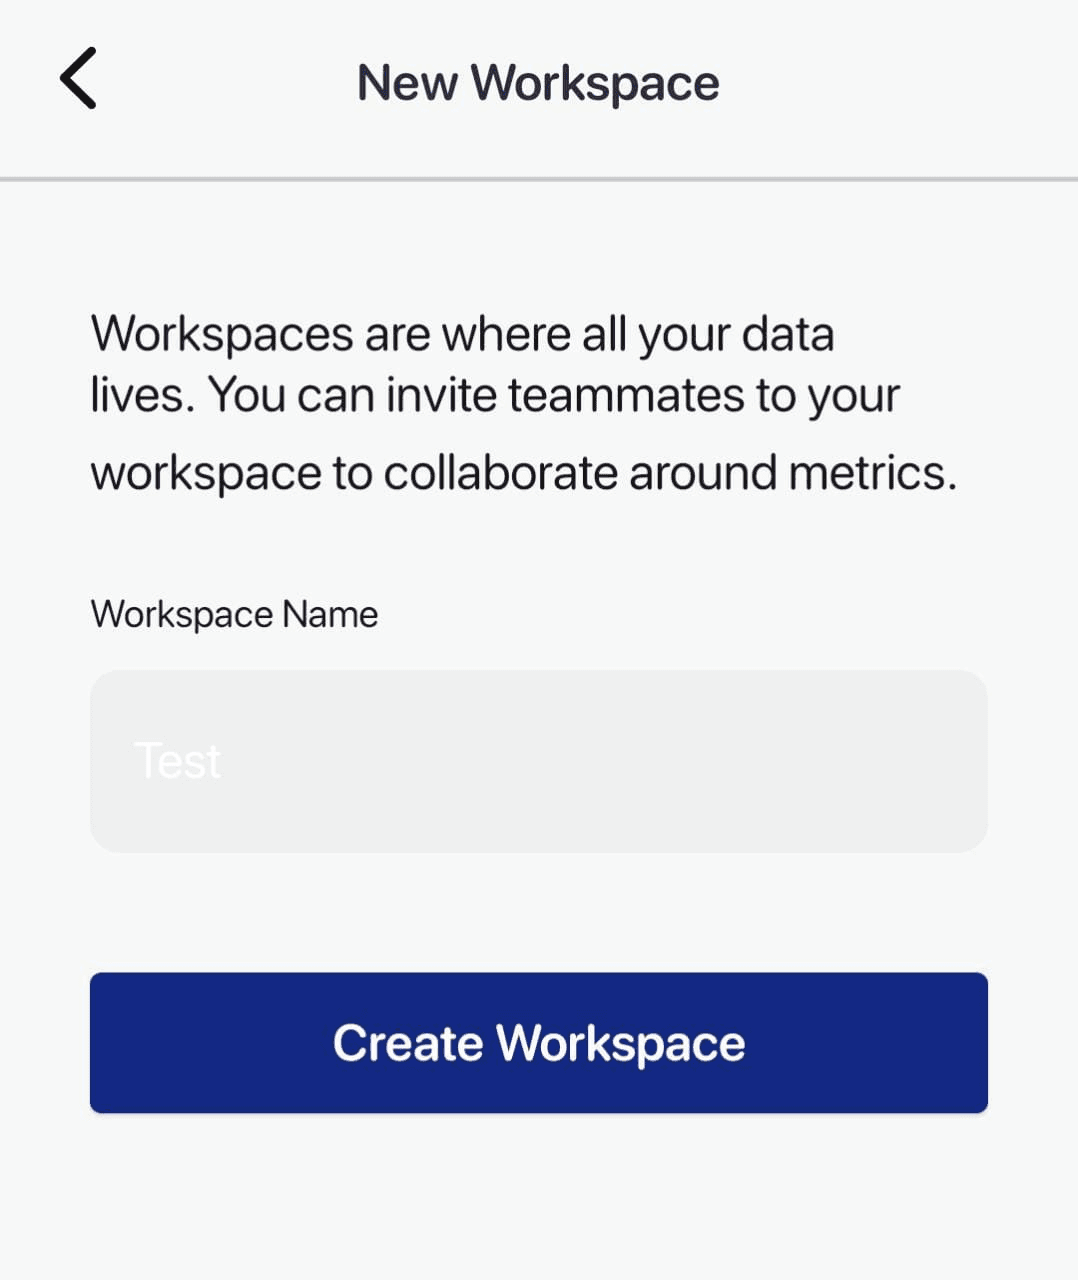
Step 1: Create a Workplace
To get started, download our app on your mobile devices (available for both Android and iPhone).
Then, sign up with your preferred email address. Once the signup process is complete, you're prompted with a Create Workspace pop-up.
Simply add a name to your workspace and click on Create Workplace.
Step 2: Create Your Dashboard
Once your workplace is created, our tool and the data you import are all yours.
P.S. We don't get involved in your workplace (unless you want our help).
Now, click on the '+' on the top right corner to add a dashboard. Here, you are asked to give your dashboard a name and add a few other details to personalize your experience.
Fill in the boxes and click on Create. That's it! Your dashboard has been created automatically.

Step 3: Import Data To Your Dashboard
Datapad lets you import data both automatically and manually.
When it comes to logistics, you need every type of data from cycle time to transportation costs to delivered or returned orders.
Here's how you can leverage Datapad to import data automatically:

In case you left some data out, or your CRM didn't update detailed data, you can import that manually, here's how:

Step 4: Get Started
Now that you have put everything in the right place, it's time to onboard your logistic team. With Datapad, you can simply send an email invite to your team members to get them onboard.

Moreover, you can enable role-based management, i.e., you can control who can view or edit the dashboard. Again, all from your handset.
Besides, you can change the look and feel of your dashboard. Our tool offers tons of pre-built visualization elements like graphs, charts, tables, and more to help you with quick drag-and-drop customizations.
Wasn't it way too easy?
Bottom Line: A logistics manager is the person responsible for supply chain management, and to keep the process streamlines, KPIs for logistics are a must to track. In order to track a KPI, you need a tool and that’s where Datapad comes in. Sign up for Datapad for free today!
Related:
Top 13 HR KPIs & Metrics You Should Track For Your Team
13 Most Important SEO KPIs Every Business Owner Should Track in 2022
13 Email Marketing KPIs Every Marketing Professional Should Track
13 Software Development KPIs Every Dev Team Should Track
15 Best KPIs for Operations that Are a Must for Every Business to Track
13 Best Product Manager KPIS You Should Be Tracking In 2022
15 Important Retail KPIs & Metrics to Track For Better Understanding of Your Business
10 Startups KPIs You Need to Track [We Asked to the Experts]