
You might never hear of a company without a human resource department.
Do you know why?
No matter how many AI-driven tools you have or how profoundly you support automation - the people at work play the most crucial role in a company’s growth.
And to foresee the productivity and satisfaction of employees, HR KPIs come into play!
You might think, is it necessary to track these metrics? 🤔
Yes, and you would agree too if we say happy employees could be up to 12% more productive at achieving your goals and objectives.
So, let's dive deeper into what HR KPIs are and how measuring HR metrics significantly improves your company's growth.
What Are HR KPIs?
A company tracks HR KPIs to know their employment status, the team's performance, and the employees' roles in the business's success.
This means that the KPIs for HR indicate how efficient the HR department is in accomplishing the business's goals. These KPIs are essential to track so you know how efficiently your business's workforce is performing.
Here's an example to understand HR KPIs better:
AER Lab is an organization trying to increase its production this year. The BOD (Board of Directors) have decided to invest heavily in manufacturing and production units, but to do so, they need to cut costs on every other level, including HR.
Now, how will this goal be translated into HR KPIs?
For the Human Resource department, the cost-cutting can be in terms of reducing recruitment costs. Suppose we say AER Lab's current recruitment cost is $700,000, which must be under $500,000.
In this scenario, 'Reduction in Recruitment Cost' is the KPI they should track and optimize.
Another excellent KPI for HR might be the ‘Talent Turnover Ratio.’
A lower TTR results in fewer recruitment and training costs for new employees, contributing to the overall goal of reducing expenses.
So, AER Lab aims to reduce its TTR from 15% to 10% (which is good). Plus, the company has already decided to cut its recruitment costs by $200,000. Here's what their HR KPI template would look like:

Now that you know the basics of HR key performance indicators, let's see what KPIs for human resources to track for any business.
What are the 13 Most Important Human Resources KPIs?
#1. Employee Retention
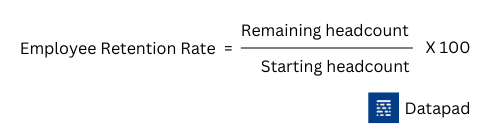
Employee retention rate refers to the percentage of employees who stay with your organization.
It depends on how well a company can manage its workforce so that they are motivated and happy at what they do.
There could be several ways of doing that, like offering incentives and recognitions based on their performances. This encourages them to be more engaged and excel at their work.
Why Is It Important?
Employees are the powerhouse of your organization. They are the ones who bring in more and more business. Without them, all you want to achieve as a company or as a group means nothing.
That's why it's important to measure this KPI so you can adopt effective retention strategies to achieve your business goals.
Not only does it result in higher productivity levels among your employees, but it also improves the all-around work culture of your company.
Here's how you can calculate it:
#2. Time to Fill
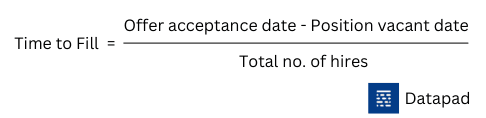
Time to fill is the number of days it takes between the job requisition and the day a new hire accepts that position. It's one of the critical recruiting metrics that track the efficiency of the external hiring process.
Why Is It Important?
Considering the talent shortage in the competitive labor market, it's crucial for HR to know how quickly an open position gets filled. That's why the time to fill is of so much use, especially for hard-to-fill job roles.
Tracking this KPI serves as a forecasting variable for talent recruitment strategies. In addition, it also helps HR to come up with more realistic plans so that they can handle situations like layoffs in a better way.
The time to fill varies for different industries based on the hiring process, job location, or the available talent in the market.
However, it can be expressed using a simple mathematical formula:
#3. Cost Per Hire
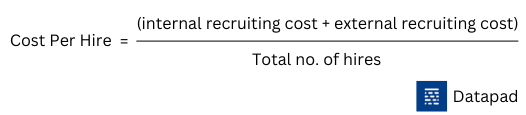
Tracking cost per hire KPI lets you know the total resources you've put in to hire an employee.
These resources might be the money you spend on job post creation and its advertisement on Job boards, the time that goes into the hiring process, and the money you spend on referrals (in case any) when hiring a candidate.
According to Ideal, the cost per hire should be 16% of the salary when the salary is less than $30,000 and 20% when it's more than $75,000.
Why Is It Important?
#1. Knowing Recruitment and HR budget
Tracking cost per hire clarifies the amount of money you require to hire in the next quarter or month. If you track this KPI annually, you know how much more or less you spent on hiring compared to the previous year and whether it’s a good or a bad thing.
#2. Managing Costs
The cost per hire need not always be low. Maybe your business is doing great, and you need to hire double the number of employees that you did in the previous quarter.
Apart from this, hard-to-fill roles (senior leadership roles) will always have a higher cost to hire.
Tracking this KPI will allow you to know where you need more funds and for which hiring position your business is overspending.
#3. Measure Recruiters' Performance
Measuring cost per hire KPI for HR will also give you a clear idea of the recruiters' efficiency. You want your employees to perform the best they can with minimal funds. So track this KPI and talk to your recruiters about where they can improve and where they can have more flexibility when hiring a candidate.
Measuring cost per hire is easy. Here's how to do it:
#4. Overtime Hours
Overtime hours is a tricky HR KPI to track. Different values of this KPI tell you a whole different story.
An increase in the value of overtime hours might indicate:
-
A sudden spike in workload, meaning more business
-
Poor management leads to employees working after hours
-
An increase in the absent rate made employees take more work and do overtime
At the same time, a lower value of overtime hours might indicate a streamlined business plan.
Why Is It Important?
Tracking overtime hours for every employee individually lets you know the employee's dedication to your business. Such statistics could come in handy during promotion and increment cycles.
Whereas, if you track the overall overtime hours as a whole, the increase and decrease will let you know about the business performance. High overtime hours will, in most cases, mean a high demand for your business.
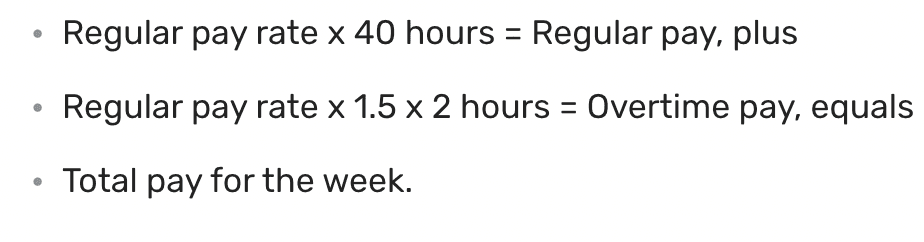
There's no formula for calculating overtime hours, but you can surely calculate the overtime pay using the formula below:
#5. Employee Productivity Rate
Employee productivity rate helps you gauge your workforce effectiveness against your business objectives. With the help of this KPI, HRs can track three essential factors relating to employees:
-
Efficiency
-
Satisfaction
-
Engagement
Why Is It Important?
In general, employees are divided into productive and procrastinators.
Measuring the EPR allows you to better understand who's doing their job and who isn't. Besides this, understanding your employee productivity gives you a deeper understanding of your workforce's level of happiness, engagement, and belief in your company's mission.
A lower employee productivity rate indicates that your existing work environment is not conducive to employee expectations. Moreover, this KPI for HR can also highlight significant cultural or corporate problems going on in your organization.
To measure EPR (as an average), divide a company's total revenue for a specific period by the total number of employees.

However, this is a basic formula for calculating EPR; you can consider other factors such as employee satisfaction and engagement to get more accurate results.
Few important things to remember before you measure this HR KPI:
-
Decreasing productivity might be the result of poor work culture, lower pay scale, or overworking
-
To measure accurately, get an idea of how much time in a week is actually productive time (deduct the breaks, obviously)
#6. Training Costs
Training cost refers to the expenses or costs incurred on training employees. This includes both training for new employees and present employees.
The 2020 Training Industry report shows that the average training cost is close to $1,678 per employee.
Why Is It Important?
Training costs are a crucial KPI to measure because it impacts your financial goals and workplace culture. A high training cost might shake your budget, while less-productive training programs may hamper employee productivity as a whole.
So it's all-important to draw a fine line between training costs and budget.
Here's a pretty simple formula to calculate training costs:
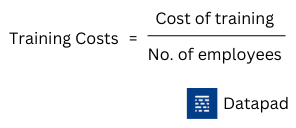
For example, let's say your training for the year costs $100,000, and you have 100 employees.
Training cost per employee = $100,000 / 100 = $1,000
You can use this HR KPI to plan your training budgets yearly. However, there are a few factors that influence your training cost:
#1. Business Size
Organizations with a large employee base might seem to spend more on training; however, the case is otherwise.
Small organizations usually spend more on training than some of the large corporations out there.
This is because large corporations have a vast employee base, and it's affordable to divide a large amount into 1000s of small chunks compared to a small business with fewer employees.
Therefore, the size of your business has a direct influence on your training costs.
#2. Industry Type
The Training cost per employee differs from industry to industry. For example, an IT company may spend money polishing employees with essential IT tips and hacks to do work efficiently.
However, a manufacturing company will teach its employees about the machines used in the production line and keep them updated with new machine upgrades via regular training.
#7. Recruiting Conversion Rate
Recruiting conversion rate measures the ratio of the total number of applicants that are actually hired at the end of the recruitment drive.
Although there's no set benchmark for an effective recruitment process, this HR KPI will help you compare different recruitment processes you have used to date and figure out the most innovative method for future drives.
Why Is It Important?
This HR KPI aims to find the source that gives you the best candidate at the lowest cost. Most organizations use recruiting conversion rate as a metric to gauge their internal recruitment strategies.
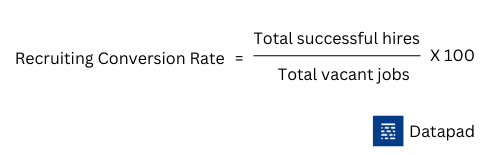
To calculate the RCR, divide the total number of successful hires by the number of vacancies in the company, and to find the percentage, multiply the result by 100. Here's how you can do it with a simple formula:
Tip: If your business suffers from a lower conversion rate, you are not getting a great return on investment.
#8. Dismissal Rate
The dismissal rate is the rate at which the employer terminates employees over a period.
Although this seems to be a casual metric that's easy to track, the dismissal rate is influenced by a series of factors, such as the expiration of employee contracts, resignations, layoffs, and retirement.
Why Is It Important?
Voluntary terminations do not have a direct impact on the company. However, involuntary terminations such as layoffs or forced resignations due to poor performance cost the company a lot of time and money to replace that employee.
Hence, HRs need to identify the rate at which employees willingly or unwillingly exit from the organization. A low dismissal rate showcases a positive recruitment strategy and work culture.
Actually, calculating the dismissal rate is pretty simple:
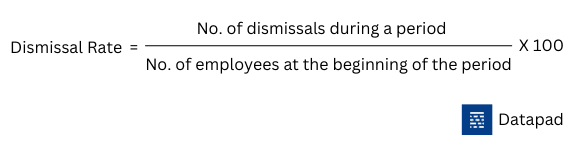
For example, a company hired 100 employees in Q1 of 2019, from which 25 exited the organization (some left willingly while others were dismissed due to inability to work).
Dismissal Rate = (25 / 100) x 100 = 25%
Therefore, the company's dismissal rate stands at 25% for 2019.
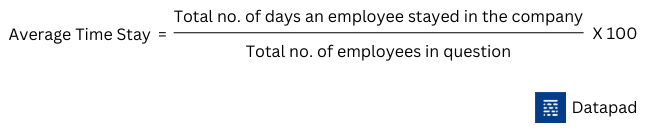
#9. Average Time Stay
Average time stay is an important indicator of the attrition of your business. The longer an employee stays, the higher the ROI on hiring and training per employee.
Why Is It Important?
Since you already know how much time and money it costs to hire and train new employees, you don't want to do the process frequently.
Besides measuring the employee journey in the organization, this metric gives valuable insights into employee retention and satisfaction.
And if used alongside other KPIs for HR such as employee turnover rate, average time stay can provide some magical insights.
Average time stay, however, is not a SMART KPI. But if you look at the benefits of measuring it against your HR strategies, the duration of your employee's tenure tells a whole story about your organization.
#10. Talent Turnover Rate
Talent turnover rate is defined as the percentage of employees who leave an organization during a period.
Why Is It Important?
In the wake of the great resignation, the talent turnover rate for organizations has touched the sky. Some reports suggest that the talent turnover rates have been 20% higher post-pandemic.
While a turnover rate below 10% is considered reasonable by HRs, a higher turnover marks a negative impression on company culture and usually leads to a less motivated and productive workforce.
Here's how you can calculate the annual turnover ratio:
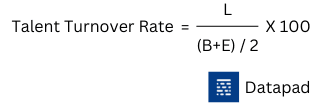
Here,
L is the no. of employees who left the company over a period
B is the no. of employees at the beginning of the period
E refers to the no. of employees at the end of the period
#11. Gender Diversity
This is a general purpose term used to measure the distribution of gender across employees or particular institutions. Diversity often insists on maintaining a balance of growth opportunities, equal pay, and equal benefits for both men and women alike.
Why Is It important
Gender diversity has become an essential and pivotal element in today's corporate structure. Gender-related biases and inclinations often get called out publicly across businesses and communities.
Gender diversity impedes a fair workplace with opportunities and disadvantages equal for all. It plays a significant role in attracting modern talent to build a healthy and collaboratively competitive workplace.
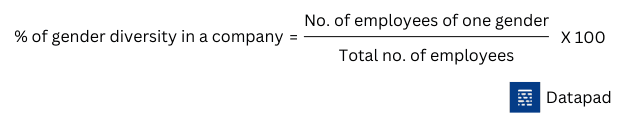
To calculate the percentage of each gender separately, use this formula:
#12. Salary Competitiveness Ratio
A salary competitiveness ratio measures how well you are compensated for your official profile/designation against industry benchmarks and peer coworkers.
Here's how to calculate SCR for two cases:
-
Salary Competitiveness Ratio (competitor) = Salary offered by your company / Salary offered by your competitor
-
Salary Competitiveness Ratio (industry) = Salary offered by your company / Average Salary offered in the industry or sector
The calculation stays pretty simple and allows you to assess and make more informed negotiations/
#13. Percentage of Vacations Used
This HR KPI is all about your employees taking some well-needed time off work.
It lets you calculate the percentage of leaves taken by employees against the leaves allotted by the company.
Why Is It Important?
Although it's a good thing to let your employees chill for a while, being too casual about their leaves might hamper your organization's productivity and efficiency. Moreover, in the long term, it might affect your set goals and objectives.
If everyone is on leave, who's working to achieve the targets?
Plus, a regularized vacation plan boosts the productivity of your employees. But only if it's under your control.
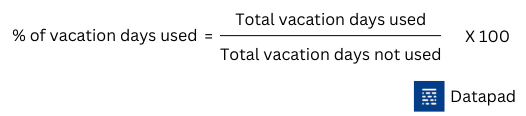
Here's a simple formula to calculate the percentage of vacation used per employee:
Apart from the above KPIs for human resources, there are some more that you might need to track less frequently.
These are:
-
Absenteeism rate
-
Employee net promoter score
-
Employee engagement
-
Employee satisfaction index
How to Create an HR KPI Dashboard With Datapad?
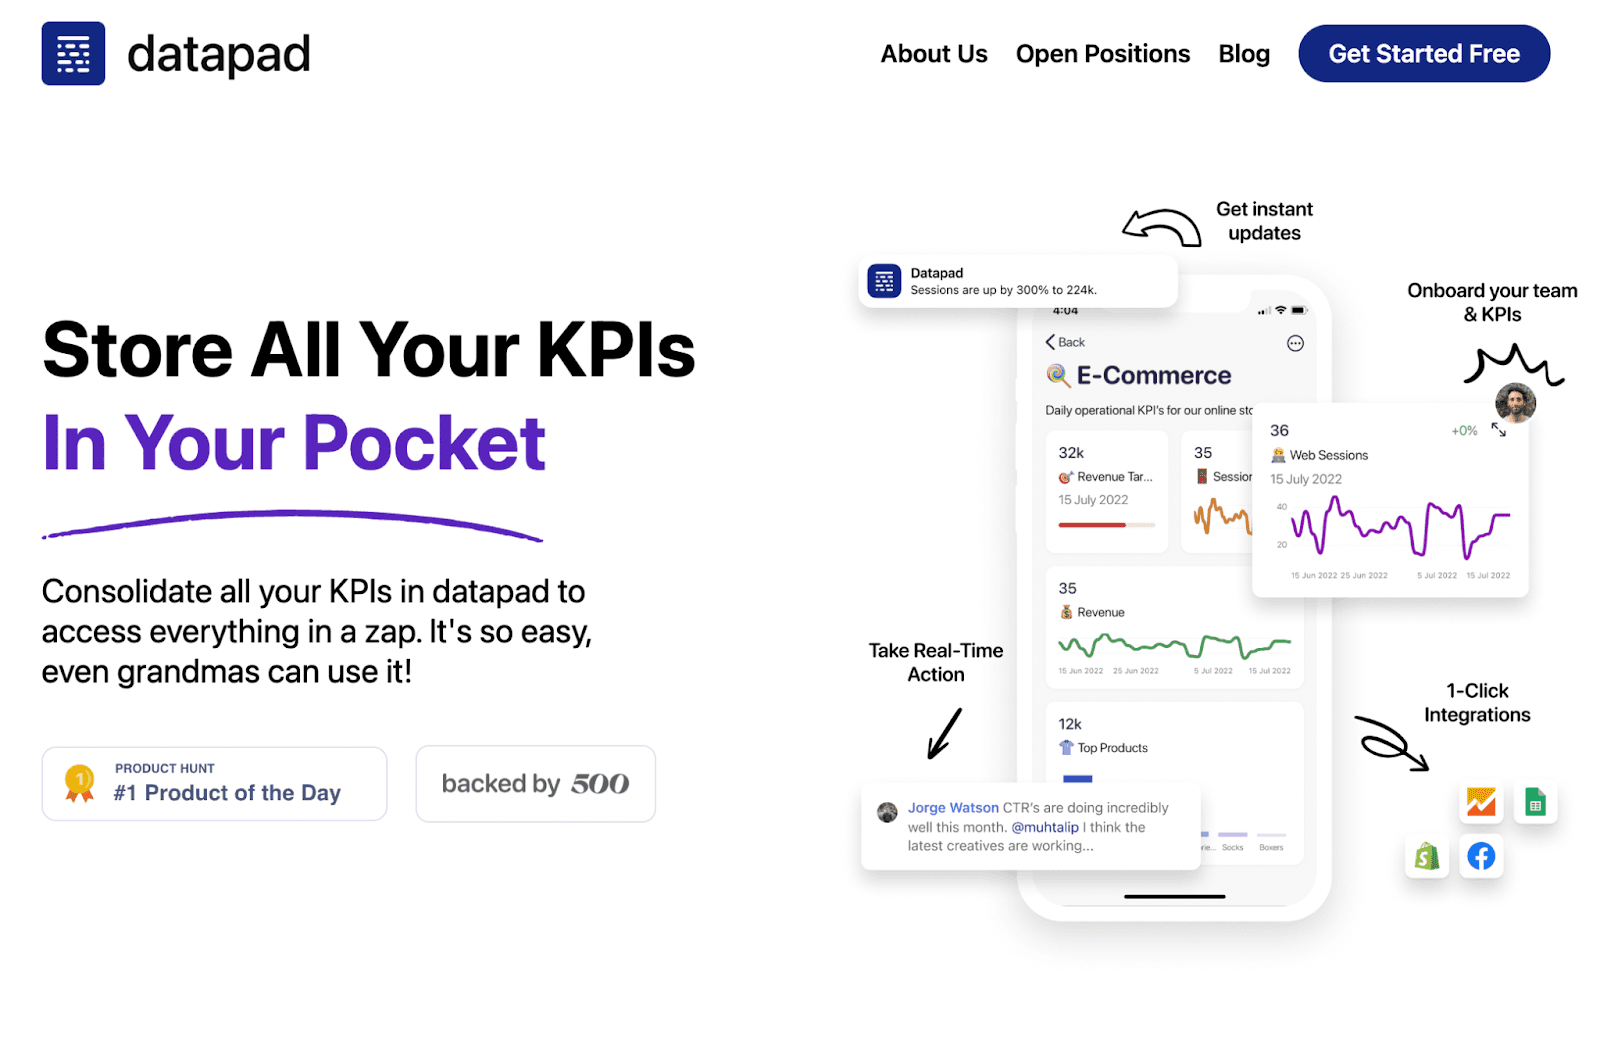
Datapad is an all-in-one dashboard creation tool that helps you create stunning dashboards and reports at the tip of your fingers.
It’s a mobile-first KPI dashboarding software designed to perform every function on your mobile that a typical desktop software does. From data collection to analysis and tracking, you can do it all.
Now that you know why Dtapad is a dear friend to your dashboarding needs, let's understand how you can create an HR KPI dashboard with it.
Step 1: Create a Dashboard
To get started, download our app (available for iOS and Android), and sign up with your email.
Once logged in to the app, press the '+' sign on the top right corner.
Here, you can add a title for your dashboard and other details; click on Create, and it's done!

Step 2: Bring Your Team On Board
With Datapad, team onboarding is no more a headache. We understand that it's tough to track and manage every KPI on your own as a business owner.
And so, with Datapad, you can bring your HR team onboard in seconds, hand over the dashboard to them, and then take charge of all the HR KPIs in the box.
Meanwhile, you can always supervise their activities and actions from an admin viewpoint.

Step 3: Import Data from Multiple Data Sources
Once your team is all ready and set, it's time to flow some data into your dashboard.
Datapad lets you import data both automatically and manually.
Let's first see how you can import data automatically via our one-click integrations.

And if you have a comparatively smaller dataset, here's how you can import data manually with Datapad:

Besides this, our tool has tons of pre-built data visualization elements such as charts, bars, tables, and more to help you visualize your data quickly and efficiently. Plus, you are free to customize every section of your dashboard, from colors to texts and more.
What's more, Datapad's search feature allows you to quickly search for any KPI on the dashboard, regardless of where they hide.
So, break the stereotype of desktop dashboarding and join us on a power-packed dashboarding journey with Datapad.
Read more:
13 Most Important SEO KPIs Every Business Owner Should Track in 2022
13 Email Marketing KPIs Every Marketing Professional Should Track
13 Software Development KPIs Every Dev Team Should Track
15 KPIs for Logistics Every Logistic Manager Should Measure
15 Best KPIs for Operations that Are a Must for Every Business to Track
13 Best Product Manager KPIS You Should Be Tracking In 2022
15 Important Retail KPIs & Metrics to Track For Better Understanding of Your Business
10 Startups KPIs You Need to Track [We Asked to the Experts]
13 Recruitment KPIs Every HR Professional Should Track