
When was the last time you struggled managing your retail store?
Probably during the pandemic, when consumers were bound to spend on food and necessities - while everything else faced heavy downtime.
But now that you are back in the business, you understand why measuring key performance indicators is as crucial for retail stores as it is for e-commerce websites.
So, in this article, we will talk about retail KPIs, how they are important, and list down the 15 most important retail KPIs you must track with formulas.
Let’s dive in.
What are KPIs In Retail?
What does KPI mean in retail?
A retail KPI is a quantifiable measure used to track critical retail processes and performance efficiently. Such KPIs allow retailers to get an overview of how their business performs during a given period.
Different types of KPIs can be used to measure the goals of a business against the actual, quantifiable data for a given timeline.
Key performance indicators can differ according to the industry; for instance, a retailer's KPIs will vary from the manufacturer's.
Here's how a typical retail KPI is calculated:
Many retail businesses use average transaction value KPI to know how much a customer spends on an average every time they visit the retail store.
Let's assume that the average transaction value metric indicates that the customers spend a lot.
In that case, it can imply that either the store's higher-value products are popular or customers are buying products in large quantities.
A lower average transaction value indicates the exact opposite. To calculate the average transaction value, the total sales of the retail store are divided by the number of transactions in a given period.
Why Should a Business Track Retail KPIs?
A retail business should consider tracking different key performance indicators because of the following mentioned reasons:
-
Monitoring Financial Health: Tracking KPIs in four critical categories - employees, customers, processes, and revenue, help the retailer know about the business's financial status
-
Measure Retail Business Progress: Tracking KPIs like gross margin, revenue, the performance of employees, etc. can help the retailer know about the business's progress
-
Analyze Helpful Patterns: For example, measuring the same KPIs quarterly can help a retailer detect specific patterns in the numbers
What Are the Most Important KPIs in Retail to Track?
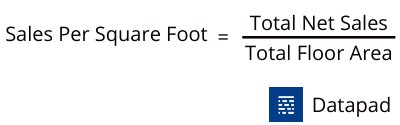
KPI #1. Sales Per Square Foot
One of the retail industry's most successful and often used KPIs is sales per square foot.
It calculates how much sales revenue a retail business can earn per square foot of available retail space.
To determine a location's efficiency, the income of a retail business is compared to the quantity of floor space utilized by the same store using this retail KPI.
Why Track Sales Per Square Foot?
The reason why a retail business needs to track sales per square foot metric is that it demonstrates how effective a retail store layout and retail personnel are at selling the products.
As a result, this KPI is vital when renovating or redesigning a retail outlet and helps indicate if that redesign was successful.
Here's a formula to calculate it:
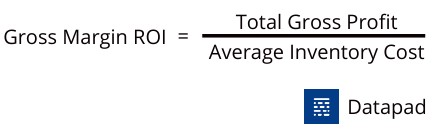
KPI #2. Gross Margin Return On Investment [GMROI]
The gross margin ROI measures a retailer's profit from the amount invested in filling up the inventory. It simply tells you how much return in cash a retailer can earn for every penny spent on the inventory.
Why Track Gross Margin ROI?
Gross margin ROI is one of those KPIs that helps understand whether a business is generating profit or not.
If the ratio is above one, that means the retail store is selling its products at a price higher than the amount it spent to acquire the same (i.e., profitable).
Therefore, this particular KPI becomes very important for investors and managers.
Here's how you can determine gross margin ROI:
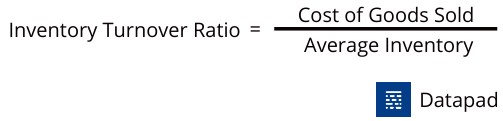
KPI #3. Inventory Turnover Ratio
The inventory turnover ratio measures how often a retailer can sell the entire in-stock inventory within a given period. This particular KPI is related to a business's supply chain and indicates its ability to generate sales and revenue.
Why Track Inventory Turnover Ratio?
The inventory turnover ratio helps business owners decide on pricing factors and manufacturing costs. This helps them tackle the on-season and off-season consumer demands.
Here's the formula to calculate the same:
KPI #4. Net Profit Margin
Net profit margin represents a company's financial standing after deducting all expenses incurred in operations, interests, taxes, payouts, and other miscellaneous works.
Why Track Net Profit Margin?
By far, the net profit margin is the most important retail metric because any increase in revenue won't necessarily translate to profit.
While gross profit accounts for the revenue earned after deducting product creation and sales costs, net profit, on the other hand, provides a more comprehensive balance sheet. It shows the profit earned after every single business expense is accounted for.
Hence, measuring your net profit margin on an annual basis can help you channel your resources, plan cost cuts, and introduce business strategies accordingly.
A SMART KPI for measuring net profit margin can be something like this:
Increase net profit by 20% by 2023 Q1.
Calculating this retail KPI starts with finding your net profit for the year.
Net Profit = Total Revenue - Total Expenses (operating expenses, taxes, and other expenses)
Now, put your net profit value to work:

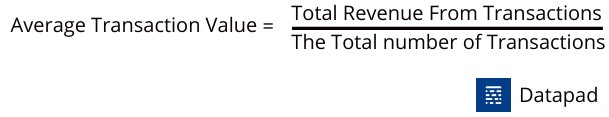
KPI #5. Average Transaction Value [ATV]
The Average Transaction Value gives you an idea about the total expenditure per customer for your retail store.
Why Is ATV Important?
Measuring this retail KPI is important because if you know how much people spend on your business, you can encourage them to increase their average purchase through merchandising strategies, identifying popular products, or shopping promotion programs.
Remember, a high average transaction value means customers are buying more or higher-value products from your business. In contrast, a low transactional value tells the exact opposite of the statement we just mentioned.
Consistently measuring your transactional value can also uncover valuable insights, such as your share of cost and profits from every sale and the trigger points in customers' buying cycle.
You can calculate the average transaction value by dividing the total revenue from transactions by the number of transactions over a period.
Here’s an example to give you a proper idea:
Suppose a sale of $50,000 is generated from 20 customer transactions.
Here, the average transaction value = $50,000 / 20 = $500.
But, here are a few things you would like to avoid:
-
Not considering the costs of transaction or process
-
Sampling transactions together as a single sale
-
Up-selling products or services to increase the average transaction value
KPI #6. Customer Retention Rate
One of the best feelings any retail store owner can have is watching their one-time customer become a regular customer.
None can match the joy of it, and hence, the customer retention rate is yet another crucial retail metric to keep an eye on.
Customer retention is the rate at which your existing customers purchase your product repeatedly over a period.
Why Track Customer Retention Rate?
Most business owners find this retail KPI unique because it tells them how well their business holds on to existing customers. Thereby helping them plan their customer benefit programs, offers, and schemes accordingly.
Besides that, here're a few unavoidable reasons to retain customers:
-
The probability of selling to an existing customer is 14X higher than that of selling to a new customer
-
An increase in customer retention rate by 5% equals a rise in profits by 25%.
-
New customer acquisition costs have increased by almost 50%
With all the above reasons, you might be gushing for a formula, right?
So here it is.
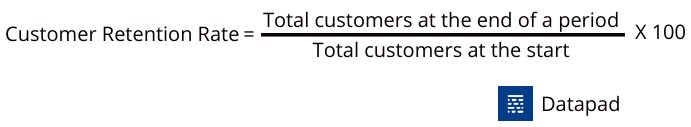
Note: Do not count new customers acquired during that period in the calculation.
KPI #7. Return Rate and Refunds
Return Rate refers to the percentage of sales orders that have a product return. Apart from measuring the return percentage, this retail KPI lets you measure the level of customer satisfaction from using or consuming your products.
Why Track Return Rate?
There are five main reasons for businesses to calculate return rates. They are as follows:
-
Measure the level of customer satisfaction
-
Identify the reasons that drive returns
-
Determine customer need-fulfillment rate
-
Make improvements based on data-driven insights
However, achieving a 0% return rate is easier said than done, just as a benchmark; a return rate between 5-10% is a great percentage.
Besides this, a low return rate also helps you minimize your return order cost (transportation, billing, taxes) and build a trustworthy brand image.
Here's a simple formula to calculate the return rate for your retail store:
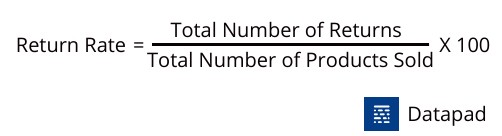
Here’s an example:
Suppose you fulfilled 100 orders for the year 2022. During this period, 20 orders were returned due to unknown reasons.
Therefore, the return rate = (20 / 100) x 100 = 20%
KPI #8. Sales Per Employee
Don't you think a little bit of competition between your employees can be healthy for your business?
This retail KPI is wholly and solely built to serve this purpose.
Tracking sales per employee lets you evaluate individual employee performance and sales made by individual employees over a certain period.
Why Track Sales Per Employee?
Sales per employee is an important metric to track for retail stores and banks due to their high-labor volume. It gives them in-depth insights about leading and lagging employees, thereby making better training, compensation, promotions, and hiring decisions.
In fact, an increase in the KPI is a positive indicator of a company's workforce capability. Companies with a higher sales per employee ratio can work with fewer employees and still earn healthy profits.
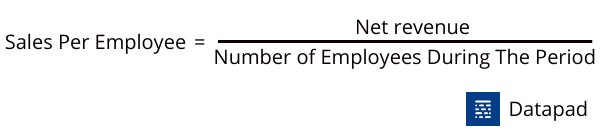
To calculate sales per employee, divide the net revenue earned by the number of employees during the period.
A SMART sales per employee KPI may be to:
-
Increase the number of sales per employee to 10 per day by the end of December
-
Increase the sales revenue per employee to $5000 per week by the end of January
KPI #9. Sell Through Rate
Sell through rate measures the percentage of inventory sold versus the amount of inventory purchased from the suppliers during the same period.
Why Track Sell Through Rate?
Sell through rate is an incredible metric as it can help you evaluate the performance of every product you sell.
Here are some of its benefits:
-
You get to know what are the top-selling products of your retail store
-
You identify the pace at which products get out of stock
-
You purchase valuable inventory that can sell quickly and easily
Plus, you get a lot of customers because you stock up on the product that is most in demand; by calculating your sell-through rate, of course.
Here's a simple formula to calculate it:
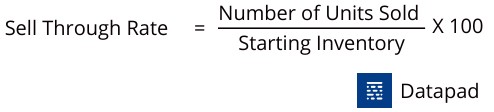
For example, let's say you're the owner of an electronics retail store. You ordered 100 LED TVs to sell in your store.
At the end of the year, you only sold 40 TV sets. Unfortunately, the other 60 pieces were carried forward to the following year.
If we fit the numbers in the formula and perform the math correctly, your sell-through rate would be 40% - an ideal percentage for the industry cited in the example.
KPI #10. Customer Satisfaction
Customer satisfaction refers to the process of measuring the emotions of customers via Net Promoter Score.
Net Promoter Score (NPS) is a widely used research metric based on a single or multi-survey question with a scale ranging from 0 to 10 or -100 to +100; 0 meaning unsatisfied customers, and 10 meaning highly satisfied customers.
Why Track Customer Satisfaction?
Customers are the bread and butter for any retail business out there. This applies to all sizes of companies from every industry.
Technically speaking, measuring customer satisfaction can help you identify your loyal customers, churn rate, dwell times, and improvement opportunities.
For the most part, customer satisfaction and retention go hand in hand.
KPI #11. Foot Traffic
Foot Traffic is the most realistic retail KPI to measure and track frequently. We mean, what's more realistic than counting the total number of customers in-store. Meaning, the number of visitors in your retail store.
Why Track Foot Traffic?
Tracking foot traffic helps you figure out the popularity of the location where your store is situated.
For example, if you open a store in a certain location and don't get as many people coming in as other locations do, it might not be the best place for your business.
This retail KPI measurement can be performed manually, like:
-
Count the number of people who visit your store every day
-
Use gate-way sensors to count the people entering and leaving your store automatically
-
Use security cameras to calculate the foot traffic at all times
To ease the data collection process, you can measure and analyze this retail metric on a weekly or monthly basis.
Pro Tip: Working and improvising on your window display items highly influences your foot traffic rate.
KPI #12. Shopper Dwell Time
Whether a brick-and-mortar store or an online store, you always want people to stay longer, browse through sections, and interact with your store as much as possible.
Shopper dwell time is an excellent retail metric for tracking how long customers engage with your store.
Why Track Dwell Time?
Typically, the longer a customer stays in your store (physical or online), the higher your chances are of making a sale.
This absolute retail KPI can provide insights into your customers' buying intent, behavioral patterns, and purchasing process.
From a retail store perspective, dwell time helps store owners figure out how much time a customer spends hanging around or seeing through products in a particular store area.
This helps them better understand which areas of their physical store hook customers and which areas are blind spots.
Dwell time is often represented with session durations and heat maps, highlighting the areas of the store with the most foot traffic and how long your customer linger around specific areas.
You can easily measure your store dwell time using tracking and analytics tools like Google Analytics.
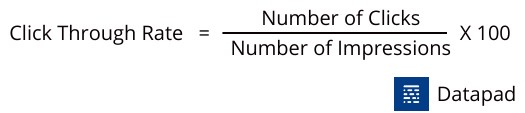
KPI #13. Click-Through-Rate
Considering the fact that every retail store out there holds an online presence in the virtual space, click-through rate is no longer just an ecommerce KPI.
The click-through rate defines the number of times your ad was clicked vs. the number of times it was seen.
Why Track Click-Through-Rate?
This becomes an important metric to measure as it tells you about how much traffic your online marketing strategies generate for your offline store.
It also helps you determine how well your marketing campaigns are performing and whether they are targeting the right customer segment or not.
Here's a simple formula to measure this retail KPI:
Some quick tips to get a higher CTR:
-
Work on crafting persuasive ad copies
-
Position your CTAs at places that catch the viewer's attention (below the header, after offers, a pop-up CTA)
-
Keep your CTA no more than 3-5 words
KPI #14. Quick Ratio
The quick ratio measures your business's ability to immediately meet its current liabilities without selling any inventory.
Why Track Quick Ratio?
Tracking this retail KPI helps you better understand your company's finances by considering both cash flows and liabilities. Moreover, a quick ratio shows how sales, marketing, product, and customer teams are doing.
To calculate the quick ratio, use the below-given formula:
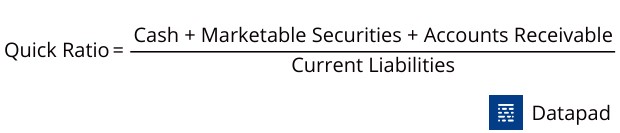
Note: A quick ratio > 1 resembles good financial health for your business.
KPI #15. Cash Conversion Cycle [CCC]
The Cash Conversion Cycle (CCC) lets you dive deeper into your retail accounting and finances. The CCC retail KPI measures how many days it takes to convert goods back to cash.
Why Track Cash Conversion Cycle?
Selling goods on credit is a part of the business. However, if those credits don't convert into cash for the long term, it might hamper your overall business health.
Hence, you don't want to be sitting on goods for a long term, so CCC delivers you with critical insights before you get on the verge of bankruptcy.
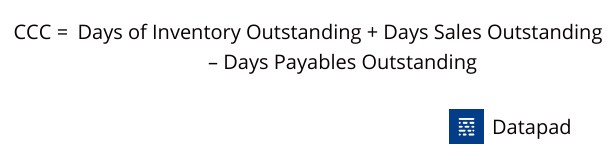
Here,
Days of Inventory Outstanding (DIO) refers to the time it takes to convert your inventory into sales.
Formula: DIO = (Average Inventory Cost / Cost of goods sold) X 365 Days
Days Sales Outstanding (DSO) refers to the time it takes to receive payments after the sale.
Formula: DSO = (Amount Receivable / Total Credit Sales) X Number of Days in Period
Days Payable Outstanding is the time it takes for you to pay your suppliers.
Formula: DPO= (Amount Payable X Number of Days in Period) / COGS
Apart from the above-mentioned 15 retail KPIs, there are other that you might need to track from time-to-time:
-
Conversion rate
-
Year over year growth
-
Total units sold per year
-
Repeat customer percentage
How to Create a Retail KPI Dashboard in Datapad?
Datapad is a mobile-first KPI dashboarding and reporting software that allows hustling entrepreneurs to collect, track, manage and analyze crucial business KPIs instantly.
Its mobile-first interface helps you perform every function on your mobile that a typical desktop dashboarding software does - from data extraction to monitoring and customizations, you have it all under your fingertips.
Now that you know why Datapad is a dear friend to business owners and marketers, let's understand how you can create a retail KPI dashboard with it.
Step 1: Create a Dashboard
To begin with, the dashboard creation process, download our app from the play store (for Android users) and app store (for iPhone users) and sign up with your email address.
Open the app, and press the '+' sign on the top right corner.
Here, you are asked to give your dashboard a name and add a few other details to personalize your experience.
Note: You need to follow up with this every time you create a new dashboard.
Fill in the boxes and click on Create. That's it! Your dashboard has been created automatically.
Step 2: Bring Your Team On Board
Team onboarding is a seamless process in Datapad. It takes a few minutes to bring in all your retail store employees, hand over the dashboard to them, and then take charge of all the retail KPIs from the front end.
Meanwhile, you're always welcome to supervise your employees’ activities and actions from an admin viewpoint.
Step 3: Import Data from Multiple Data Sources
Once your team is ready and set, it's time to flow some retail store data into your dashboard.
Our tool lets you import data both ways - automatically and manually.
Let's first see how you can import data automatically via our one-click integrations.

And if you have a comparatively smaller dataset, here's how you can import data manually with Datapad:

Step 4: Customize on The Go
Once you have all the data in your dashboard, it's time for customizations.
You need to customize your KPI cards and dashboard because once you have the data, you can view a full-fledged dashboard. Hence, it's easier to choose specific visualizations that fit best for presenting the data provided.
To ease your customization efforts, Datapad has tons of pre-built charts, bars, tables, and other data visualization elements to help you visualize your data quickly and efficiently.
Plus, you own the freedom and flexibility to fully customize your dashboard, from colors to texts and more.
What's more, Datapad's search feature allows you to quickly search for any KPI on the dashboard, regardless of where they hide.
Do you see? How easy it is to create a retail KPI dashboard with Datapad.
Now, either you can opt for a boring dashboarding software that requires you to read lengthy step-by-step guides, or you can smartly create a dashboard with Datapad in just 4 easy steps by joining us today. Totally up to you! 😉
Top 13 HR KPIs & Metrics You Should Track For Your Team
13 Most Important SEO KPIs Every Business Owner Should Track in 2022
13 Email Marketing KPIs Every Marketing Professional Should Track
13 Software Development KPIs Every Dev Team Should Track
15 KPIs for Logistics Every Logistic Manager Should Measure
15 Best KPIs for Operations that Are a Must for Every Business to Track
13 Best Product Manager KPIS You Should Be Tracking In 2022
10 Startups KPIs You Need to Track [We Asked to the Experts]