![15 Best Marketing Dashboard Software in 2023 [In Depth Guide]](/_next/image?url=https%3A%2F%2Fframerusercontent.com%2Fimages%2F5tEue2HYJvhxk3LBNGaM3E1Q0E.png&w=3840&q=75)
Some of the best marketing dashboard software for visualizing your metrics and KPIs are Datapad, WhatConverts, Klipfolio, Databox, Tableau, Looker, Whatagraph, Cyfe, Sywdo, ClicData, Grow, GoodData, Domo, Sisense, and Geckoboard.
In this guide, you will find a detailed review of all the above-mentioned marketing dashboard software and know which one's the best for your business.
So let’s dive in!
What is a Marketing Dashboard Software?
A marketing dashboard software pulls data from multiple data sources, including web analytics, social media, advertising, and other marketing channels, in real time and displays it on a unified dashboard.
Now since your data is collected in one place, your reporting process becomes significantly easier. You don't have to go back to the lengthy process of manual data entry into Excel (that's one job less).
Moreover, these software emphasizes using visual aids like charts, graphs, heatmaps, tables, timelines, and other data visualization elements to demonstrate your marketing efforts effectively.
Besides, a typical marketing dashboard is a treasure-trove of KPIs and metrics; some of the most popular ones include:
-
Website traffic [SEO or Inorganic]
-
Click-through rate [For email marketing, social media marketing, and more]
-
Bounce rate
-
Conversion rate [PPC campaigns, newsletter conversion, etc.]
-
Return on advertisements [ROAS]
And many more…
Apart from these core skills, an excellent marketing dashboard software must adhere to some other qualities, or what we may term Soft Skills.
Coming to the main part, choosing a marketing dashboard software is a process in itself, and here are some factors to consider when doing it.
Factors to Consider When Choosing the Best Marketing Dashboard Tool
#1. Is It Easy for You to Set Up?
For starters, an easy setup gives you a head-start and the confidence to utilize any software to its max potential.
A lot goes on before you can process insights, like connecting to data points, onboarding the team, assigning authorities, and more.
And so, before picking a software, check for its setup reviews and support quality - these two things will give you an idea of what you’re dealing with in terms of CX.
In fact, some SaaS companies offer 10 to 15 mins software setup time, which is not bad. But since there are a lot of KPI dashboard software options in the market, you should always aim for the best.
#2. Would It Give You Quick Access to Your Dashboards?
Imagine sitting and staring at your dashboard that’s buffering forever…
With such a loading speed, it would take you hours just to track a single KPI, let alone multiple marketing dashboards.
Therefore, instead of testing your anxiety levels, ensure that the software is highly responsive.
Talking of responsiveness, it's a common problem among desktop-ridden dashboards requiring multiple sign-in, more screen time, and lousy loading time.
Check if the software has a mobile version, allowing you to access your marketing dashboard from anywhere and anytime.
#3. Beautiful Dashboards
Although it might sound a little off at the start, a better-looking dashboard makes your marketing efforts look better. It's human physiology; things that look better are better.
Several agency marketers consider this an important factor when choosing marketing dashboard tools.
By beautiful dashboards, we don't really mean adding creatives into them. A beautiful dashboard can be minimalistic, neat, and simple; the right blend of colors and elements makes your dashboard easily navigational for the eyes.
Moreover, everyone wants to impress clients with better-looking dashboards. So choose a marketing dashboard software that’s visually appealing.
Enough about the factors; let's look at some of the best marketing dashboard software out there in the market.
What Are the Best Marketing Dashboard Software?
#1. Datapad
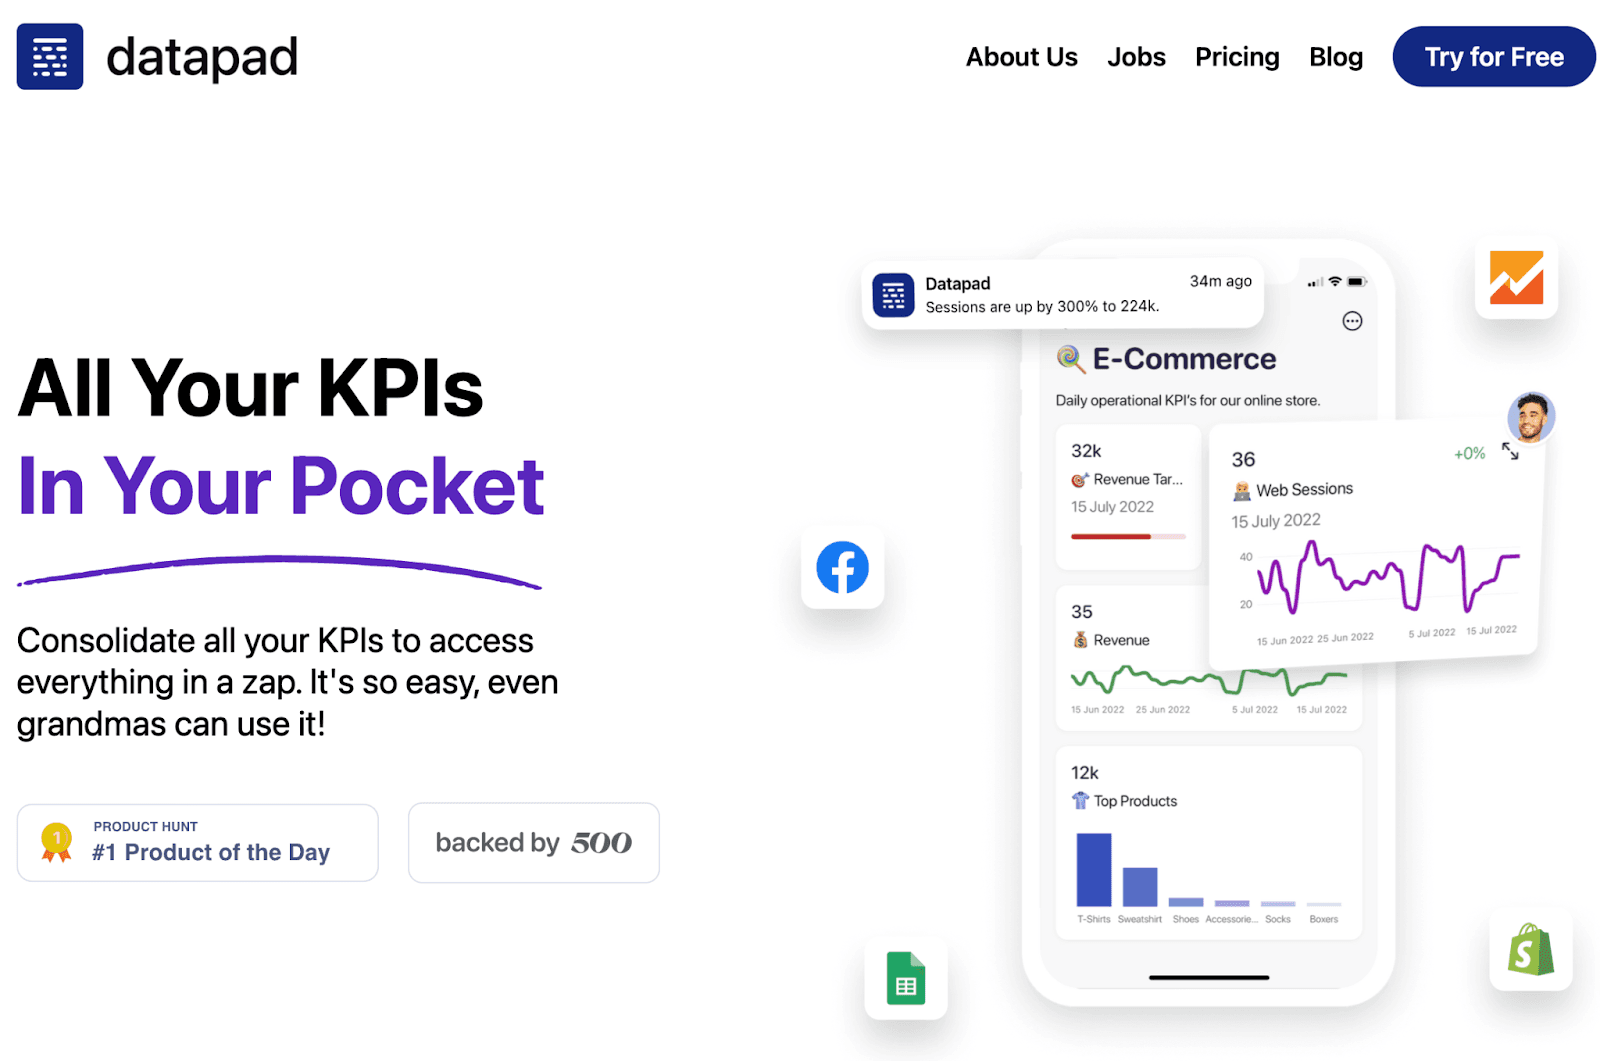
Datapad is a mobile-friendly marketing dashboard software that allows marketing managers to collect, monitor, and visualize marketing data via beautiful dashboards on mobile phones.
Who Is It For?
Datapad is for small to medium-sized businesses that aim to track and monitor marketing campaigns and KPIs on the go. Besides, it's a no-code software best for beginners getting started with marketing analytics.
Key Feature #1. Instant Access
Being a mobile-first platform, Datapad allows you to access your marketing dashboard from your smartphone.
So, it doesn't matter if you're away for a treak 🧗🏻♂️ or lying inside your blanket on an icy morning 🥶, you can still access all your KPIs from your mobile.
From our end, we ensured Datapad is pixel-perfect for all small-screen devices, meaning no half-volley dashboards or graphs.
What's more, you can even search for KPIs via our search feature and view them on your phone in seconds.

Key Feature #2. Ease of Data Import
Datapad assists you with easy data import functionality. You can import data both ways: automatically and manually.
Our one-click integrations with multiple data sources like Google Analytics, Google Sheets, Facebook Ads, and more allow you to pull in data with a click.

Or even in case of mishandling of data or some data being missed out (human errors), you can always switch to manual data entering and processing.

Under both scenarios, it's a win-win situation for you! 🥇
Key Feature #3. Team Onboarding
As we said, easy setup requires an effortless team onboarding process. And with Datapad, team onboarding is simpler than ever.
You can easily send email invites to teammates and stakeholders who you want to be a part of your marketing dashboard. Once your team is onboard, you can easily delegate tasks, appoint admins, and monitor team activities hassle-free.
Our tool also allows you to collaborate with your team in near real-time. To do so, you can comment under specific KPIs to broadcast your message across teams. Similarly, your mates can start a discussion under a metric.
Other than this, Datapad's team collaboration feature has even more to offer:
-
Set threshold point for KPIs to trigger alerts
-
Enable role-based management to control who can view/edit/access dashboards
-
Get real-time alerts and notifications for team messages
Key Feature #4. Customizations
Undoubtedly, customization and personalization are essential factors when cherry-picking marketing dashboard tool.
Datapad's intuitive drag-and-drop customizations allow you to change the look and feel of your dashboard quickly.
Besides, it has several pre-built data visualization elements like bars, charts, tables, and more to help you quickly build beautiful dashboards.
Pros and Cons
Pros
✅ Easy access to your dashboards
✅ Keep everything on your phone for instant access
✅ Set up alerts and push notifications to stay on top of your business
✅ Completely free
Cons
❌ No web version right now (coming soon)
❌ Not good for creating sophisticated dashboards
❌ Doesn’t have several integrations (coming soon)
#2. WhatConverts
WhatConverts is a lead tracking, management, and marketing analytics platform that allows businesses to capture marketing attributions and present them via real-time reports and dashboards.
Who Is It For?
WhatConverts is best suited for small businesses, advertising agencies, and individual marketers for capturing and analyzing marketing-qualified leads.
Features
-
Easily track and capture marketing qualified leads via calls, forms, and website; Track which source and channels bring buyers to your site
-
Store and manage all captured leads in one place; filter leads by product, service, lead page, campaign, or keywords
-
Generate monthly summary marketing reports or create custom reports and view them directly in your WordPress dashboard
-
Get instant notifications for new leads via email or third-party messaging apps; Quickly export leads from the marketing dashboard to other data points with a click
Pros and Cons
Pros
✅ Excellent customer support team
✅ User-friendly interface despite many features
✅ Free trial included
Cons
❌ A steep learning curve due to the number of features
❌ Lack of learning content like tutorials and how-to blogs
#3. Klipfolio

Klipfolio is a business intelligence (BI) platform that assists businesses in making data-driven decisions. Klips, a product of Klipfolio, is a custom dashboard builder that lets you create dynamic marketing dashboards for you and your team.
Who Is It For?
Over 50,000+ customers around the globe trust Klipfolio. It's a great tool with reasonable pricing, best for medium to large-size teams and enterprises.
Features
-
Over 300+ integrations to popular marketing channels which let you source data from REST/URL, upload spreadsheets or feed custom queries
-
Use Klip Editor to add functions, filtering, and sorting to streamline complex data
-
Has an extensive gallery of 32+ pre-built chart types, gauges, funnels, and other visualization elements
-
Quickly customize your dashboard with pre-built marketing dashboard templates that you can modify with HTML, CSS, or Javascript
-
Enable role-based management to control who can access data and easily share dashboards via PDFs or published links
Pros and Cons
Pros
✅ Easy and simple UI/UX design
✅ Affordable pricing
Cons
❌ Might get slow when running complex problems
❌ Requires some level of expertise and coding jargon; not the best buy for beginners
#4. Databox
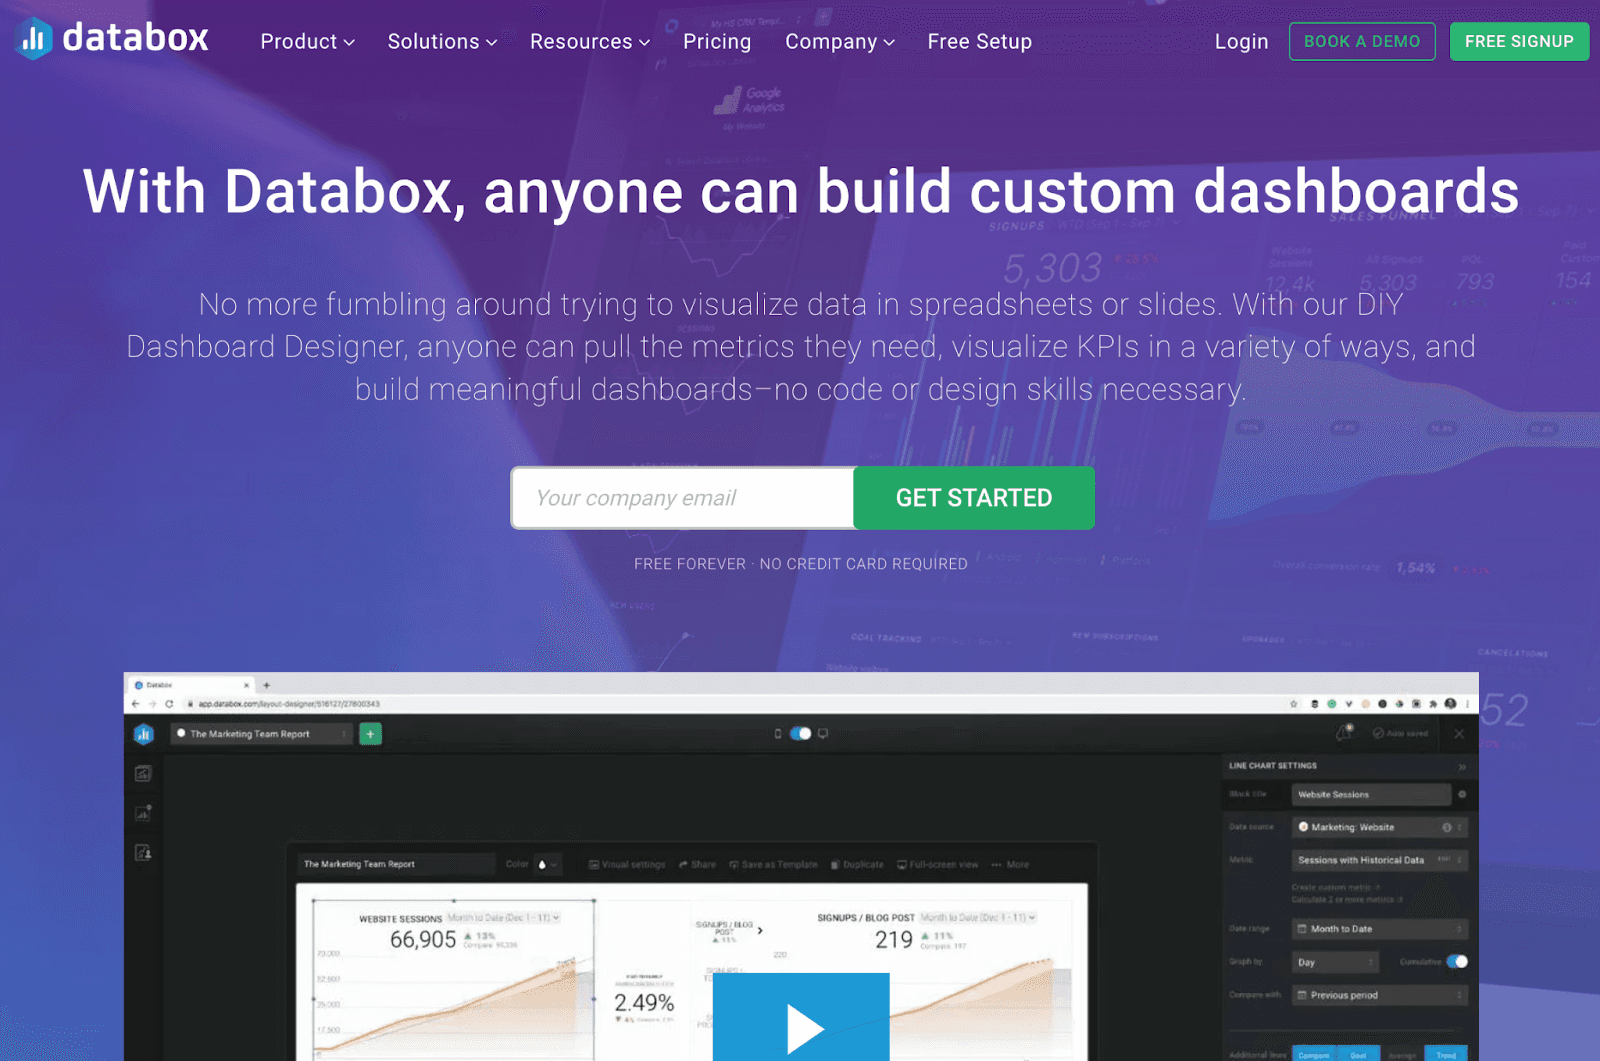
Databox is a modern-day reporting and analytics platform that allows users to connect data easily, create reports, monitor trends, and build beautiful marketing dashboards.
Who Is It For?
Databox is used by 20,000+ businesses globally. It's an excellent choice for marketing agencies with 50+ employees and tons of data ready to be extracted and transformed into insights.
Features
-
Over 70+ one-click integrations to popular marketing platforms; add custom data via SQL database, send data via APIs, Zapier, and many more integrations
-
Use its intuitive dashboard designer tool to visualize data and easily customize dashboards - no code required
-
Has an extensive gallery of 200+ pre-built templates, hundreds of configured data blocks, and thousands of default metrics
-
Efficiently perform calculations using the drag-and-drop formula builder and create custom metrics with query builder to discover hidden insights
Pros and Cons
Pros
✅ Comes with in-built integrations and data import functionality
✅ KPI scorecards are an attractive feature to engage marketers
Cons
❌ Lacks some customization options when compared to its competitors
❌ Should be aware of technical jargon in marketing before using it
#5. Tableau
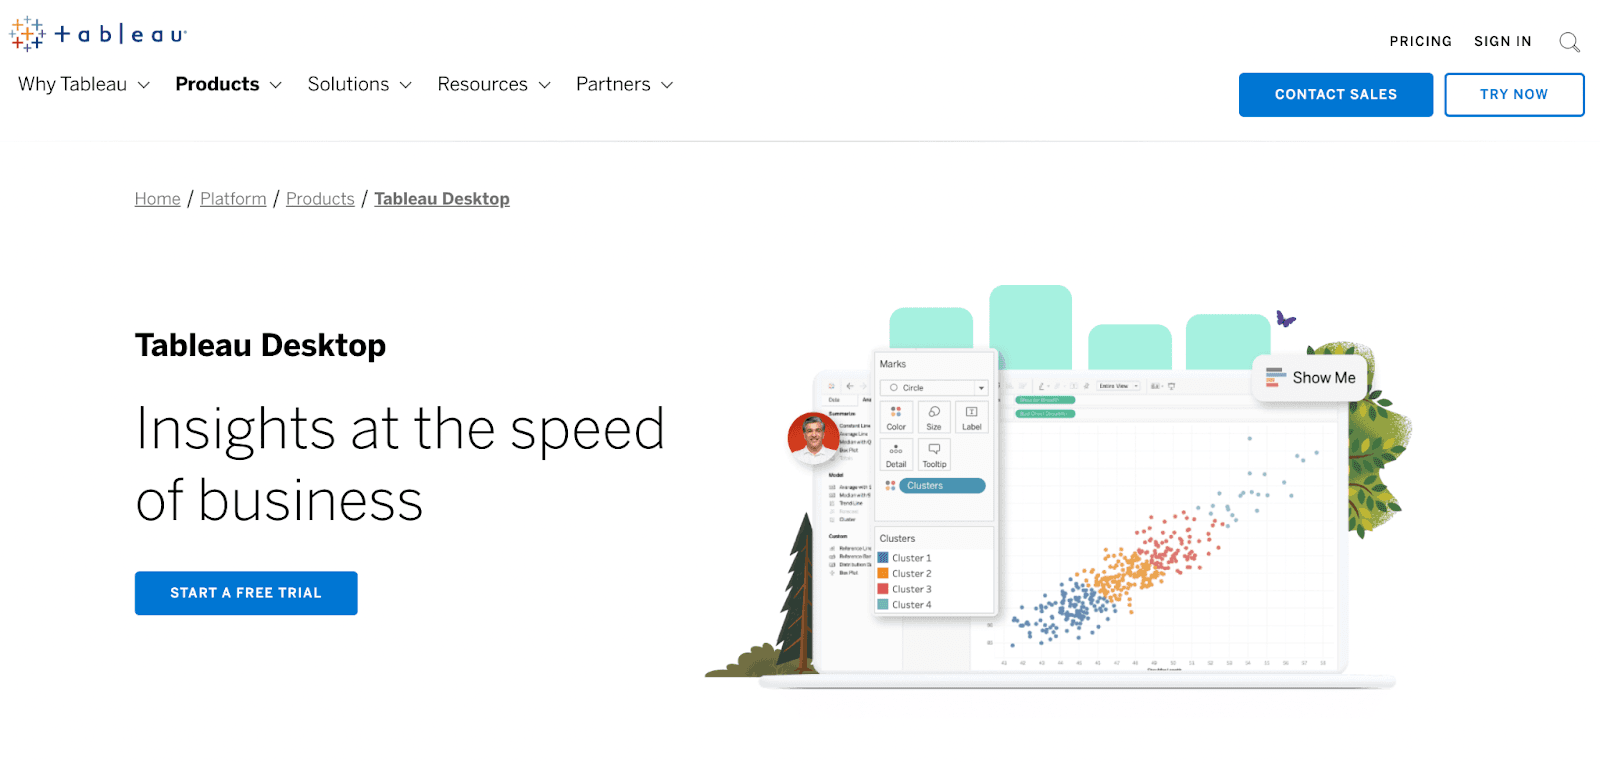
Tableau is a closed-based data visualization and reporting platform that lets you connect to any data source and create interactive, shareable dashboards.
Who Is It For?
Tableau is an advanced tool for data scientists and marketing agencies whose success depends on data-driven campaigns.
Features
-
Leverage data exploration capabilities to easily combine and clean data for processing
-
Create custom metrics and perform complex calculations using advanced analytics
-
Use the power of augmented analytics to uncover hidden insights
-
Has AI-driven predictive modeling, enabling what-if analysis, guided model building, and AI-powered predictions
-
Get real-time notifications of data-driven alerts and team activities via Slack channels
Pros and Cons
Pros
✅ Easy to use and set up
✅ Hassle-free connection to data sources
✅ Apt use of AI and machine learning to drive granular insights
Cons
❌ Does slow down a little when performing heavy data analysis
❌ Lacks data retrieval and processing capabilities
#6. Looker
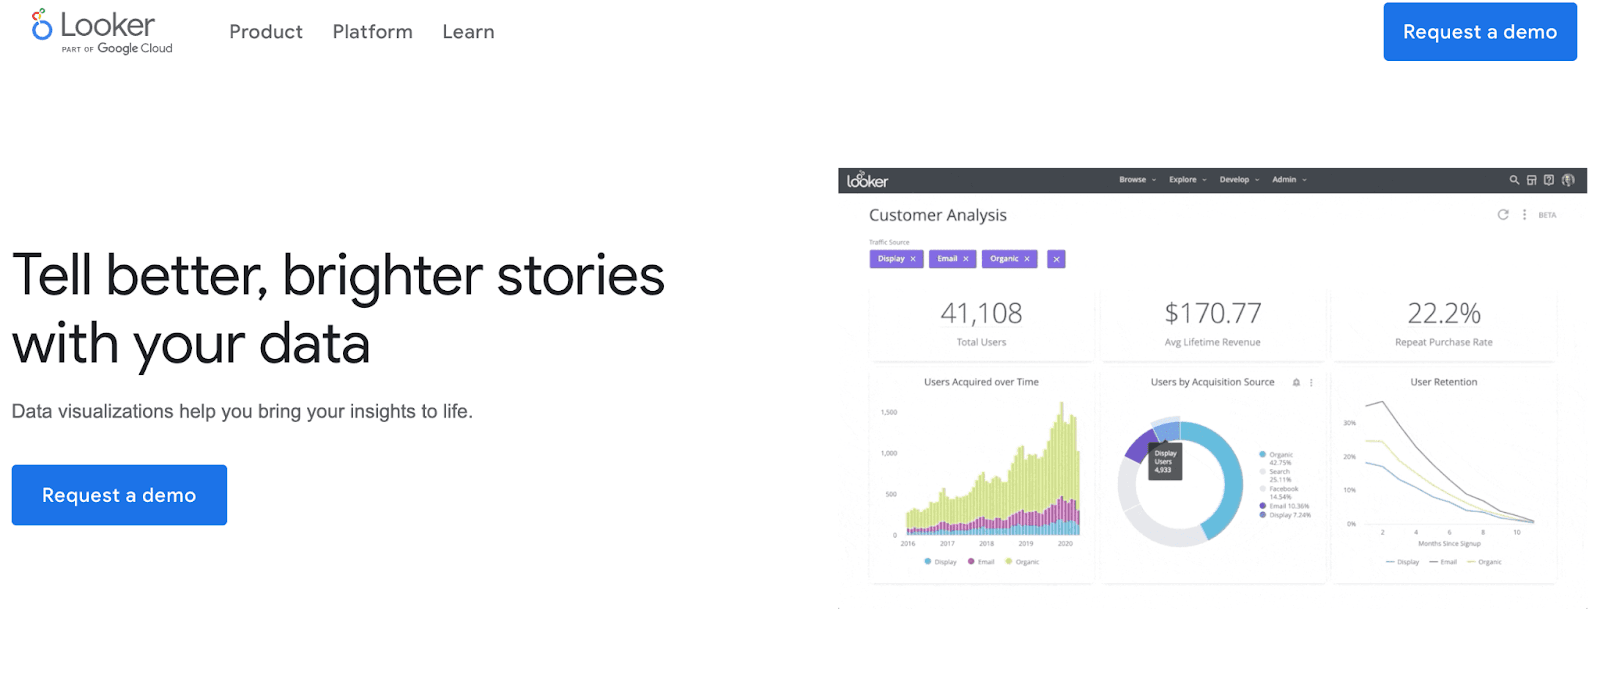
Looker is an enterprise-level BI and data analytics platform that helps data-driven business owners collect, explore and share marketing-related insights in real-time.
Who Is It For?
Looker is a useful BI and dashboarding tool for teams across all business departments. The tool is a good choice for anyone looking for something simple to use, but it still provides plenty of insightful information via visual elements.
Features
-
Easily connect with BigQuery, Snowflake, and 50+ supported SQL dialects, and avoid database lock-in
-
Create interactive reports and dashboards that allow users to explore patterns in data
-
Use Looker's mobile app to instantly access dashboards, check on issues, or monitor KPIs on your mobile device
-
Leverage predictive analytics and data modeling to uncover hidden insights
Pros and Cons
Pros
✅ High-level 360-degree overview of marketing performance
✅ Powerful data-modeling capabilities
✅ Has development mode and branch management (useful for testing codes)
Cons
❌ Lacks scalability when dealing with large databases
❌ Limited visualization options
❌ Not the best choice for a multi-tenant embedded environment
#7. Whatagraph
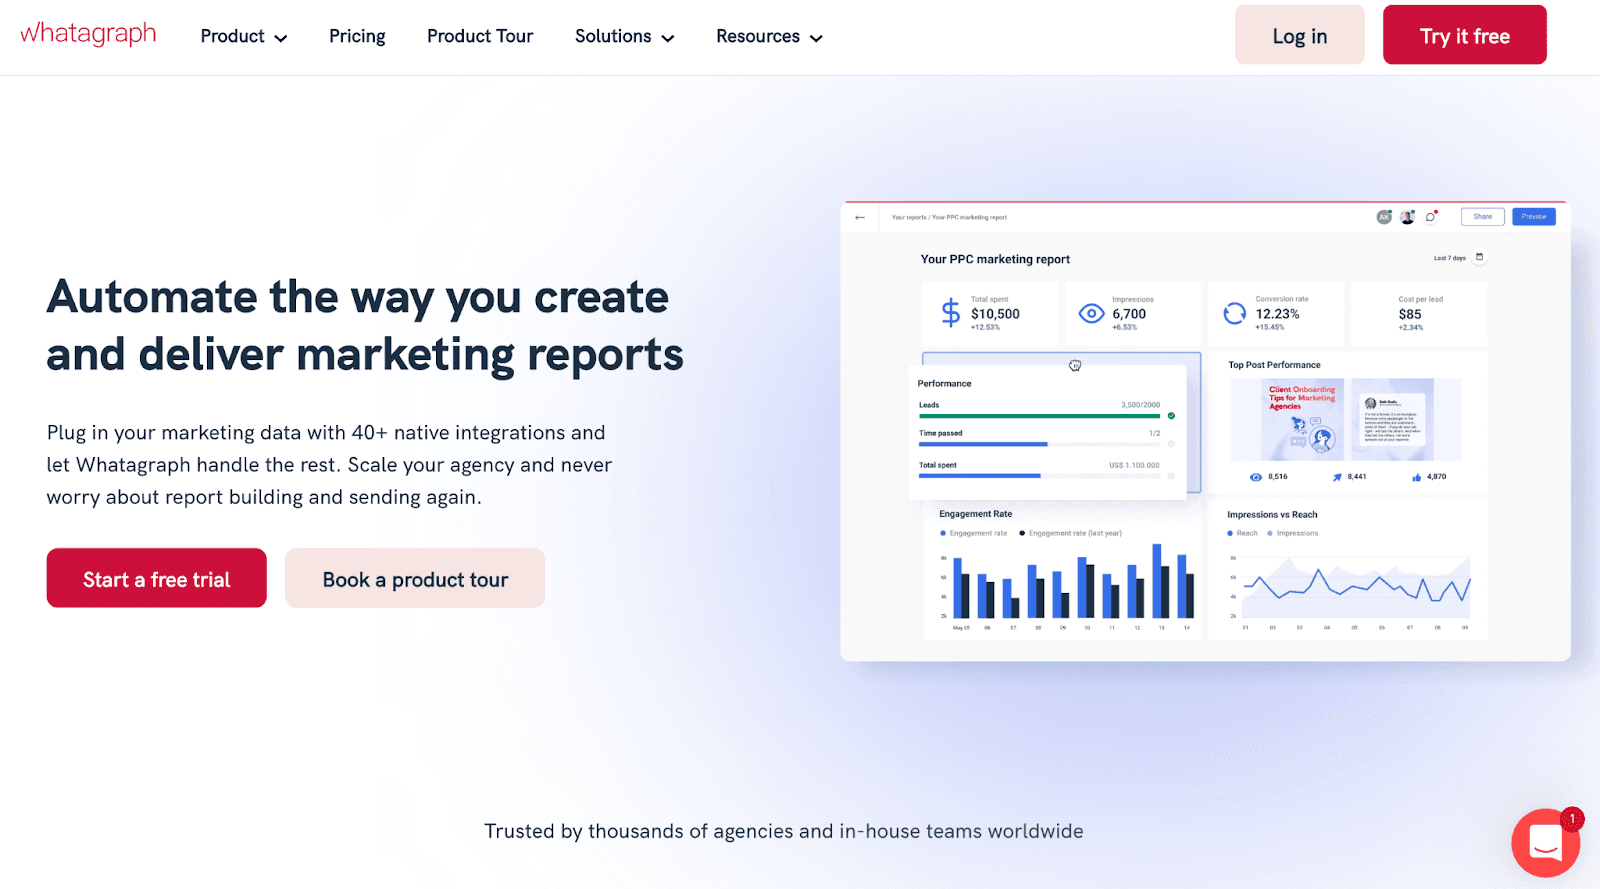
Whatagraph is a cross-channel reporting tool that helps marketers collect, monitor, and visualize data from multiple data sources via dynamic reports and beautiful dashboards.
Who Is It For?
Whatagraph has a versatile user base ranging from digital marketing individuals to big-data companies. You can bet on Whatagraph to simplify your reporting process. It's an excellent tool for digital marketers, in-house marketing departments, and agencies working with clients.
Features
-
Over 40+ read-made integrations and robust APIs to easily import data from various marketing channels and data sources
-
Leverage cross-channel reporting to combine metrics from multiple platforms and create a custom formula to uncover hidden insights
-
Choose from a gallery of pre-built templates and widgets, or use the smart builder tool to customize and create beautiful dashboards quickly
-
Easily schedule and share live reports with clients via smart links; white-label dashboards, and reports with company branding, custom domain, and more
Pros and Cons
Pros
✅ Easy-to-use
✅ White-label functionality
✅ Decent number of integrations
Cons
❌ Lacks behind in customer support service
❌ Overwhelming pricing model
#8. Cyfe
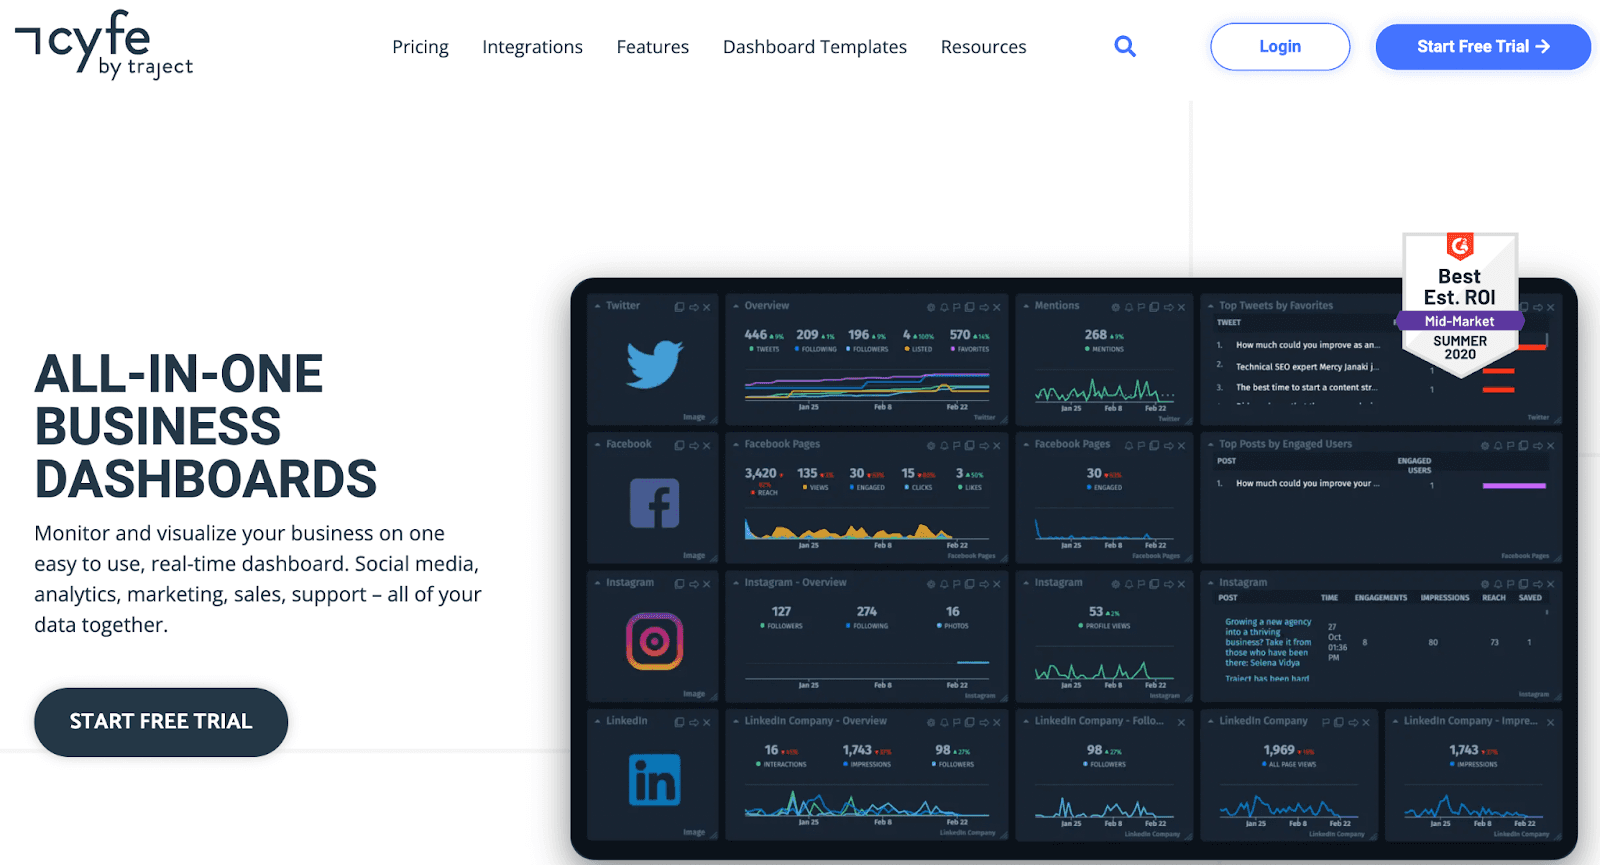
Cyfe, now part of Traject, is an all-in-one dashboarding and data visualization platform that lets you collect all your marketing data in one place and present them via dynamic business dashboards.
Who Is It For?
Cyfe has the best-estimated ROI for mid-market, making it a feasible solution for small-sized companies with < 50 employees. Industry-wise, some of Cyfe's top users are from Marketing & Advertising, Computer Software, and IT industries.
Features
-
Over 100+ integrations, 1500+ app ecosystems of Zapier, and 250+ pre-built metrics to quickly collect data and create dashboards
-
Easily download or schedule automatic email reports of your data in PNG, JPEG, PDF, and CSV formats; share live dashboards via smart links
-
Use its data mashup functionality to blend unrelated data from various platforms and create custom metrics
-
Get real-time dashboard alerts and notifications via emails or SMS
-
Leverage the white-label feature to transform any dashboard template into your own
Pros and Cons
Pros
✅ Great customer service
✅ Tons of custom options and integrations
✅ Supports 15+ languages
✅ Includes White-labeling
Cons
❌ A limited quantity of widgets
❌ Limited functionality
#9. Swydo

Swydo is a cloud-based marketing automation and reporting platform that enables professional marketers to create dynamic marketing dashboards and show impact in real-time.
Who Is It For?
Swydo serves more than 1500+ marketing agencies. It's a potent tool for individual freelancers working on single projects or a full-fledged marketing team.
Features
-
Enable role-based management to control who can view, edit, or access the dashboard
-
Easily manage clients with a centralized overview of their activities; review client status in real-time to make quick decisions under time-sensitive situations
-
Use Swydo's robust set of APIs and integrations to connect with data sources easily or integrate your existing CRM with the platform
-
Automate reporting process and send reports to clients; export and share reports via PDFs or live dashboards
-
Use white labeling to customize reports, URLs, domains, and emails with company branding
Pros and Cons
Pros
✅ Ease of use and implementation
✅ Multi-language support (create dashboards in 14+ languages)
✅ Embedded white-labeling feature
Cons
❌ Limited customization options
❌ Lack of multi-channel formulas
#10. ClicData
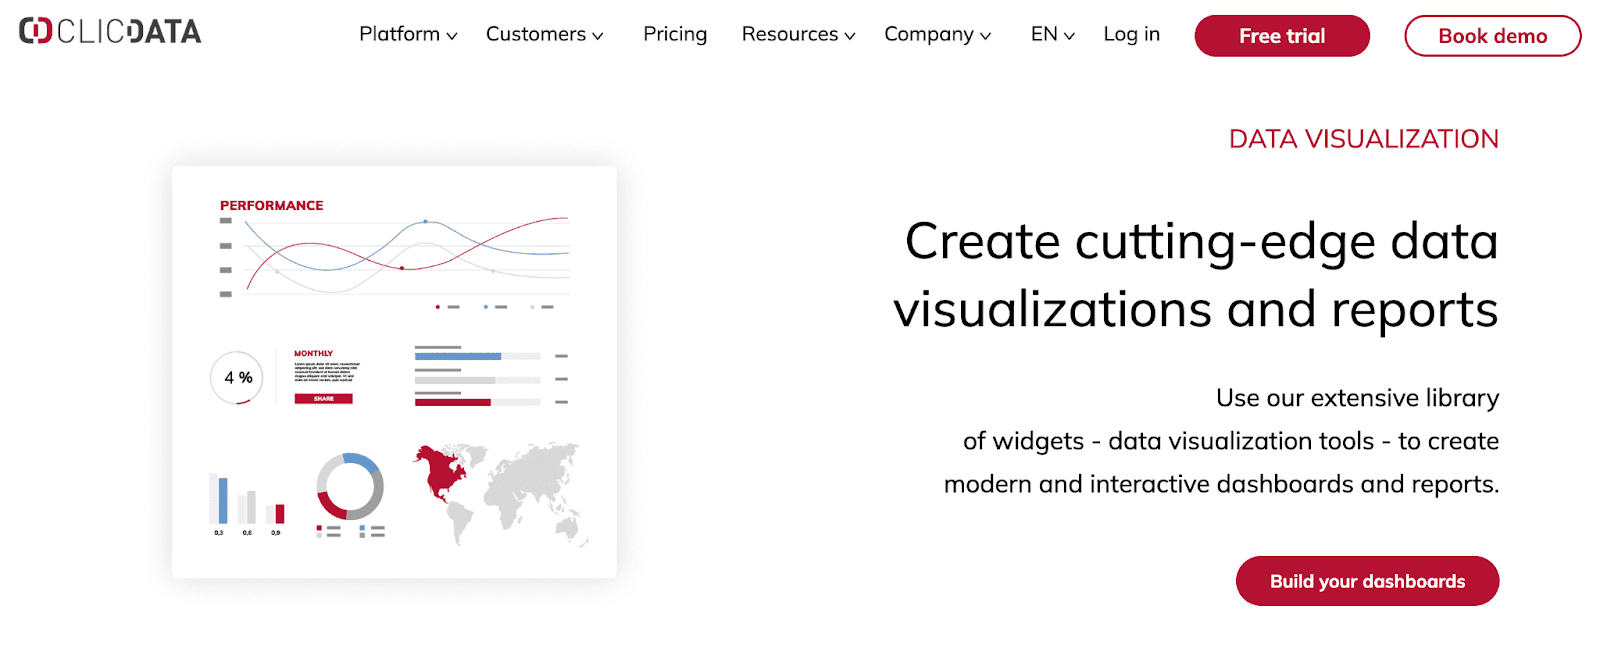
ClicData is a cloud-based BI and analytical platform that enables marketing teams to collect, manage, and visualize data to gauge the ROI of their marketing efforts.
Who Is It For?
1000+ leading organizations across 25+ countries trust ClicData. However, the platform is designed to be used by small-to-mid-sized businesses in the marketing and advertising industry.
Features
-
Over 250+ integrations to popular marketing channels and a robust set of API connectors to pull in any data you want from anywhere
-
Has an extensive library of 70+ widgets and an in-built dashboard designer tool to quickly configure, modify, or customize dashboards and reports
-
Efficiently perform advanced analytics by integrating AI and machine learning into your data flows
-
Quickly share dashboards via PDFs, PowerPoint, image snapshots, or live links; schedule dashboard delivery to recipients via email or Slack
Pros and Cons
Pros
✅ Has extensive API integrations
✅ Has an easy-to-use interface
✅ Free trial included
Cons
❌ Limited functions in terms of data transformation and formulas
❌ Steep-learning curve
#11. Grow

Grow is a no-code BI and analytical platform that assists data-driven marketers in gauging the campaign performance of their marketing efforts via interactive dashboards and taking strategic decisions based on actionable insights.
Who Is It For?
With an average rating of 4.5 on sites like G2 and Capterra, Grow is a popular dashboarding software among small to mid-sized marketing agencies and individual marketers. It helps you track and streamline different marketing strategies with ease.
Features
-
Has an extensive integration library of popular platforms, databases, and CRMs to easily import data to dashboards
-
Leverage ETL and data prep technology to prepare, cleanse, and make data ready for analysis within minutes
-
Choose from an extensive gallery of chart types, including comparison charts funnels, stacked columns, and tables to quickly visualize data
-
Easily blend unrelated data from different platforms to create custom metrics tailored to the business requirements
-
Generate shareable links or share dashboards via emails or Slack; display live dashboard on in-office-TV to the marketing team or stakeholders
Pros and Cons
Pros
✅ Has ETL and data prep technology
✅ Comes with display to TV feature
✅ The platform is easily scalable
Cons
❌ Pricing structure is less-than-ideal
❌ Customizations can be tricky at times
#12. GoodData

GoodData is an API-first data analytics platform that assists businesses in creating real-time dashboards and making informed data-driven marketing decisions.
Who Is It For?
GoodData analytics and data visualization solutions are used by 140,000+ companies globally. Its developer-friendly and low-code capabilities allow both pro coders and non-coding geeks to benefit from the platform.
Features
-
Seamlessly connect to data warehouses and databases like Snowflake, Google BigQuery, and Vertica
-
Easily integrate the platform with your existing infrastructure via APIs or open-source SDKs
-
Has an intuitive drag-and-drop UI allowing users to easily create interactive real-time dashboards - no/low code required
-
Use dashboard plugins to create and integrate custom code, charts, or contents into dashboard components
-
Leverage custom AI/ML capabilities to create chatbots and automate insight generation for users
Pros and Cons
Pros
✅ Has an automatic data import function
✅ Lets you do multi-step validation
✅ Excellent support team
Cons
❌ Steep learning curve (technical jargon involved)
❌ Not a 100% self-service platform
#13. Domo
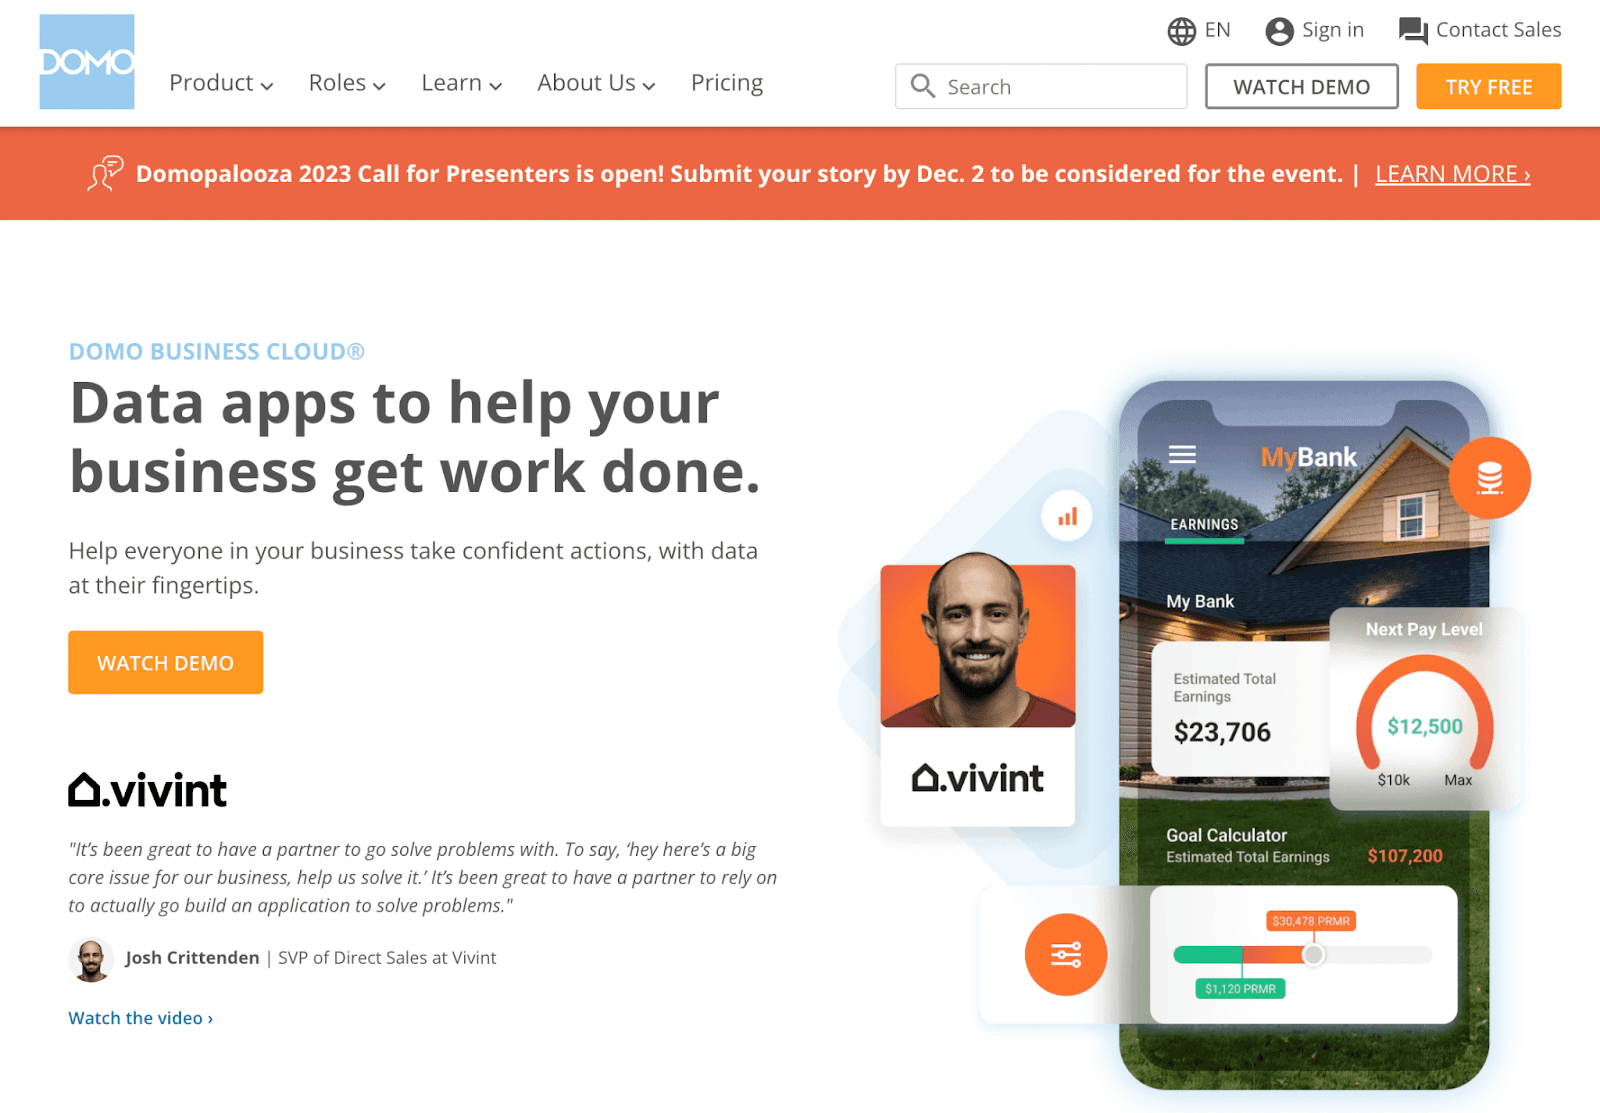
Domo is a mobile-first analytics and dashboarding platform that emphasizes the power of BI to help everyone drive meaningful actions from data.
Who Is It For?
Domo is used by the likes of Cisco, Unilever, eBay, and other big names. Since the platform pricing model depends on your business needs, it's a great tool for small to medium-sized marketing agencies (it wouldn't be a great choice for individual marketers).
Features
-
Over 150+ chart types and other data visualizations elements to quickly build stunning dashboards from scratch
-
Tailor your dashboards based on marketing metrics you care about, or add your custom filters
-
Enable role-based management to take complete governance of who can access the dashboard and in what way
-
Setup custom notifications and threshold alerts; track and monitor KPIs from any device and anywhere
-
Enable self-service BI to bring transparency to data and increase productivity
Pros and Cons
Pros
✅ Can automate data prep via ETL
✅ Come with role-based governance
✅ Has a reliable customer support team
Cons
❌ Layouts and charts are limited
❌ Reliability issue (Loss of data and functions at times)
#14. Sisense

Sisense is a no-code business analytics dashboard that helps anyone visualize data and act on it. Its plug-and-play connectors allow users to easily import data to the dashboard.
Who Is It For?
Sisense caters to many companies, including Skullcandy, Air Canada, Philips, ZoomInfo, and more. So, evidently, it's a great marketing dashboard tool for large companies.
On another note, since the platform is code-free and has custom pricing, it can also be an excellent tool for mid-sized marketing agencies.
Features
-
Create custom dashboards using the drag-and-drop interface
-
Choose from a gallery of visual elements and widgets to quickly create dashboards
-
Use pre-built templates to create highly customized visuals with a click
-
Generate automatic PDF reports and easily share dashboards via URLs and emails
-
Build app-like functionalities using the platform's robust API and SDK capabilities
Pros and Cons
Pros
✅ Allows data mashup for a holistic view
✅ The platform is flexible and scalable
✅ Excellent number of integrations
Cons
❌ Doesn’t let you change the dashboard font
❌ Long waits for customer service
#15. Geckoboard
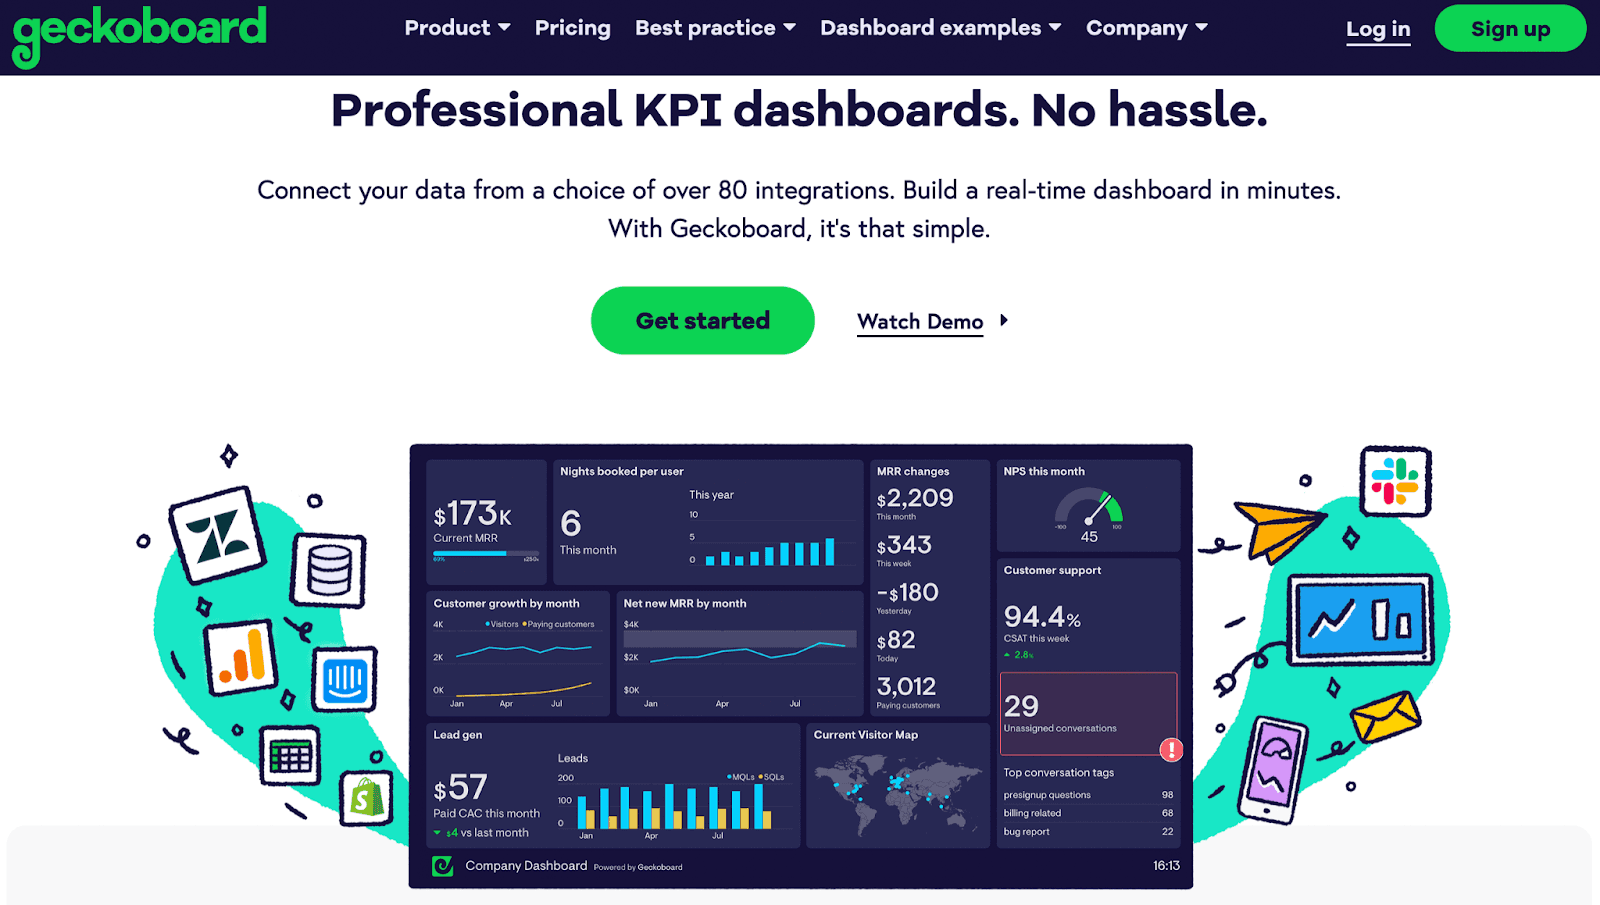
1000s of organizations trust Geckoboard for creating professional marketing dashboards. Its feature-rich software and metric-first approach make the platform stand a step ahead of its competitors.
Who Is It For?
Geckoboard has excellent integrations with marketing platforms. Besides, it has a free-forever plan; however, it's quite limited as it provides access to 1 dashboard. It's a recommended marketing dashboard software for beginners or novice marketers who are still early in the journey.
Features
-
Over 80+ pre-built integrations with popular data points allow easy and secure routes for data imports
-
Generate shareable links to live dashboard; set schedule to email screenshots of the dashboard to clients automatically
-
Enable the display-to-TV feature to broadcast your live dashboard on giant TV screens across office and conference rooms
Pros and Cons
Pros
✅ Easy to setup and use
✅ Has an auto refresh function that keeps refreshing your data frequently
Cons
❌Poor customer support
❌ If you want a premium plan, you have to pay a fortune
Have All Your Dashboards In Your Pocket for Free with Datapad
Marketers often have to track KPIs multiple times a day. They can't afford to waste time, learning a dashboarding tool from scratch, or searching for KPIs all the time.
You need a solution that's fast, easily accessible, and easy to learn.
That’s why we’ve come up with a dashboard software - Datapad, that lets you create marketing dashboards and bring your team onboard to track KPIs and achieve the goals you have for your company.
We have everything your marketing team needs to keep track of your KPIs from mobile phones.
But it might cost a fortune, right? No, it really doesn't.
Datapad is a free-to-use platform that you can download directly by scanning the QR code below. So create a digital marketing dashboard and impress your clients with it today!
