![Executive Reporting: A Guide You Have Been Waiting For [2023]](/_next/image?url=https%3A%2F%2Fframerusercontent.com%2Fimages%2FcJt065dJrxONV2EM7TFhuuQrlo4.png&w=3840&q=75)
Executive reporting is a must in today's environment. Every market sector has a lot of moving parts, and the need for quick decision-making is at an all-time high. It’s a test for hustling entrepreneurs who want their businesses to stand out from the crowd or sustain themselves in a highly competitive marketplace.
To do so, managers and directors must match the accelerating pace of fierce competition while avoiding employee burnout.
But how can they cope with it? We believe the answer lies in automation.
Automating the executive reporting process can do wonders for your organization. It will help you collect, centralize, and visualize crucial business data for upper management.
Besides, by automating the reporting process, you tend to streamline operations while avoiding human errors when dealing with highly sensitive data.
This article covers every aspect of executive reporting, the best practices for creating executive reports and dashboards, and a step-by-step guide to how even a beginner can create a mind-boggling executive dashboard in just three simple steps.
You’re just 5 minutes away from getting another feather in your cap from your senior management in the organization. ⏳
What Is Executive Reporting?
Executive reporting is a process of providing essential business-related information, such as operational data and KPIs, to top-level executives. It aims to provide a more comprehensive, big-picture overview of the organization's functioning to executives in an easy-to-understand manner (commonly via visuals, diagrams, or charts).

Besides, executive-level reporting is done for a predetermined period, say monthly, quarterly, or yearly.
Note: Executive reporting is generally not done weekly because, as we said, it's always reserved for the big-picture overview.
And what constitutes an executive report highly depends on the organizational goals, objectives, and set KPIs. However, three things are always part of executive reports regardless of the size and type of organization.
✅ Results
While prolific results should be cherished, poor performance should also be accounted for. And hence, executive reporting covers what your company has achieved vs. what it could have achieved.
✅ Expenses and Profits
Executives' favorite column is the one with $$ into it. After all, being an executive, all they want is to measure the correlation between fruitful numbers and heart-aching expenses. Thus, besides providing insights on results, executive reporting also involves business financial health.
✅ Feedbacks
Feedbacks are the only thing that gives a human touch to executive reports. It's distinct from all the numbers and graphs on a report. Generally, the feedback includes employees' take on the company's present culture and suggestions for improving performance.
What Are the Benefits of Executive Reporting?
Executive reporting covers a broader ground than just measuring results and providing a deeper understanding of an organization's operations. Since it's reserved for top-tier management, it has more to support the cause, such as:
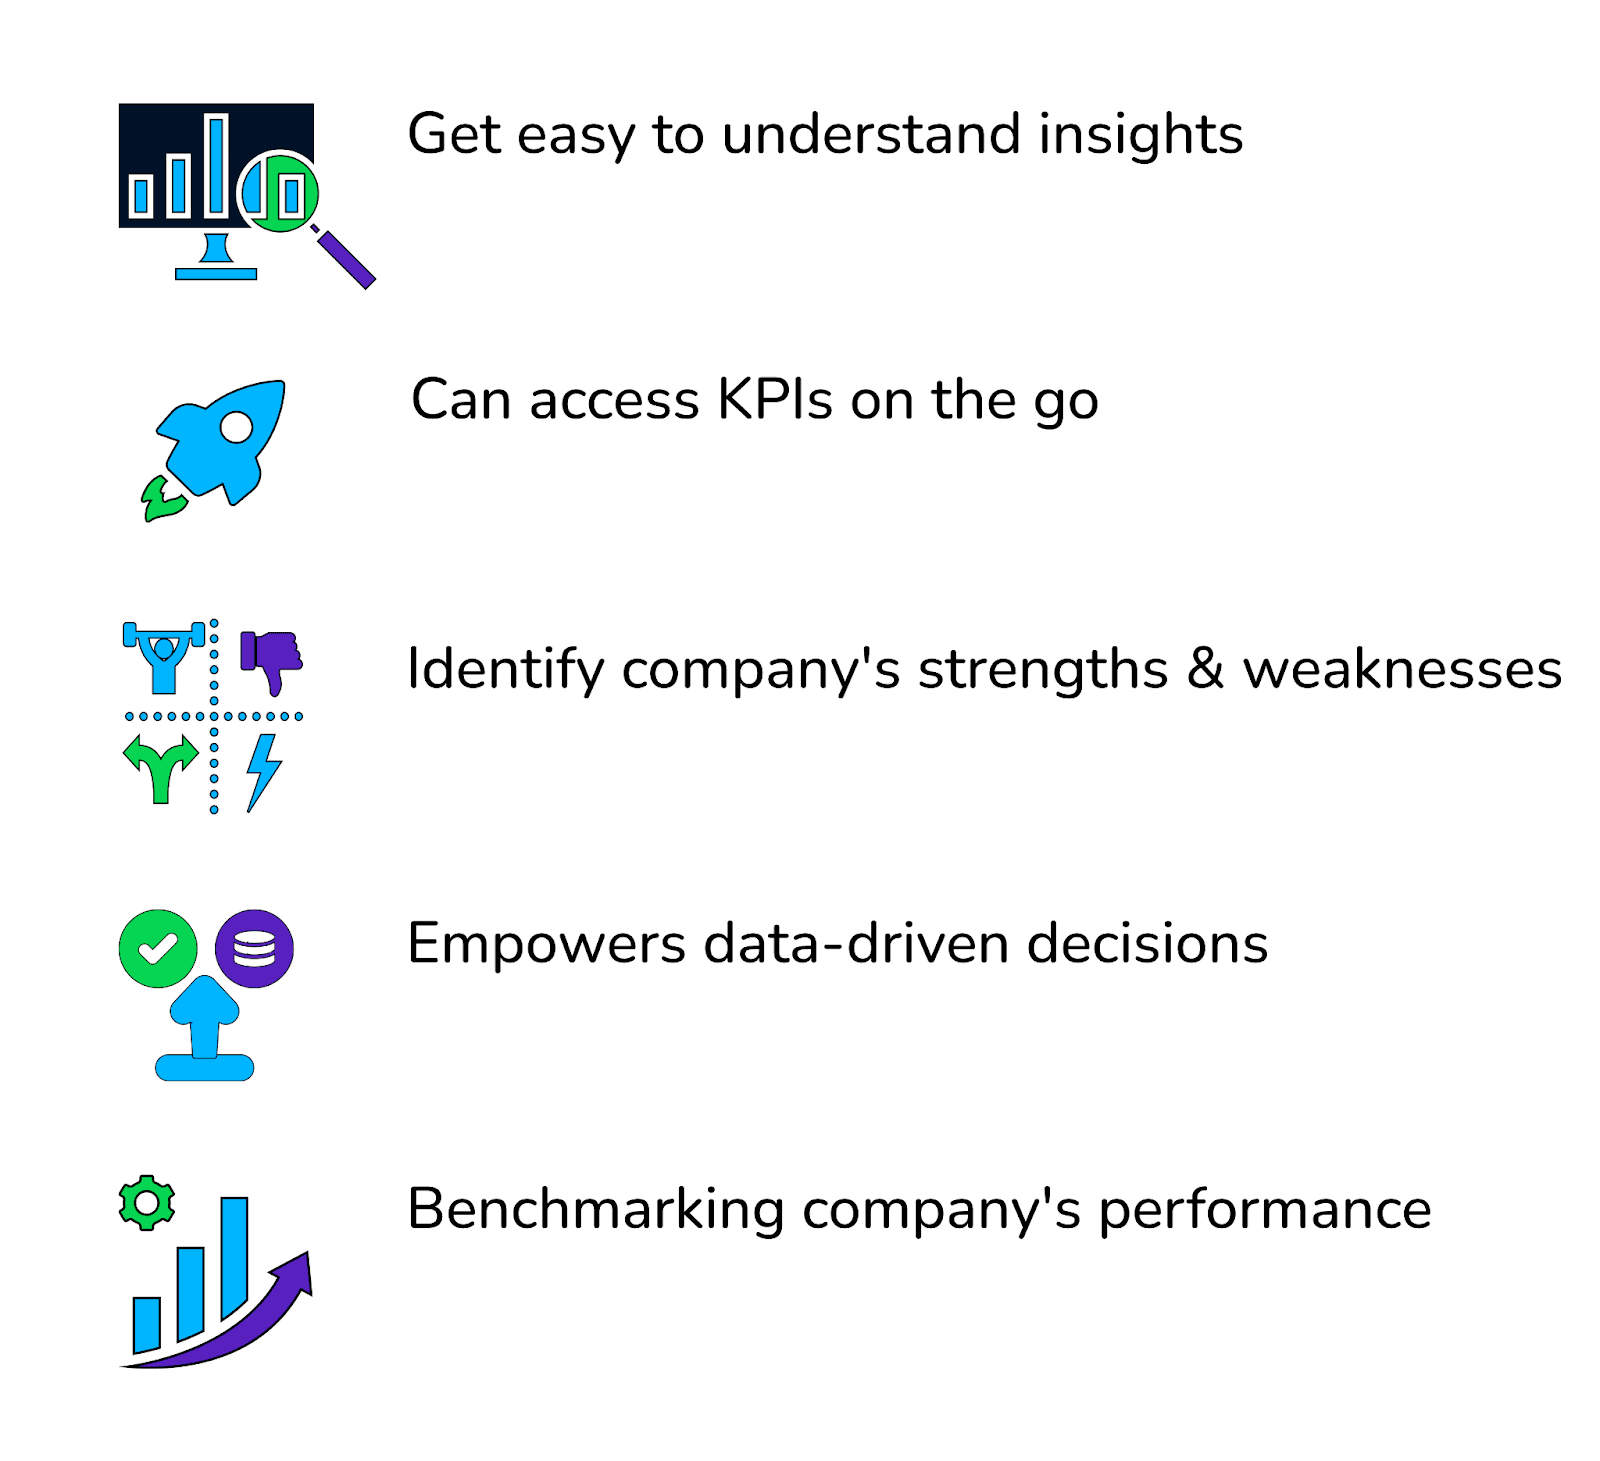
#1. Easily Understandable Data
Suppose you're an investor planning to pump money into a company. Apart from the general analysis of the company, the last thing you ought to see in an executive report is that it has everything from company finances to operational working.
But when you receive the report, you see tons of data clusters build-up of numbers, decimals, and percentages. It may take you days or weeks to get a clear idea of the company's operations.
However, modern-day executive reporting has come a long way. These reports are now well structured and better visualized with charts, tables, graphs, and even infographics to make them easily understood by executives.
#2. Can Access on the Go
Another thing here is that you can access executive reports on the go. You don't need to stick to your desktop or data analyst to work through the report.
In the era of digital reporting, many online tools and platforms allow executives to access reports from their mobile phones. So, you can still monitor performances and make informed decisions even if you're not at your desk.
#3. Identify Strengths and Weaknesses
You need more than just a raw financial dataset and a cluster of stats to get anywhere.
You should know how different departments add up to the company's success for a deeper understanding of your company.
Executive reporting not only displays insights but also offers a clear explanation as to why the company is at its bottom line (if it is) in the last quarter. It helps you identify the pain points that can make or break your business in the long-term.
And that's the most momentous information an executive wants to know about.
#4. Empowers Data-driven Decisions
The only constant in this volatile and unpredictable market is Data. And since executive reporting is based on the best, most relevant, and currently available data, it does empower you with quick and confident data-driven decisions.
#5. Benchmarking Company's Performance
Now, the primary benefit of executive reporting – is to gauge a company's performance against set goals.
With executive reports, management can easily measure their performance against the set goals and as per the company's strategic plan. Moreover, with set benchmarks and full-fledged reports in hand, executives can tweak or build strategies to drive comforting results.
How Can You Create a Better Executive Report?
If, after going through your sent report, an executive claims, "Who’s the creator of the report?”
Either it's time to pack your stuff, or you might have really impressed them. A fantastic report can go a long way to helping your executive team better understand the company and lay a positive foot on your credibility with sensitive data.
As a team, you create executive reports for two purposes:
-
To provide information to C-suite executives
-
To impress clients with your data visualization and handling skills
Thus, here are some proven practices you must consider if you want to create a special report that would wow your executives:
#1. Stick to Your Audience
It's essential that your audience resonates with the report. For example, a report created for the investors should involve data and stats beneficial from an investor's point of view. In contrast, an executive report for managers should have everything that the manager wants to know.
Simply put, having unrelated information makes a report worthless for the audience. And so, understanding the interests and priorities of your audience will help you include the most relevant information in the most effective way.
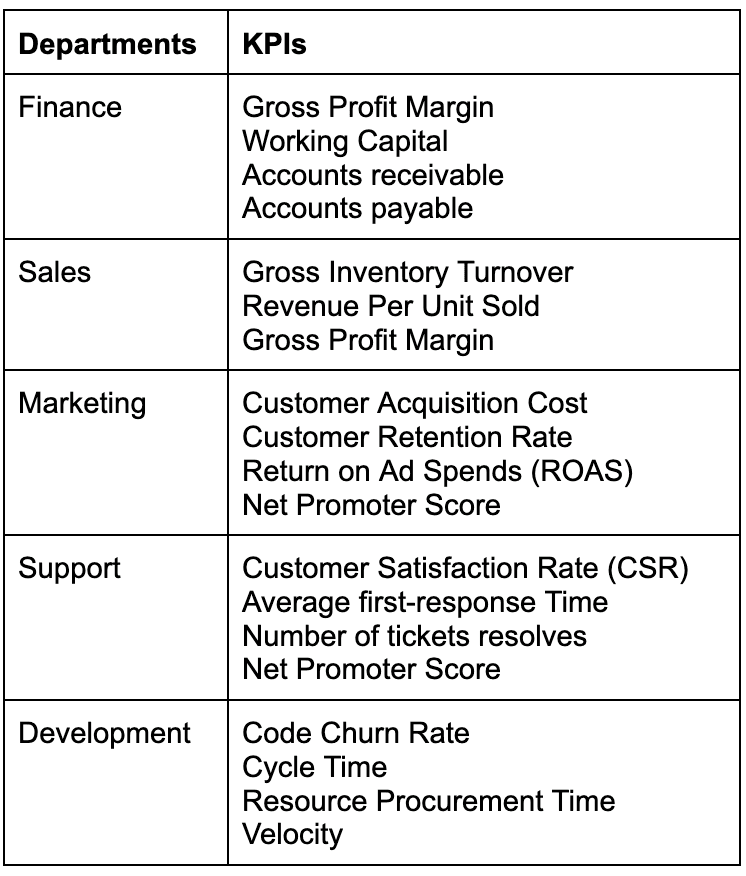
#2. Pick the Right KPIs
Similar to the previous practice, your choice of KPIs highly determines the effectiveness of your report. Again, for example, if you pick marketing KPIs (apt for marketing reports) to create a report for investors and stakeholders, it will lead to nothing else than confusion. Worst case, it might derail your message. 🎯
So it's important to choose your KPIs in context to your audience – for managers, investors, CMOs, or CFOs, there're tons of KPIs available to cater to the specific needs of the departments.
#3. Try Telling Data-Driven Stories
Hands down, storytelling is the best way to convey information in an engaging manner. 📜
Make sure your executive reports are more than just dull pieces of information.
Instead, by looking at your report, relevant stakeholders should be able to view a dynamic story of your company's strategy and performance.
Try weaving a story by connecting different datasets with game-changing events, dates, or decisions, like how a particular marketing campaign boosted the company's revenue during a period. Or, use infographics to demonstrate growth and downfall for the decade.
#4. Use Data From All Sources
Executive reports immensely contribute to a company's decisions. And missing out on data while creating these reports can unintentionally manipulate the overall outcome.
While measuring data from your most significant data source may be compelling, utilizing the data stack to the fullest will help you connect your data story together.
Integrating existing platforms such as CRMs, point-of-sale systems, project management tools, and website analytics tools can be a prominent source of data.
These 4-simple practices can help you create stunning reports. However, you should be aware that executive reports and dashboards are two different chapters of the same book.
What Is An Executive Dashboard?

Simply put, an executive dashboard is the visual representation of key performance indicators (KPIs) and key metrics that c-suites need to monitor for the smooth functioning of the organization.
Doesn't this look similar to executive reporting? We got the same vibes, but here's the thing.
The answer to this question depends on what your specific data needs are. Both reports and dashboards offer key benefits, and their own limitations accompany each.
Firstly, reports and dashboards both share beneficial scopes. While a dashboard can include several data points and sets, a report can offer a better high-level view of the organization.
For example, a CEO may not need to see specific dashboards for customer support. Still, he would benefit from a report stating how the customer service department performs as a whole.
On a second note, reports are a product of historical data derived from dashboards.
Note: You can create reports from dashboards but not the other way around.
We consider reports as snapshots of the historical performance of specific organization areas rather than real-time scenarios.
Dashboards, on the other hand, are built to visualize and organize data in real time. They are dynamic in nature and can be modified to alert users when specific performance metrics change or thresholds are met.
And lastly, you can do a lot of things with dashboards – manipulate data, customize appearance, integrate with multiple platforms, perform data mashups, advance calculations, and whatnot.
Reports, however, don't ideally do that. They show a static picture of your live data via visual elements. Probably enough to help executives in effective decision-making.
Let’s quickly summarize the difference.

What Should Be In An Executive Dashboard?
The foundation stones for executive dashboards are company-level KPIs – the major ones that allow for a quick performance review.
For example, a CEO's dashboard may display KPIs from every department in the organization.
Here's an example of what to include in a CEO dashboard to monitor a SaaS company's performance.
Besides, there are 1000+ dashboarding tools available on the web (free and paid) that help you create stunning executive dashboards.
However, before you cherry-pick a tool, ensure that it has these features of an executive dashboard:
#1. Real-Time Data Updates
To obtain the maximum value, ensure that the dashboard is capable of extracting real-time data from multiple points and existing CRMs.
#2. Customizable Interface
Customizable interface helps executives find it easy to view or transform data in their preferred manner. In today's world, it makes sense because executives want data to be presented in an accessible, easy-to-read format, thus avoiding unwanted headaches yet ending up making better and confident decisions.
#3. Analytical Capabilities
To make your big data all refined, polished, and visualized, the software needs to have some advanced capabilities like smart calculators, dast mashups, predictive analytics, etc.
#4. Access on the Go
Lastly, executives will love to have their dashboards on their mobile phones. We mean, who doesn't like reviewing their own company's performance with a cup of coffee in the mountains? Thus, ensure that the software offers mobile-friendly dashboards.
How Do You Create An Executive Dashboard in 3 Steps?
To ease your search, we have already reserved the best dashboard tool for you – Datapad.
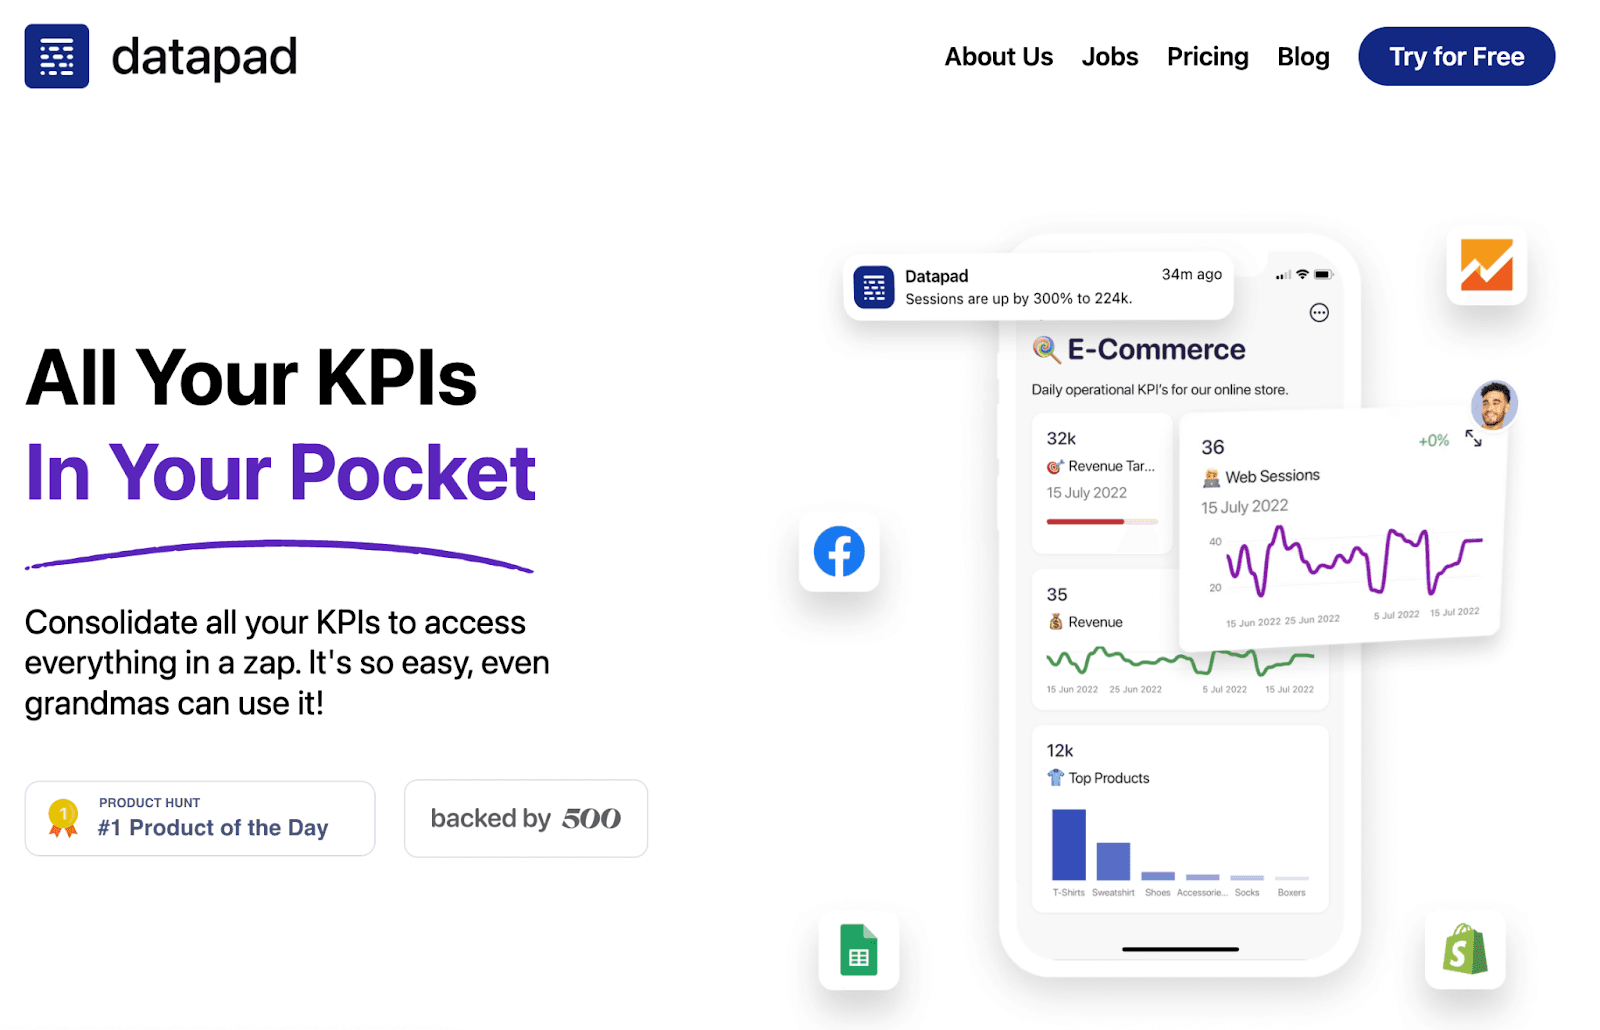
It's the easiest and free dashboard and reporting tool to create executive dashboards. Besides, our tool just requires you to follow three quick steps, and BOOM! You have your first executive dashboard in action.
Do you want to see it? Here's how it goes:
Step #1. Decide on the Goal of Creating Your Dashboard
Why are you creating this dashboard? Is it for a specific department or the organization as a whole?
As the saying goes, if you are doing something, ensure to tie it with a goal for 10X success.
The above saying holds true when creating executive dashboards. If you have decided to create a high-level dashboard, make sure you know why you are creating it and for whom. Focus on creating SMART goals:
-
Specific
-
Measurable
-
Attainable
-
Relevant
-
Time-bound
Also, remember to keep your fundamentals clear regarding the choice of KPIs. Your choice of KPIs goes a long way in creating meaningful executive reports and dashboards.
Step #2. Choose What You Would Like to Report on the Dashboard
Now starts the real deal. To get started with Datapad, download our app (available for Android and iOS) on your mobile devices. Here's a QR code to help you do so:

Once into the app, you are asked to sign up and register with your mail address. It takes us seconds to confirm your email address and then click on the 'Create a dashboard' button on your screen.
The app will ask you to add a Title, description, and emoji (😇).
You can add those and click on 'Create.'

But just a dashboard will do little. You need to pump in some data. Fortunately, Datapad allows you to import Data Manually and Automatically.
To add KPIs manually, tap on 'Add Metric' and select Enter Manually. Then, add a value, set comparative standards, and customize the metric as per your company's branding. Later, choose the type of graph you want your KPI to have - A bar graph, Pie chart, Line diagram, or a simple table.
Look closely at the below GIF to understand the process better.

Furthermore, you can use our one-click integrations to popular data sources such as Google Analytics, Shopify, Facebook Ads, and more to import data with a click. To do so,
-
Press the green colored '+' sign to create a metric
-
Click on 'Use a data source'
-
Choose from a library of datapoints

Step #3. Share with Your Executives
Onboarding stakeholders, investors, or executives is a hassle-free process in Datapad. You can enter respective email IDs within the app and send email invites with a click.
Moreover, executives won't feel troubled because who (in the c-suite) doesn't like to have a live dashboard on their mobile phone? Not just to view but to actually monitor the trends and take time-sensitive decisions when required.
Datapad, however, offers both features. With Datapad's mobile app, you can communicate with your team members in real time within the dashboard. How can you do that? It's simple:
👇🏻 Comment under the metric which you feel needs attention
👇🏻 Your team gets real-time push notifications for your comment
👇🏻 Team members can view and reply to the comment in real time
What's more, the comment feature works similarly to threads on Twitter (One after another) and can be viewed anytime later for clarification.
Here’s the feature in action:

And that’s it!
With these 3 steps, you could build, customize, and onboard decision-makers and c-suites to view the executive dashboard or just send them executive reporting.
Lastly, you don’t need to worry about the pricing to build executive dashboards and reports if you use Datapad, it’s a free-to-use mobile app!