![7 Best Interactive Data Visualization Tools for 2025 [Complete Guide]](/_next/image?url=https%3A%2F%2Fframerusercontent.com%2Fimages%2FwKr7qWoH3wvC5iFIgCtyiwGA.png&w=3840&q=75)
Traditional dashboards are dead. Welcome to the era of conversational analytics where you can simply ask your data questions in plain English and get instant, actionable insights.
In 2025, the most successful businesses aren't just creating pretty charts—they're having conversations with their data. According to Gartner's latest research, "D&A is going from the domain of the few, to ubiquity," and interactive data visualization is leading this transformation.
Why Interactive Data Visualization Matters More Than Ever
Here's the reality: businesses that use interactive data visualization tools are 28% more likely to find information quicker than those who rely on static dashboards. But it's not just about speed—it's about accessibility and the democratization of data insights.
The game has changed:
-
300% higher engagement: Interactive visualizations keep users engaged 5x longer than static alternatives
-
Real-time decision making: 87% of teams now use collaborative dashboards to track KPIs and boost performance
-
Conversational AI integration: Natural language querying is becoming the standard, not the exception
The Rise of Conversational Analytics
The biggest shift happening right now? Conversational analytics. Instead of clicking through endless menus and struggling with complex filters, you can now literally talk to your data.
Think about it: When you need information from a colleague, you don't hand them a form to fill out. You ask a question. Why should working with data be any different?
AI analytics has evolved from dashboards and copilot tools to agentic intelligence where business users now get autonomous recommendations, not just answers. This isn't just a trend—it's the future of how we interact with data.
What Makes Interactive Data Visualization Effective in 2025
1. Natural Language Processing (NLP) Integration
The most powerful interactive visualization tools now include conversational AI capabilities. Users can simply type their questions in plain English and receive responses that are not only accurate but also tailored to their specific business context.
2. Real-Time Data Processing
In 2025, we can expect the demand for real-time data visualizations to increase as businesses need instant insights to stay competitive. The best tools now offer live data connections that update automatically.
3. AI-Powered Insights
Gone are the days of staring at charts wondering what they mean. AI-powered tools will offer data visualization suggestions—such as heat maps, scatter plots, or interactive dashboards—most suited to the dataset and the message, significantly improving the clarity and impact of data presentations.
7 Best Interactive Data Visualization Tools for 2025
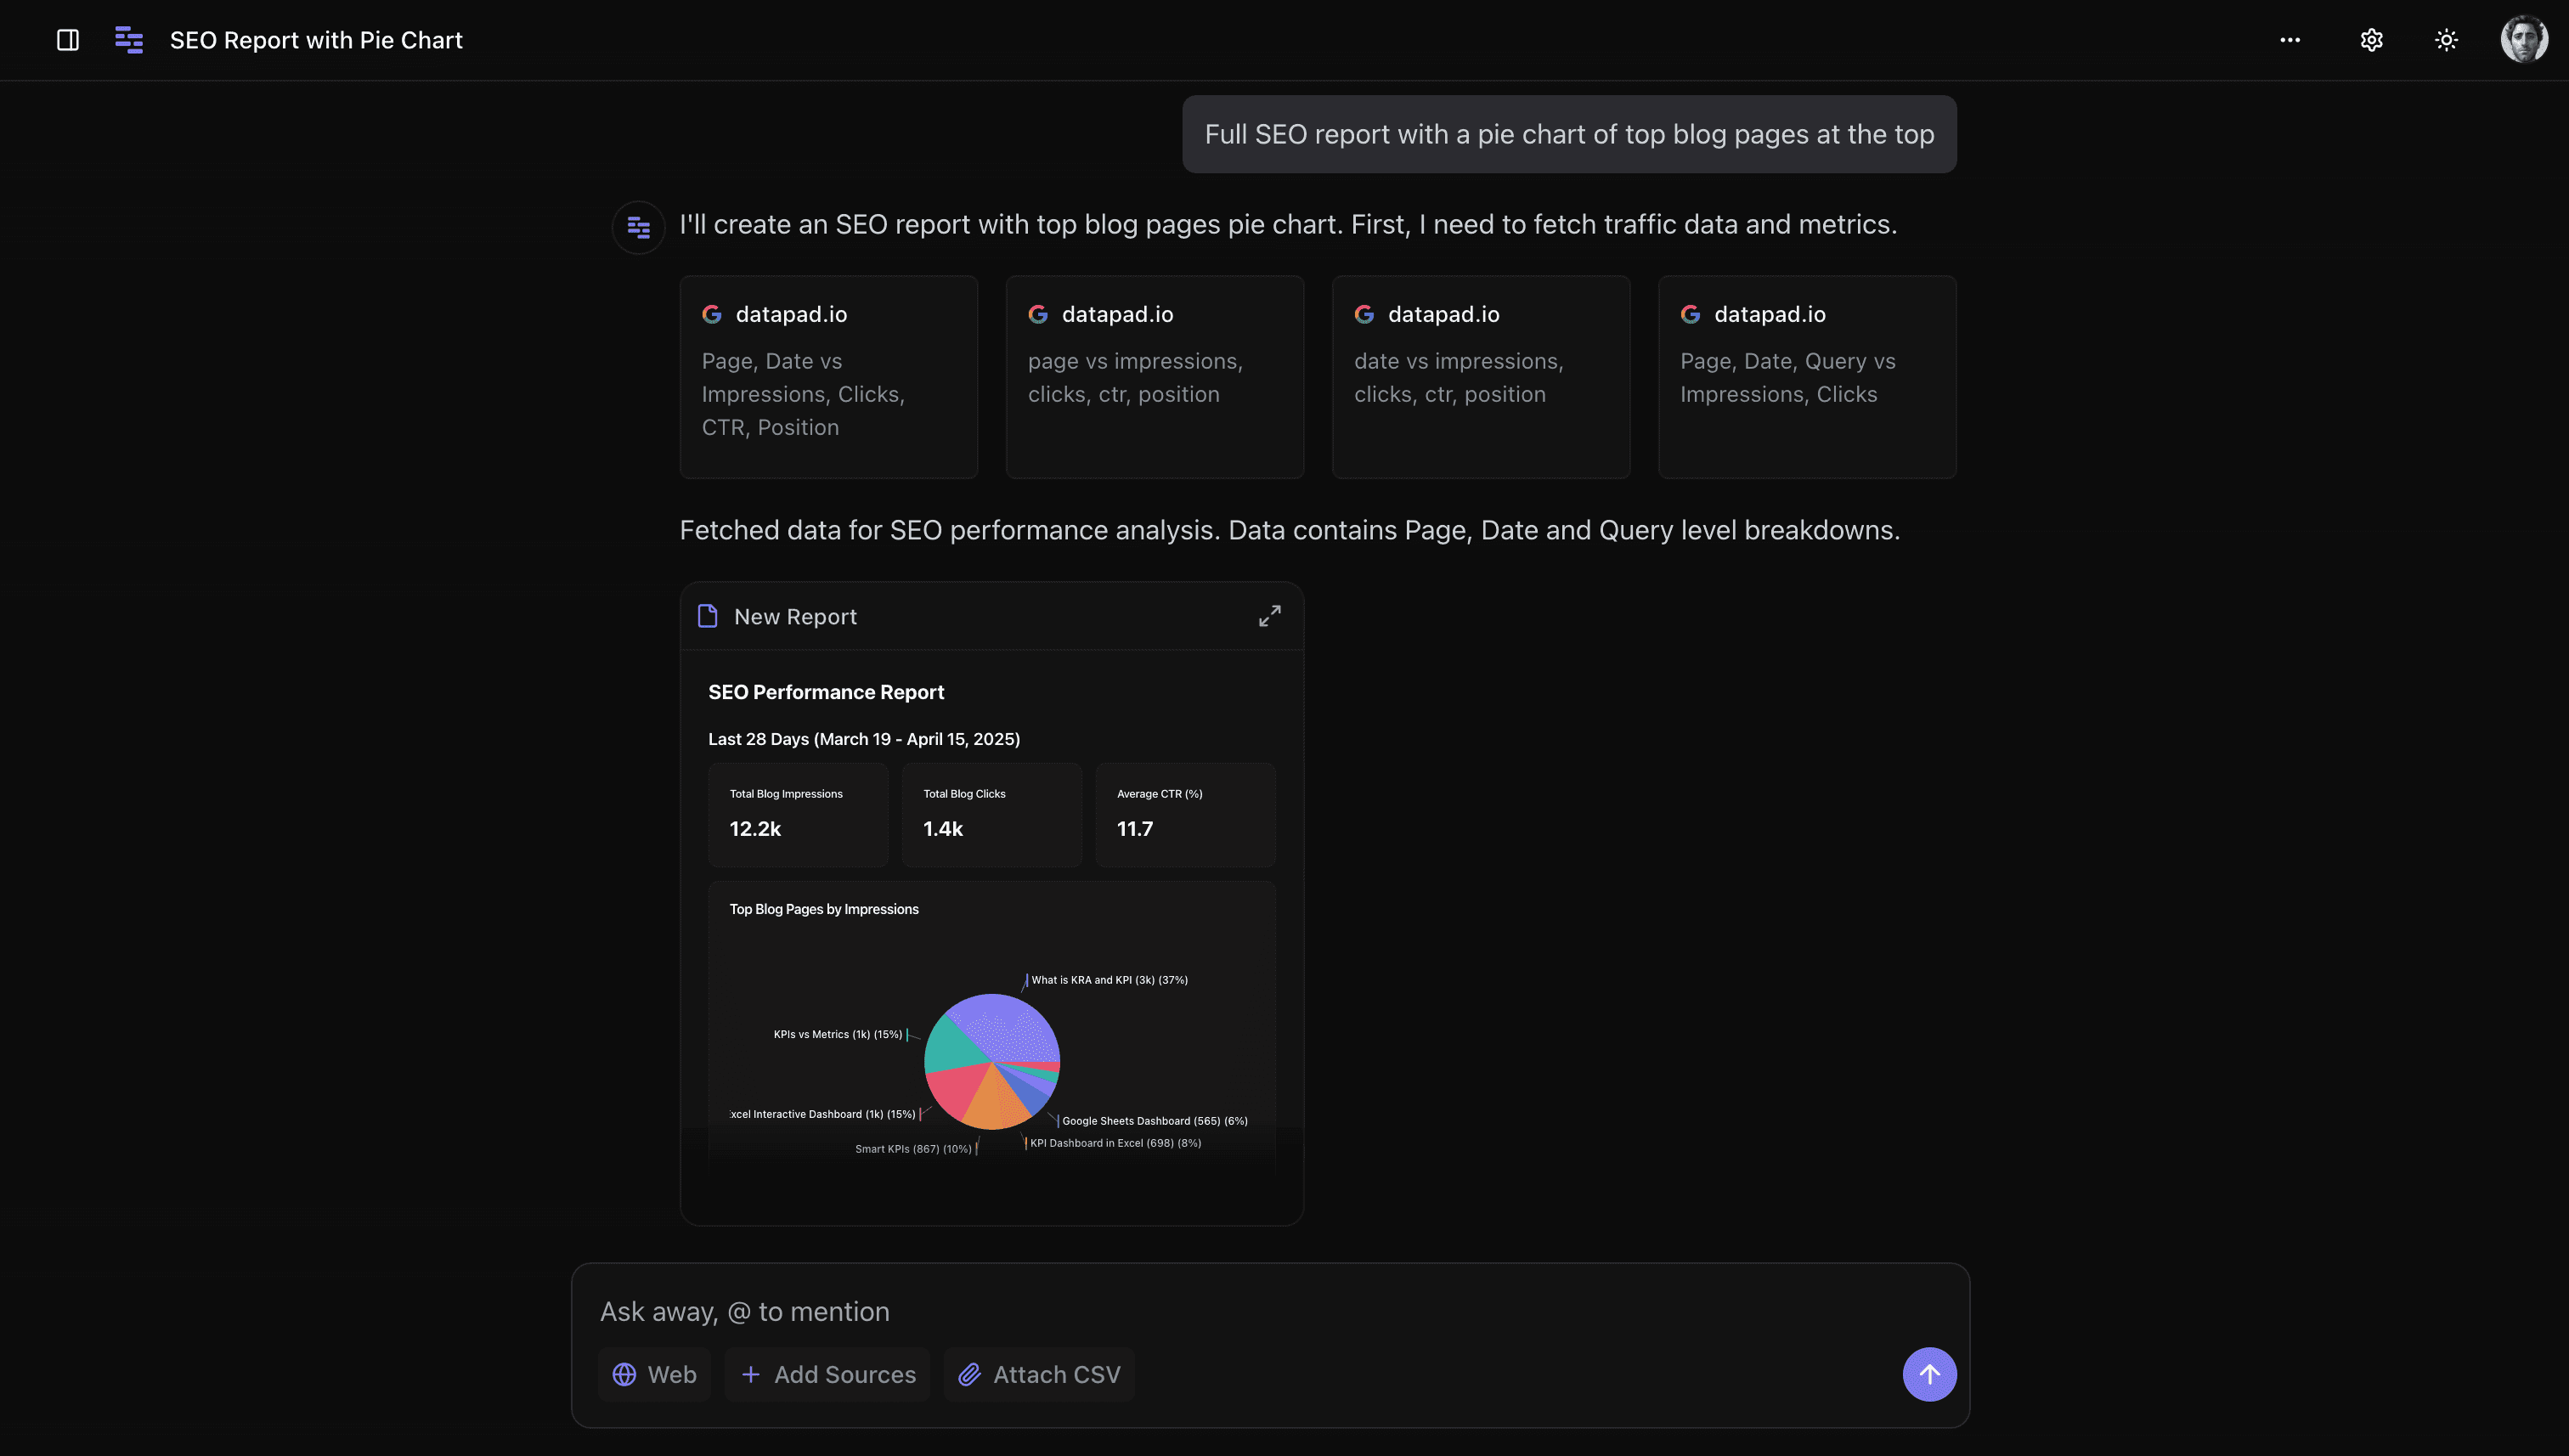
1. Datapad - The Conversational Analytics Pioneer
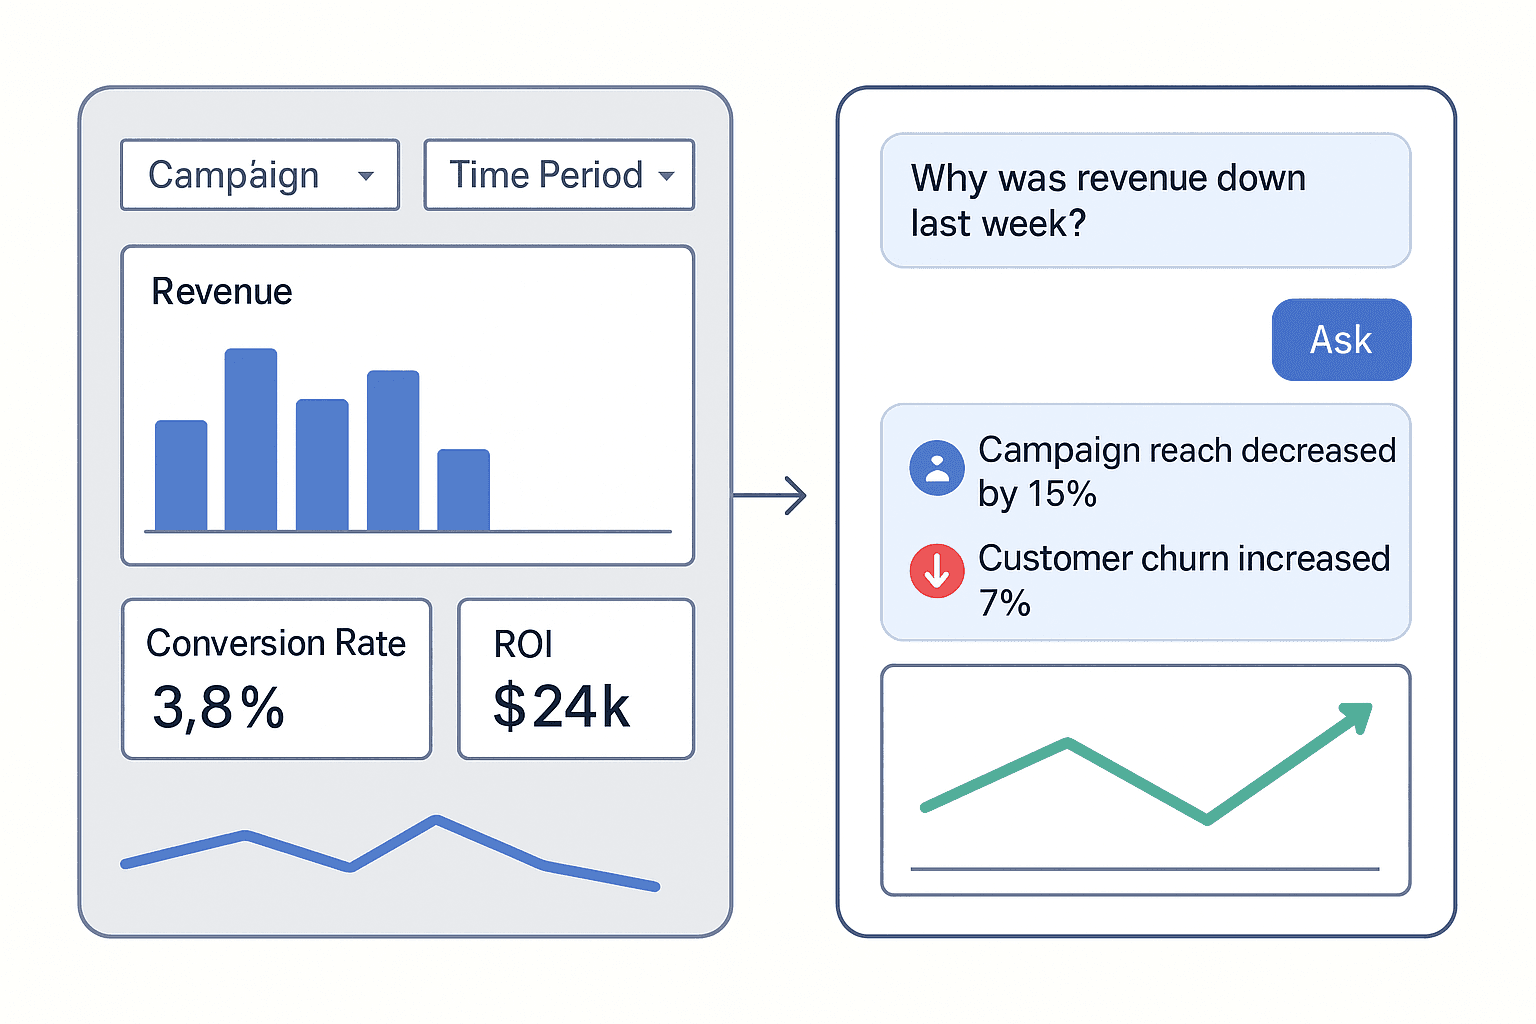
Why Datapad leads the pack: We're not just another visualization tool—we're your AI data analyst. Ask questions in plain English, get instant answers, and turn insights into action without ever touching a dashboard.
Key Features:
-
Conversational Analytics: Ask questions like "What's driving our customer churn?" or "Show me our best-performing campaigns" and get instant, contextualized answers
-
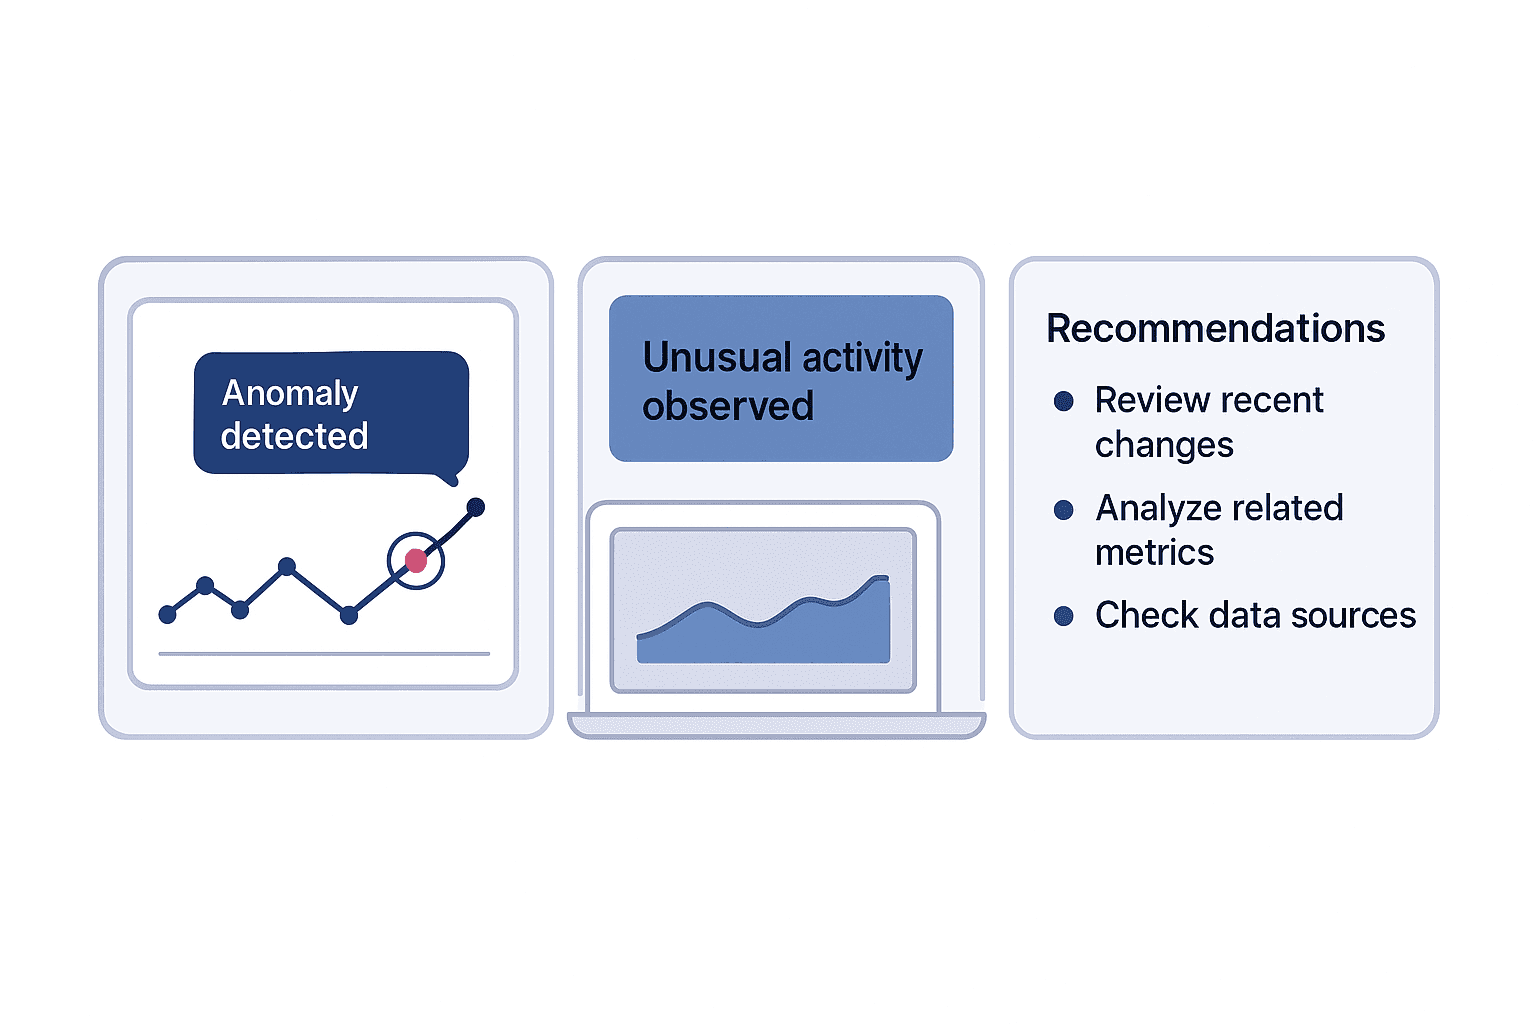
AI-Powered Insights: Automated anomaly detection with actionable recommendations
-
25+ Data Connectors: Seamlessly connect Google Ads, Facebook Ads, Google Analytics, Search Console, MongoDB, PostgreSQL, and more
-
Real-Time Collaboration: Discuss insights directly on charts with your team
What makes us different: While other tools make you learn their interface, Datapad learns yours. Our AI understands your business context and speaks your language.
Pricing:
-
Free Plan: 1 dashboard, 5 daily chat message
-
Basic: $16/per user, unlimited dashboards, 10 automated reports and chats
-
Pro: $40/per user, everything in basic plan + unlimited reports, Slack bot, auto-learning agent
Perfect for: Teams who want to skip the learning curve and start getting insights immediately
2. Tableau - The Enterprise Powerhouse

Tableau remains the gold standard for complex data visualization, especially for large enterprises with massive datasets and sophisticated analytical needs.
Standout Features:
-
Advanced Visualizations: Extensive chart types including treemaps, bullet graphs, and custom visuals
-
Tableau AI: New conversational features for natural language queries
-
Enterprise Scalability: Handles massive datasets with optimal performance
-
Robust Community: Large user base and extensive learning resources
Pricing:
-
Tableau Creator: $75/user/month (AI not included)
-
Tableau Explorer: $42/user/month (AI not included)
-
Tableau Viewer: $15/user/month (AI not included)
-
Tableau+: Available only on Tableau Cloud (Custom pricing)
Best for: Large organizations with dedicated data teams and complex analytical requirements
3. Power BI - The Microsoft Integration Champion
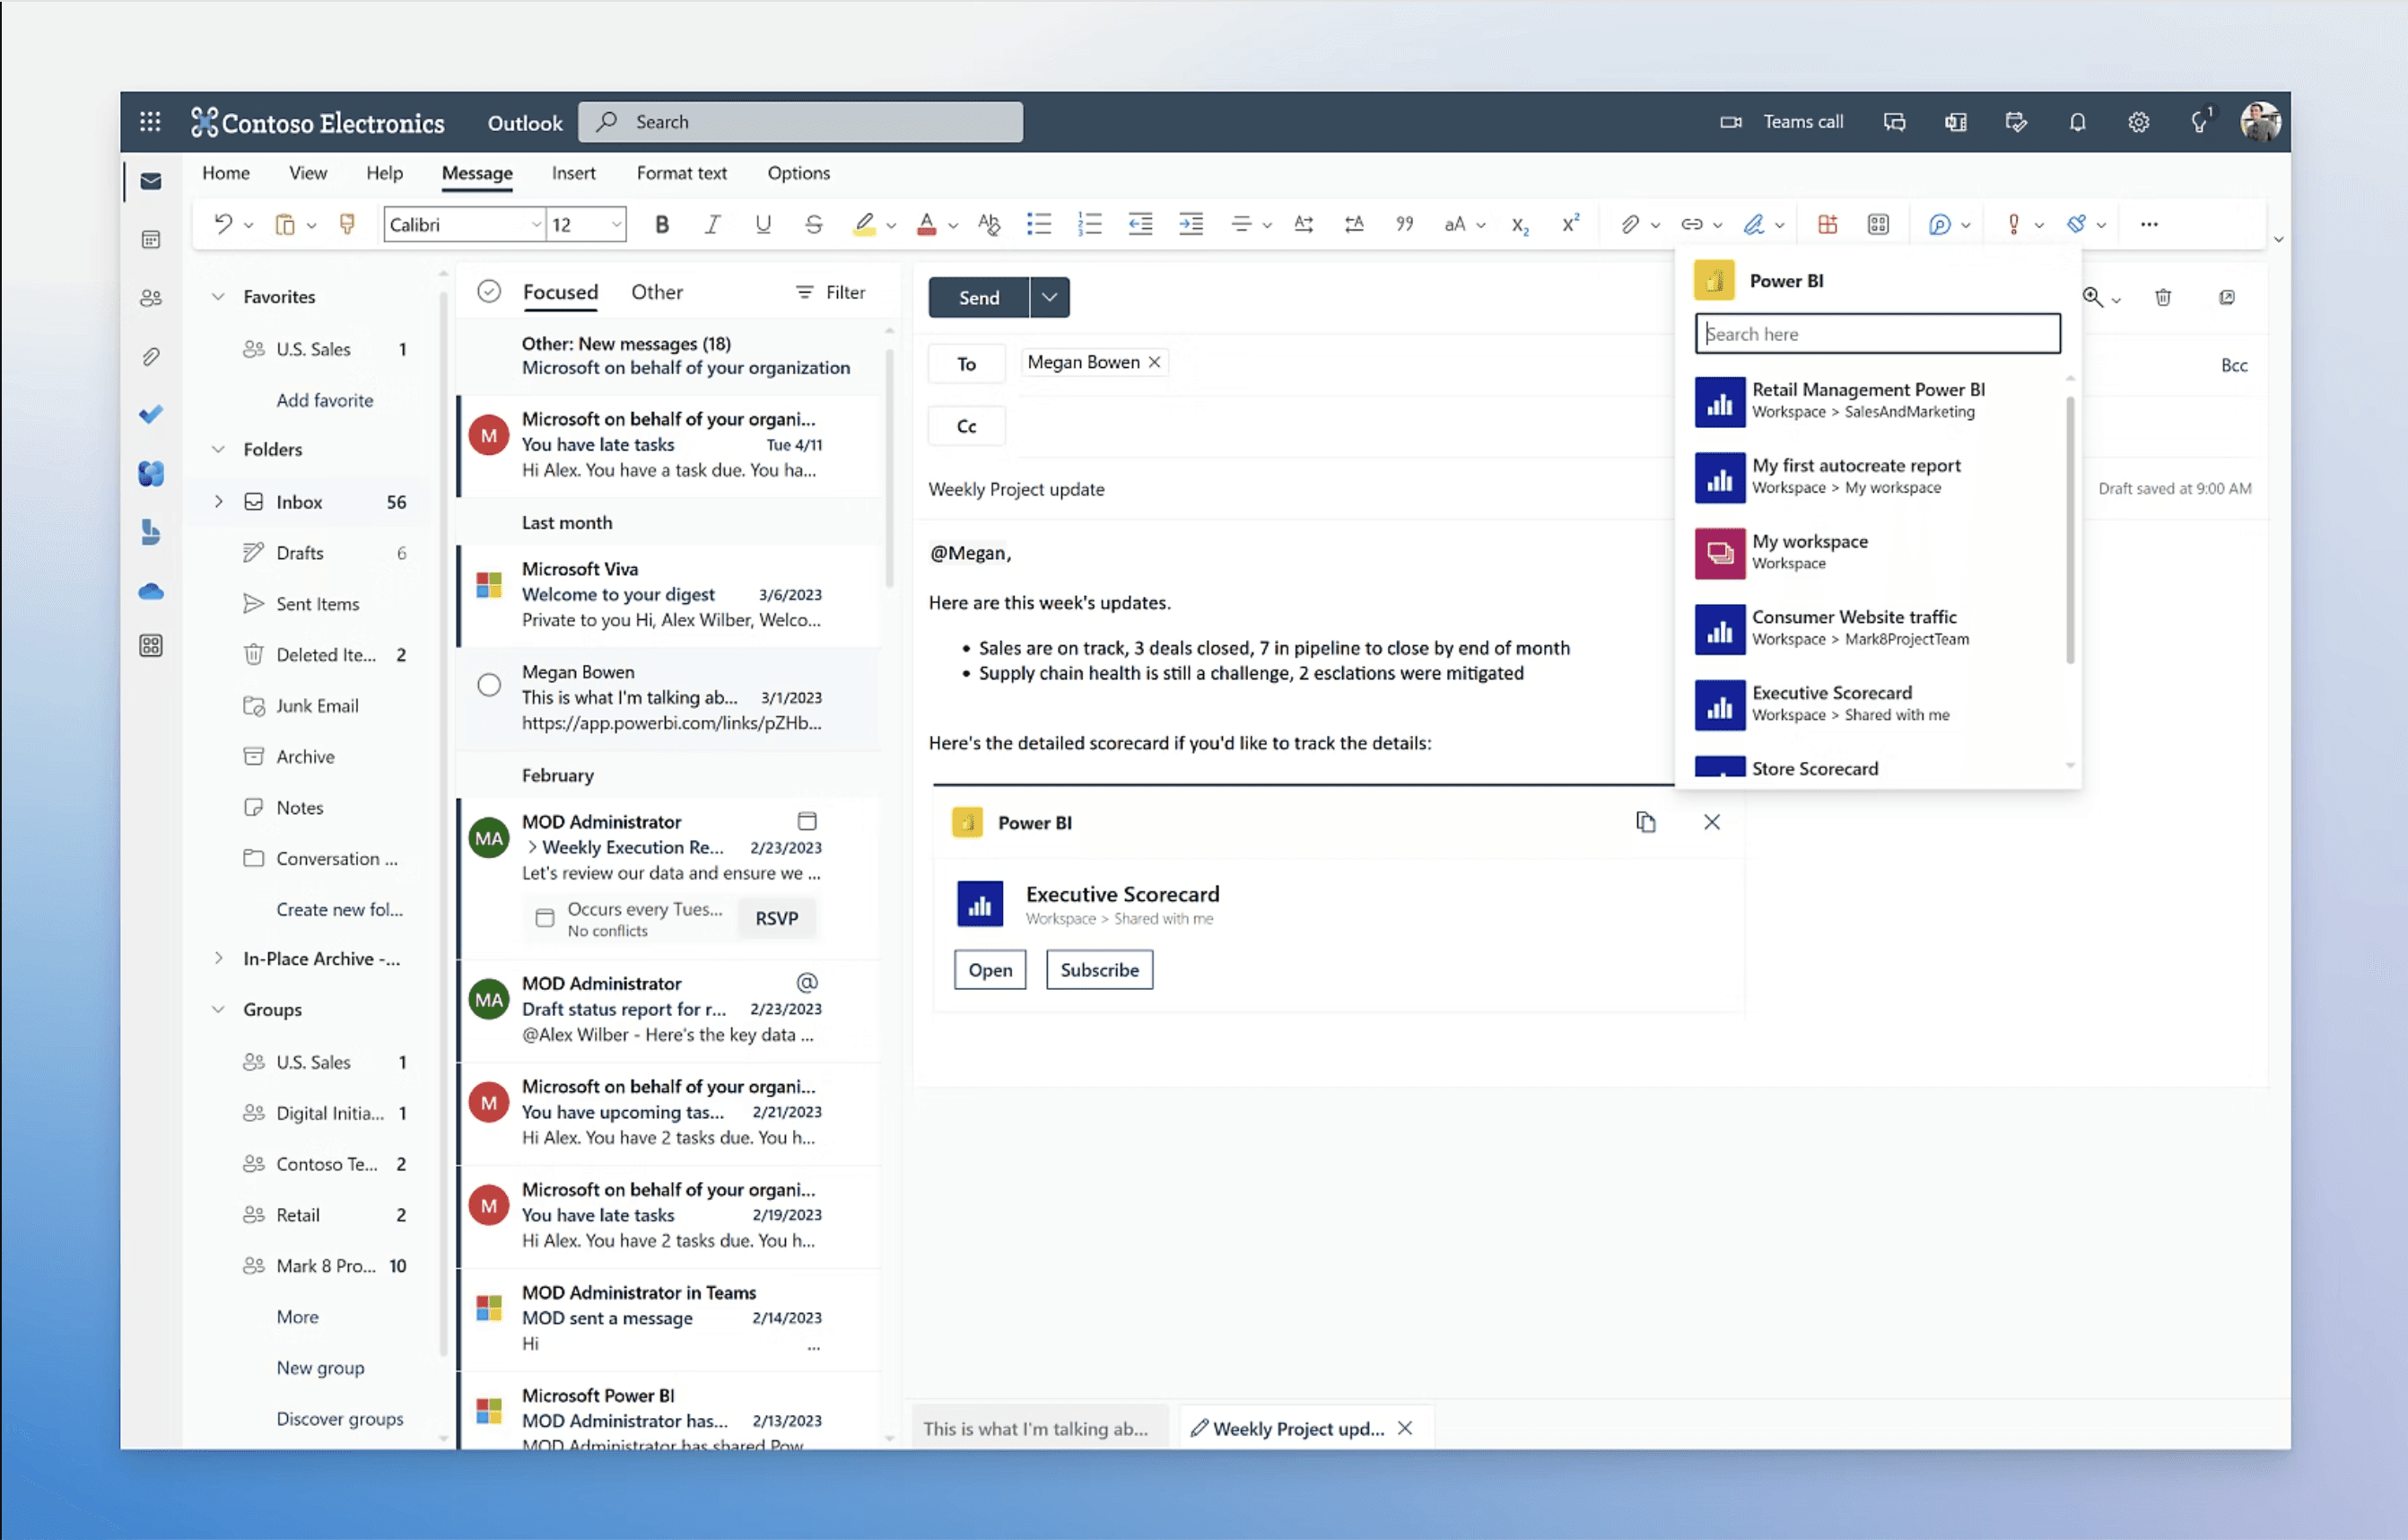
For the eighteenth consecutive year, Microsoft has been positioned as a Leader in the 2025 Gartner Magic Quadrant for Analytics and Business Intelligence Platforms.
Key Strengths:
-
AI Visualizations: Q&A visual allows natural language queries with visual responses
-
Microsoft Integration: Seamless connectivity with Excel, Office 365, and Azure
-
Copilot Integration: AI-powered assistance for data analysis
-
Cost-Effective: Strong value proposition for Microsoft environments
Pricing:
-
Power BI Pro: $14/user/month, no Advanced AI capabilities billed yearly
-
Power BI Premium: $24/user/month, Advanced AI capabilities, 100 GB model memory limit
-
Embedded: Custom pricing
Ideal for: Organizations already invested in the Microsoft ecosystem
4. ThoughtSpot - The Search-Driven Analytics Leader
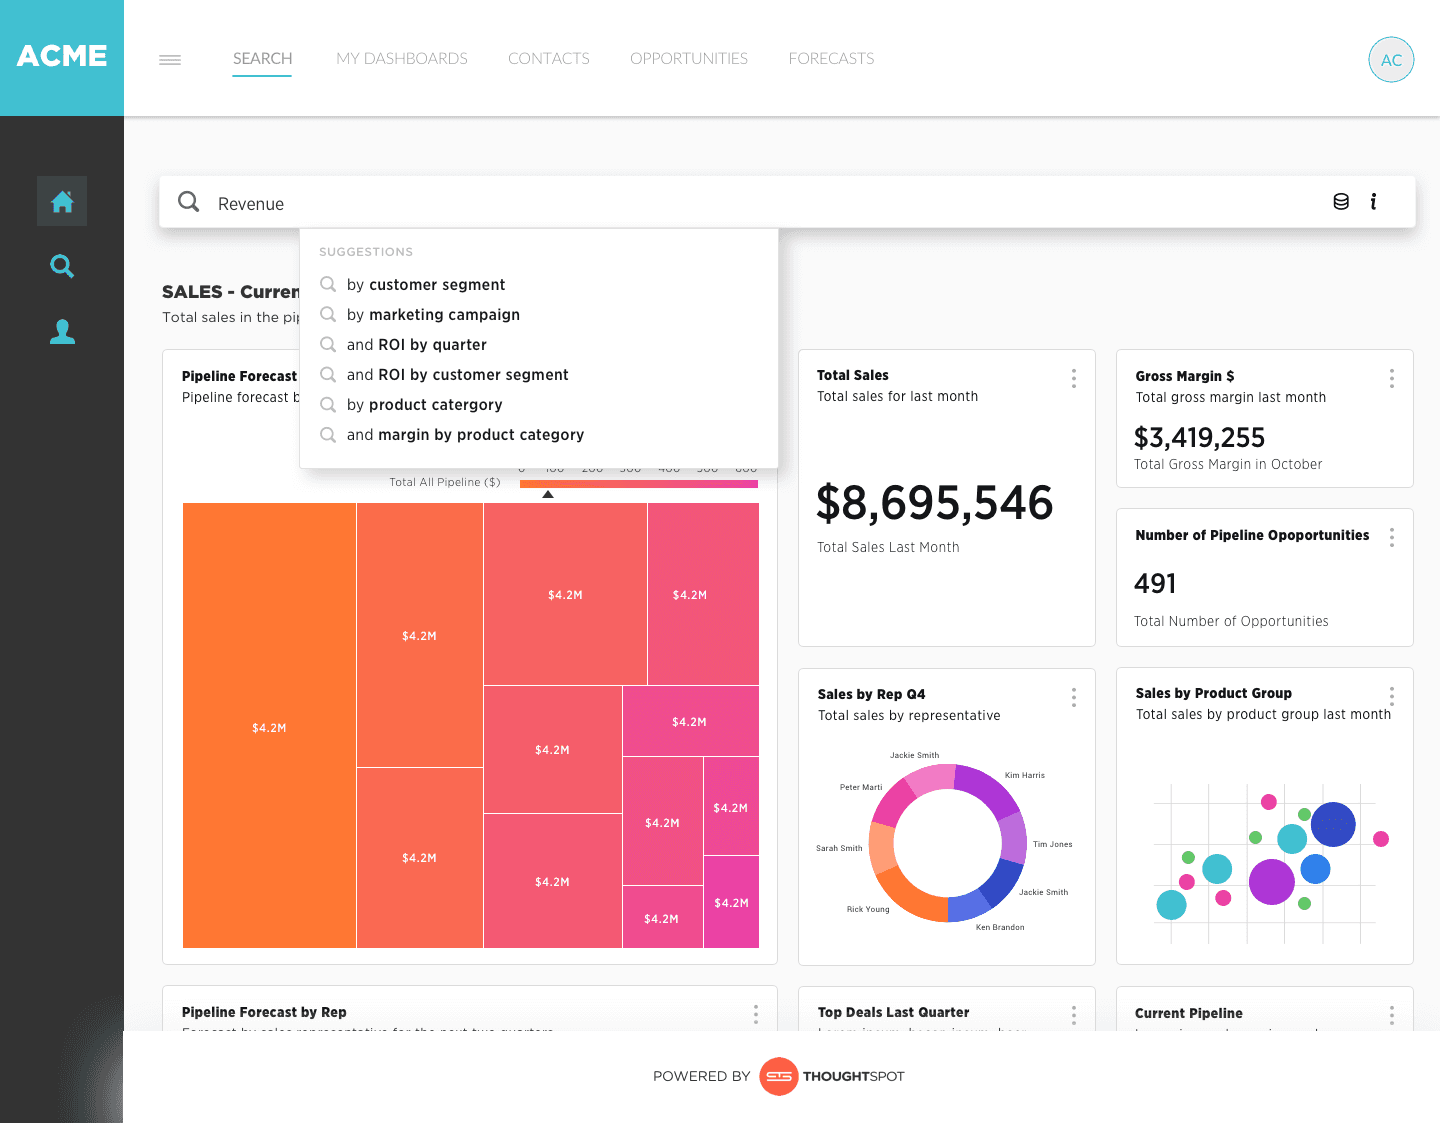
ThoughtSpot pioneered search-driven analytics and continues to innovate with their conversational AI approach.
Notable Features:
-
Search-First Interface: Google-like search for data analysis
-
Sage AI: Natural language processing for complex queries
-
SpotIQ: Automated insight discovery using machine learning
-
Real-Time Collaboration: Share insights across teams instantly
Pricing:
-
Essential: $25/per user, max 25M rows of data, 5-50 users
-
Pro: $50/per user, 25 queries per user on Spotter AI Agent, 50-1000 users
-
Enterprise: Custom pricing
Best for: Organizations wanting Google-like simplicity for data analysis
5. Qlik Sense - The Associative Analytics Expert

For the 15th straight year, Gartner has recognized Qlik as a Leader in Magic Quadrant for Analytics and Business Intelligence Platforms.
Unique Advantages:
-
Associative Engine: Explore data relationships intuitively without predefined paths
-
Self-Service Capabilities: Empowers business users to create their own visualizations
-
Mobile Optimization: Responsive design for all devices
-
AI Integration: Smart visualizations and automated insights
Pricing:
-
Qlik Sense Starter: $200/month at most 10 users, 25 GB data process limit, 5 GB max app size
-
Qlik Sense Standard: $825/month, 25 GB data process limit, advanced analytics, no-code automation builder, GenAI insights, 5 GB max app size
-
Qlik Sense Premium: $2750/month, 50 GB data process limit everything in Standard + predictive analytics, additional GenAI capacity, 10 GB max app size
-
Qlik Sense Enterprise: custom, 250 GB data process limit, everything in Premium, 15 GB max app size
Perfect for: Organizations wanting flexible, self-service analytics
6. Looker - The Google Cloud Native Solution

Looker's Conversational Analytics empowers everyone in your organization to access the wealth of information within your data through Google's Gemini AI integration.
Key Features:
-
Conversational Analytics: Powered by Gemini for natural language data exploration
-
Semantic Layer: Consistent business logic across all analyses
-
Google Cloud Integration: Native connectivity with Google ecosystem
-
LookML: Code-based modeling for advanced users
Pricing:
- Custom pricing based on usage and features
Best for: Organizations using Google Cloud infrastructure
7. Polymer - The AI-First Analytics Platform

Polymer focuses on AI-driven automatic analysis that reveals patterns and insights without manual intervention.
Standout Features:
-
PolyAI: Conversational AI for data exploration
-
Automated Insights: AI analyzes data to reveal patterns and opportunities
-
Visual Variety: Over 20 chart types with smart suggestions
-
Easy Setup: Point-and-click dashboard creation
Pricing:
-
Starter: $50/user/month, 1 Account per Data Connector, 10 PolymerAI Chat Responses, 1 Custom Template
-
Pro: $100/user/month, up to 5 Account per Data Connector, 20 PolymerAI Chat Responses, 5 Custom Template
-
Teams: $250/month, at most 3 editor, up to 15 Account per Data Connector, 30 PolymerAI Chat Responses, Unlimited Templates
Ideal for: Small to medium businesses wanting AI-powered insights
The Future of Interactive Data Visualization
Conversational AI is Everything
Nearly everything today – from the way we work to how we make decisions – is directly or indirectly influenced by AI. In data visualization, this means:
-
Natural Language Processing: Ask questions in plain English, get answers in context
-
Automated Insights: AI proactively identifies trends and anomalies
-
Predictive Analytics: Visualize not just what happened, but what might happen next
Real-Time, Always-On Analytics
Mobile-first design will continue to not only remain, but grow, as a core component of contemporary data visualization trends. The future is:
-
Mobile-first interfaces optimized for smartphones and tablets
-
Real-time data streaming for instant decision making
-
Edge computing for faster processing and reduced latency
Democratized Data Access
The biggest trend? Everyone becomes a data analyst. When a user asks questions the way they want, it is the job of the bot to understand and guide the user to a relevant and actionable insight.
How to Choose the Right Tool for Your Team
For Fast-Growing Startups
Choose Datapad if you want to start getting insights immediately without technical complexity. Our conversational analytics approach means your team can ask questions and get answers without learning a new interface.
For Large Enterprises
Consider Tableau or Power BI if you need advanced customization, complex data modeling, and you have Tableau/PowerBI Developer in your team.
For Google Cloud Users
Looker offers the best integration with Google's ecosystem and powerful conversational analytics through Gemini AI.
For Self-Service Analytics
Datapad excels at empowering business users to explore data independently with its associative engine.
Getting Started with Conversational Analytics
The future of data visualization isn't about learning complicated tools—it's about having natural conversations with your data. Here's how to get started:
1. Start with Your Questions
Instead of thinking about charts and dashboards, start with the business questions you need answered:
-
"What's our customer acquisition cost trend?"
-
"Which marketing channels are driving the most qualified leads?"
-
"How does our performance compare to last quarter?"
2. Choose Tools That Speak Your Language
Look for platforms that support natural language queries and provide contextual insights, not just visualizations.
3. Prioritize Real-Time Insights
Continuous data visualization will help organizations spot trends, patterns, and anomalies the moment they arise. Choose tools that offer live data connections.
4. Focus on Collaboration
The best insights come from team discussions. Choose tools that make it easy to share, discuss, and act on insights together.
Ready to Transform Your Data into Conversations?
The era of static dashboards is over. Conversational analytics is here, and it's changing how we interact with data forever.
Want to experience the future of data visualization? Start your free Datapad trial today and discover how conversations with your data can transform your decision-making process.
With Datapad, you can:
-
Connect all your data sources (Google Ads, Facebook Ads, Google Analytics, Databases and 25+ more)
-
Ask questions in plain English and get instant, contextual answers
-
Get AI-powered insights that help you understand not just what happened, but what to do next
-
Collaborate with your team directly on insights and recommendations
The tools are here. The technology is ready. The question is:Are you ready to start talking to your data?
Start your free Datapad trial and join the conversational analytics revolution today.
Transform your data strategy with conversational analytics. No coding required. No complex interfaces. Just natural conversations that drive real business results.