
Are you trying to figure out a way to impress your investors while your fundraising rounds? If yes, KPI reports can be your solution as they can save your investors’ time and make them come to a conclusion quickly.
KPI reports are a compilation of all crucial KPIs that your company tracks. It could help inventors, team members, and business leaders make calculated decisions based on the same.
In this article, we will tell you the basics of KPI reports, their benefits, types, KPI examples that make up a report, and much more.
So let’s dive straight into the guide.

What is a KPI Report?
A KPI report is a performance measurement tool that allows you to track, measure, and analyze crucial business KPIs and gauge the overall business performance with respect to set goals.
A typical KPI report consists of several data visualization elements such as graphs, charts, tables, and more to present complex data in an easy-to-read format. However, as said, modern-day KPI reports are dynamic in nature and surface an interactive interface.
This means you can easily reorganize elements to display information in a way that is pleasant to the eyes. In addition, you can instantly access your report from anywhere around the world.

What Are the Benefits of KPI Reports?
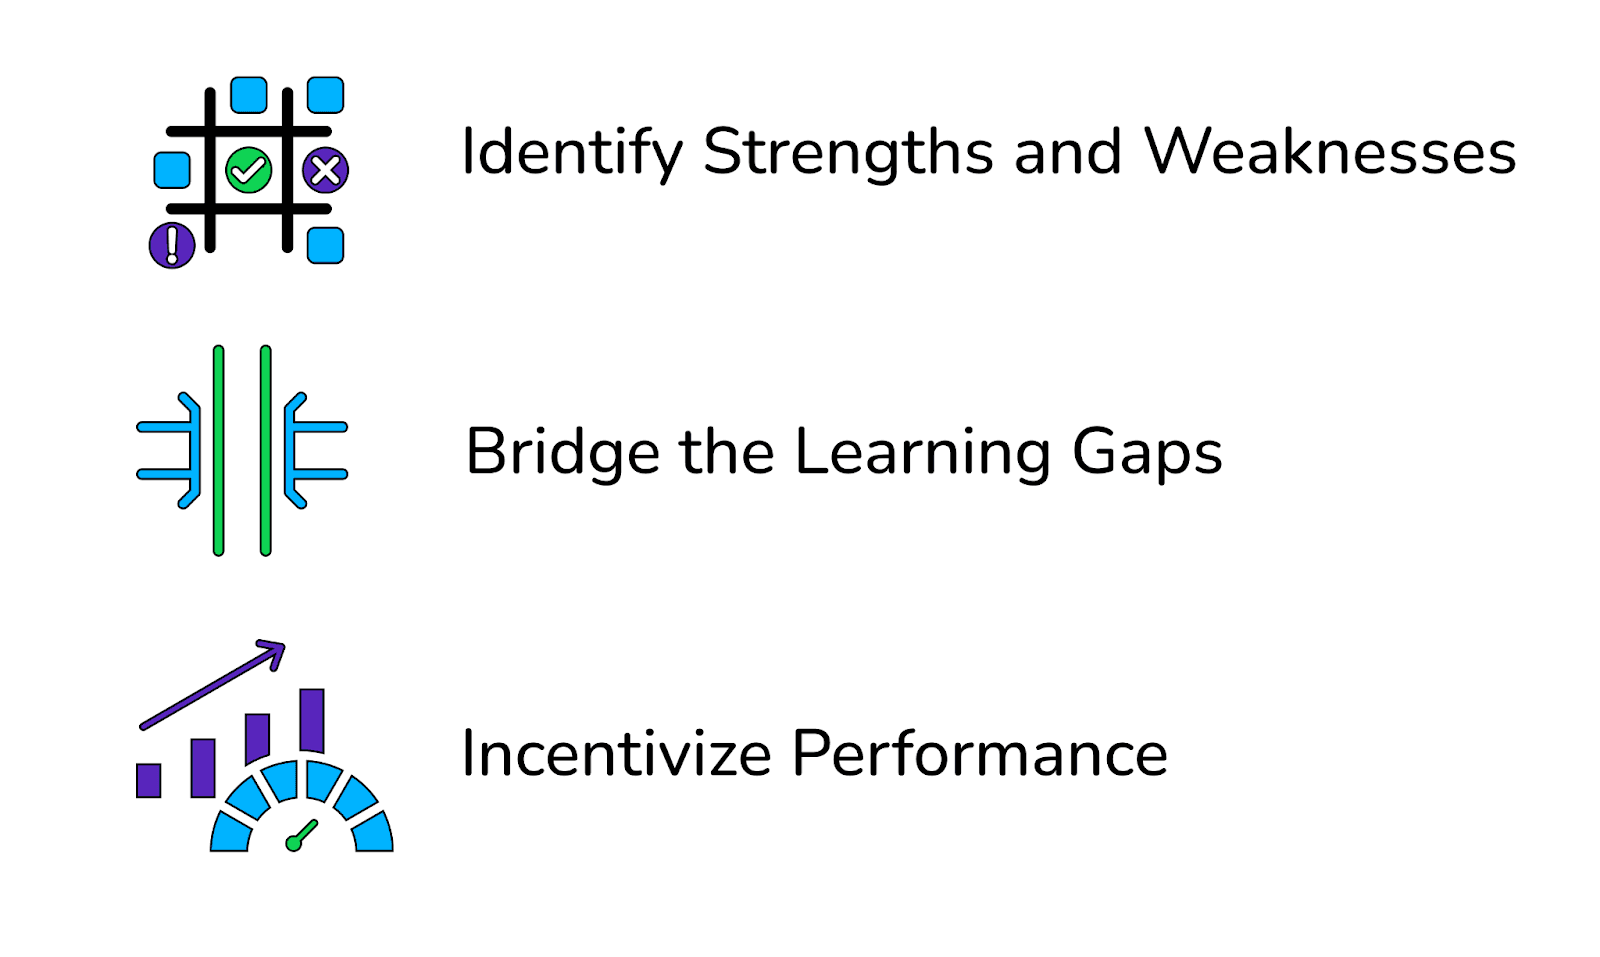
Benefit #1. Identify Strengths and Weaknesses
Not surprisingly, KPI reports are built to present data in an easy-to-understand format. This, in turn, helps managers and business owners easily identify trends over time.
They get a crystal-clear idea of what strategies or loopholes can make or break their business. Moreover, managers can use this information to grasp hidden opportunities within their business strategies.
In a similar way, with the help of KPI reports, leaders can identify the strengths and weaknesses of the organization based on factual, reliable data instead of guesswork.
For example, if the KPI reports show that a particular business strategy yields better results for the organization, leaders can repurpose or duplicate such strategies for multiple departments.
Benefit #2. Bridge the Learning Gaps
These reports (especially employee KPI reports) analyze employee performance over time. Thereby allowing you to better understand your workforce's capabilities and downsides.
Moreover, making KPI data available to employees can positively direct their behavior. You see, when they know what they are up to and what's expected from them, they tend to adjust their performance toward the measurement.
Benefit #3. Incentivize Performance
Data doesn't lie, and no matter how debatable a topic is, if it has data to prove itself, you can't simply disagree.
The same goes for in-house teams and departments. You can't blame someone for being less productive without proving it, and without knowing their efforts, you can't give them a selfless raise.
A KPI report demonstrates employees' performance towards set goals. Adding incentives to these KPIs is a proven way to improve employees performance, boost morale, and drive record-breaking results.
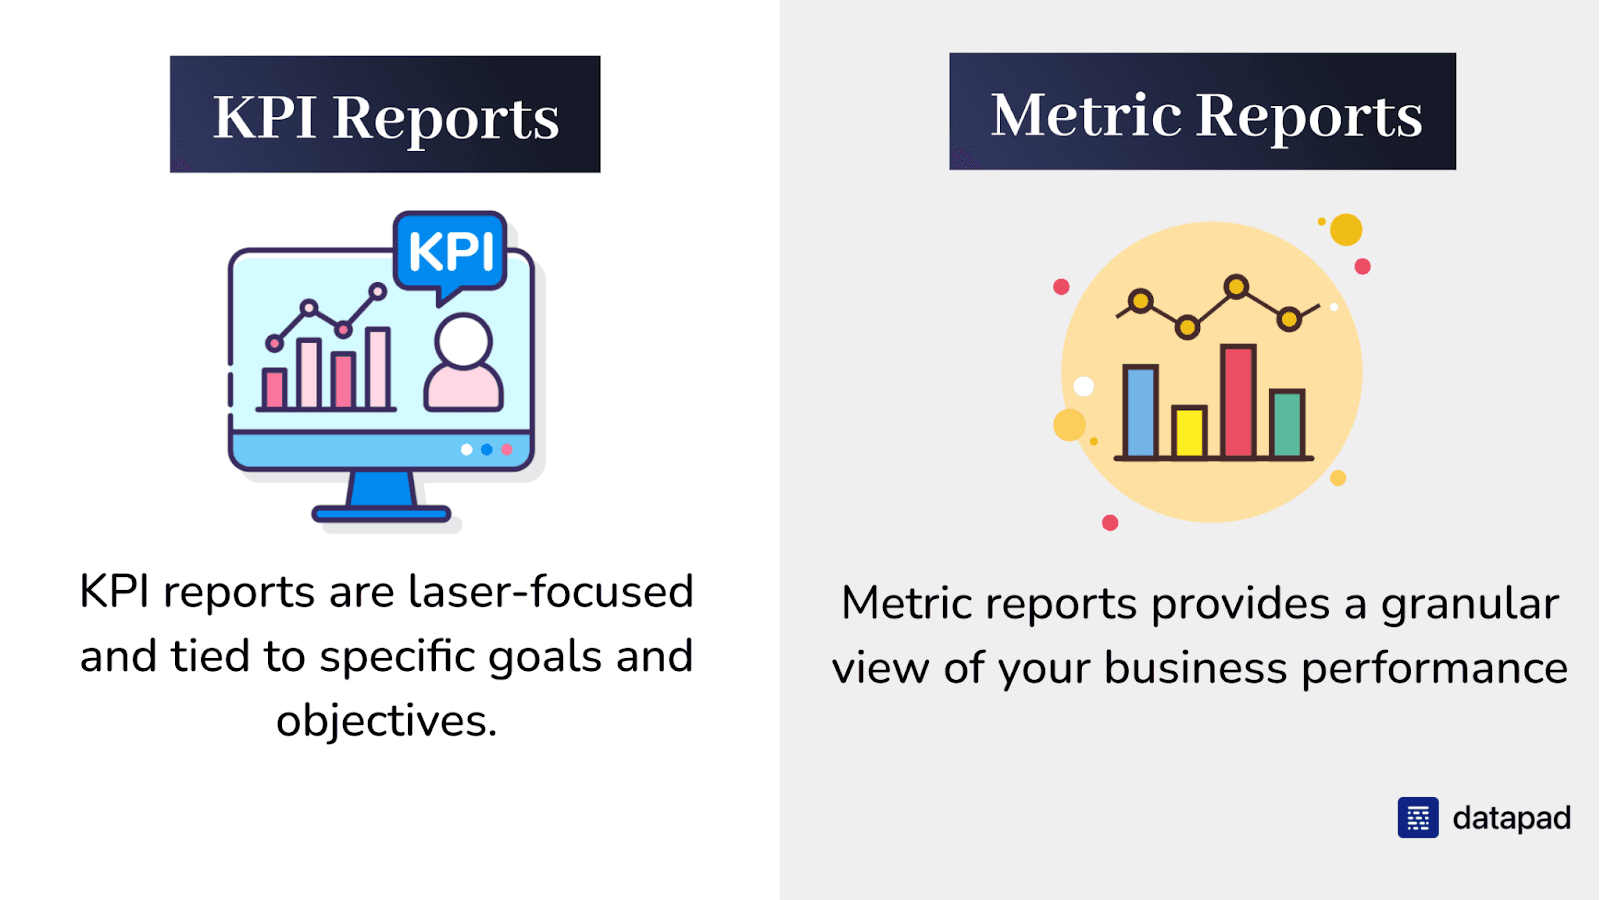
KPI Reports vs. Metric Reports: What Are the Differences?
Although they sound alike, KPI and metric reports are two completely different aspects of measuring your business performance.
A metric is made up of raw data, while a KPI is made up of several metrics.
Hence, metrics reports are used by companies to understand their KPIs, which in turn helps them discover if they're going to meet their goals within the set time frame or not.
Generally, professionals gather crucial business metrics into one comprehensive report, which different departments then use as a reference document to find information about organizational goals.
KPI reports, on the other hand, are laser-focused and tied to specific goals and objectives. Unlike metric reports, which provide a granular view of your business performance, KPI reports revolve around high-level metrics that directly impact your organizational goals.
Types of KPI Reports
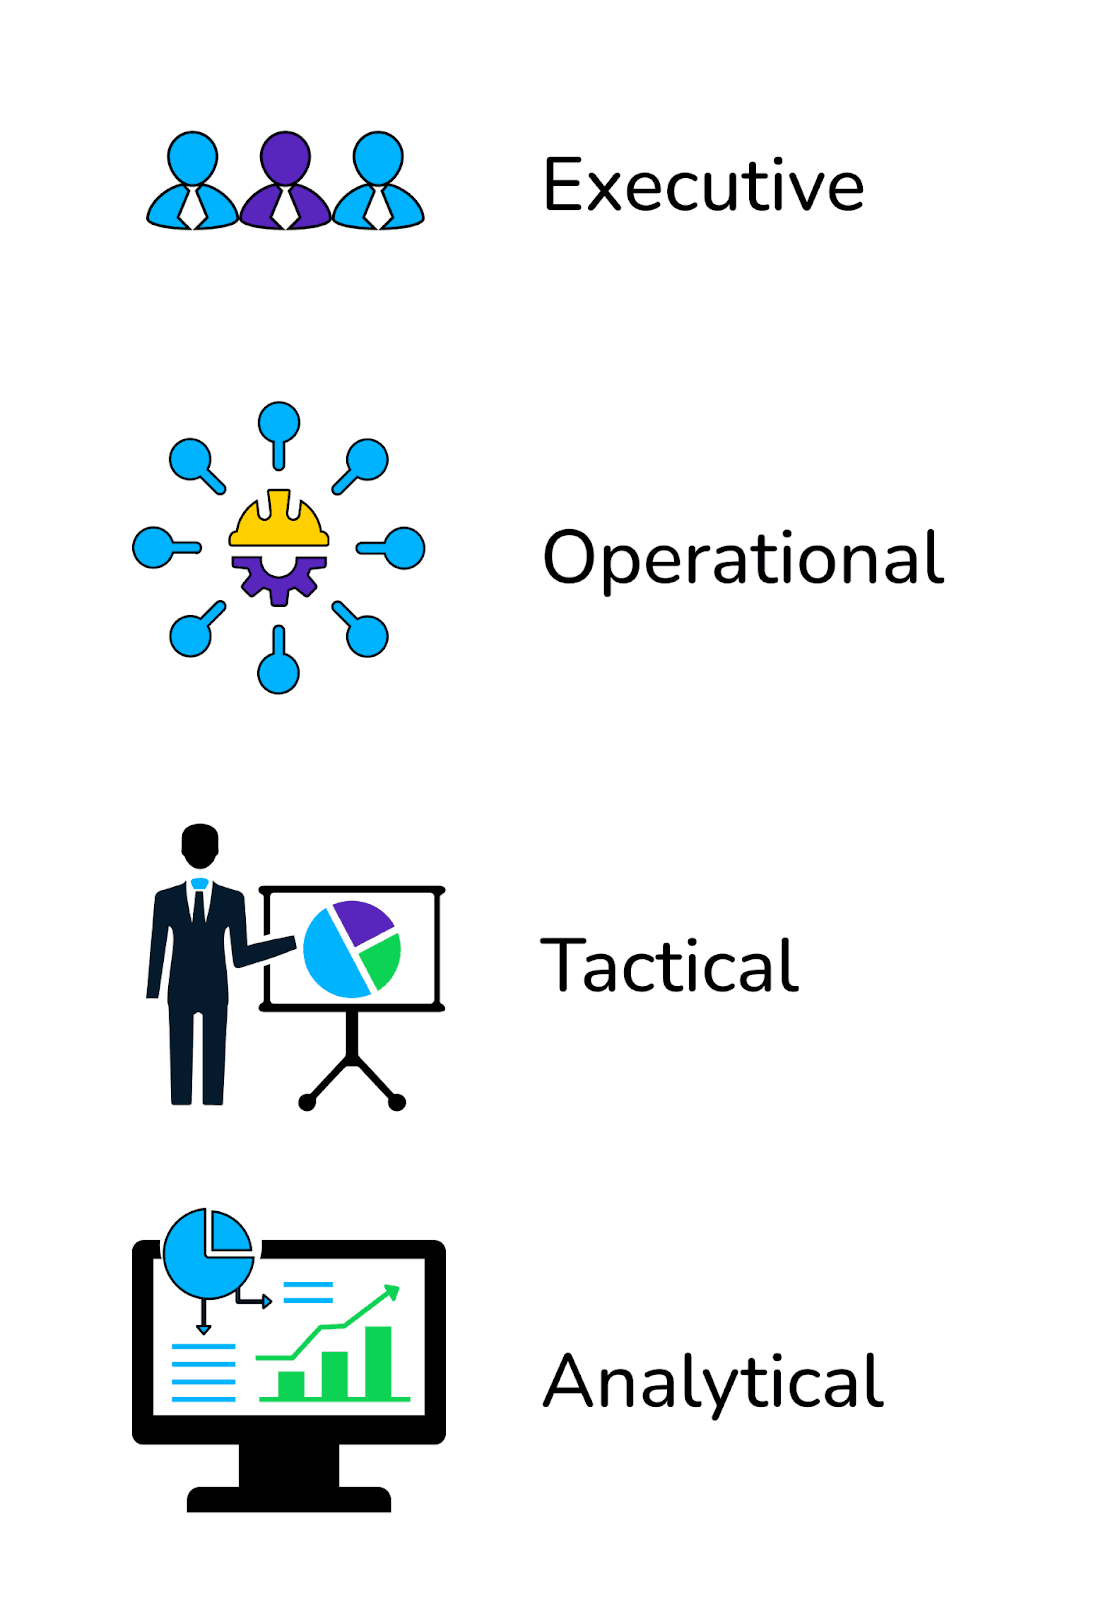
KPI reports are categorized into four types, namely:
Type #1. Executive
An executive KPI report is reserved for long-term strategy building. It measures high-level KPIs and empowers the top management to forecast performance, identify trends, and make better data-driven decisions based on facts.
Type #2. Operational
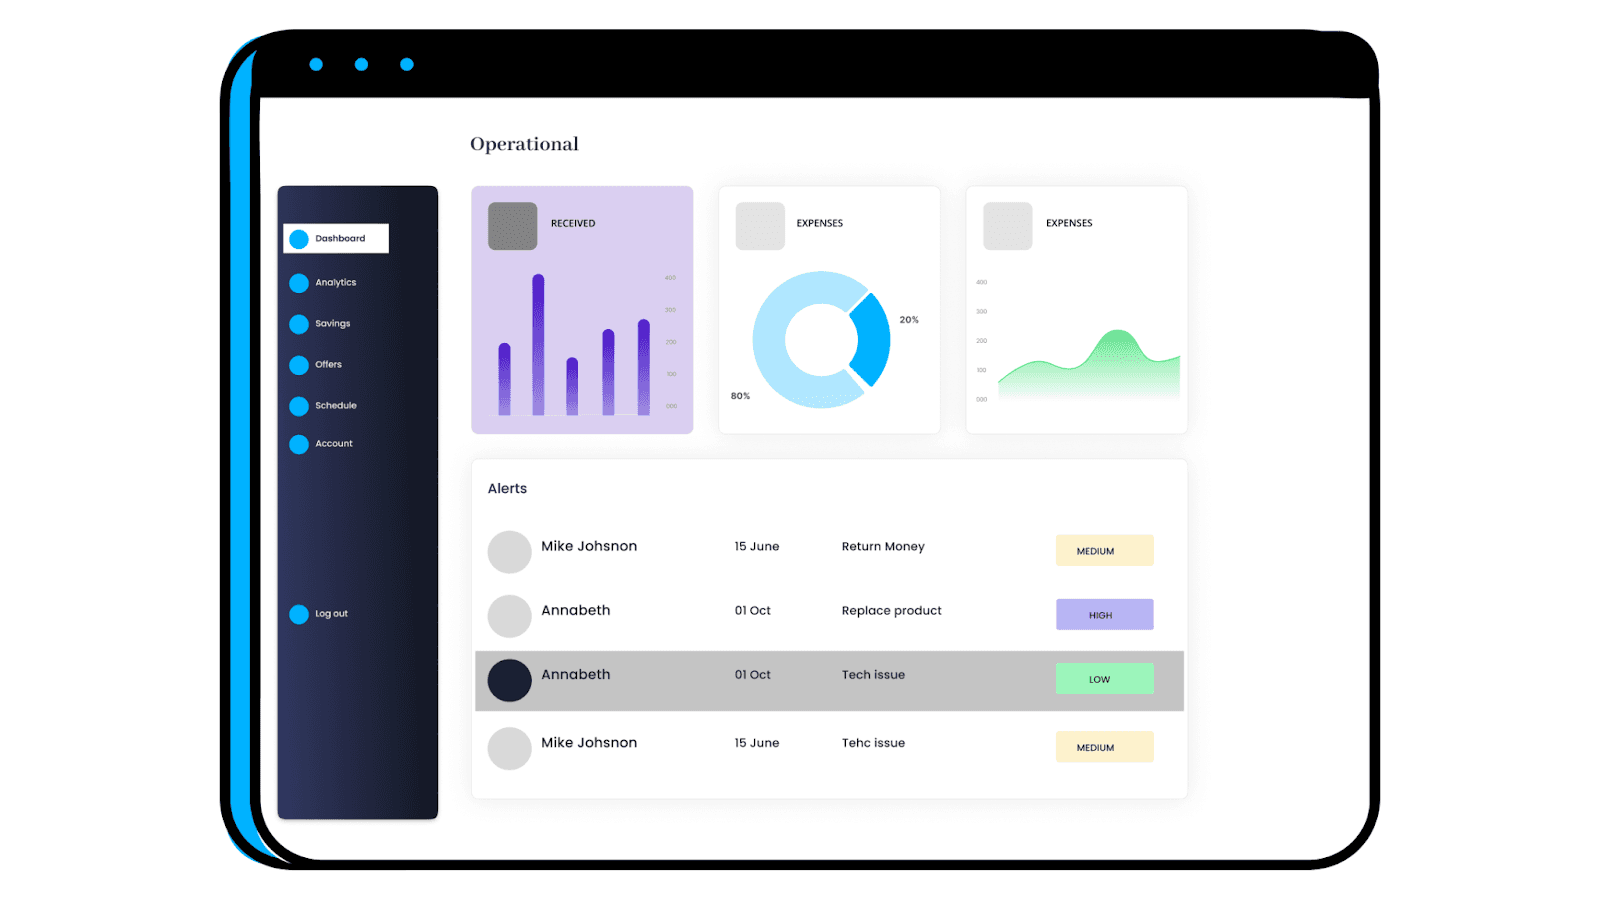
Operational KPI reports comprise day-to-day activities that allow the smooth functioning of your business. The information derived from these reports can be used to make time-sensitive decisions, the ones that might impact the day's business.
Type #3. Tactical
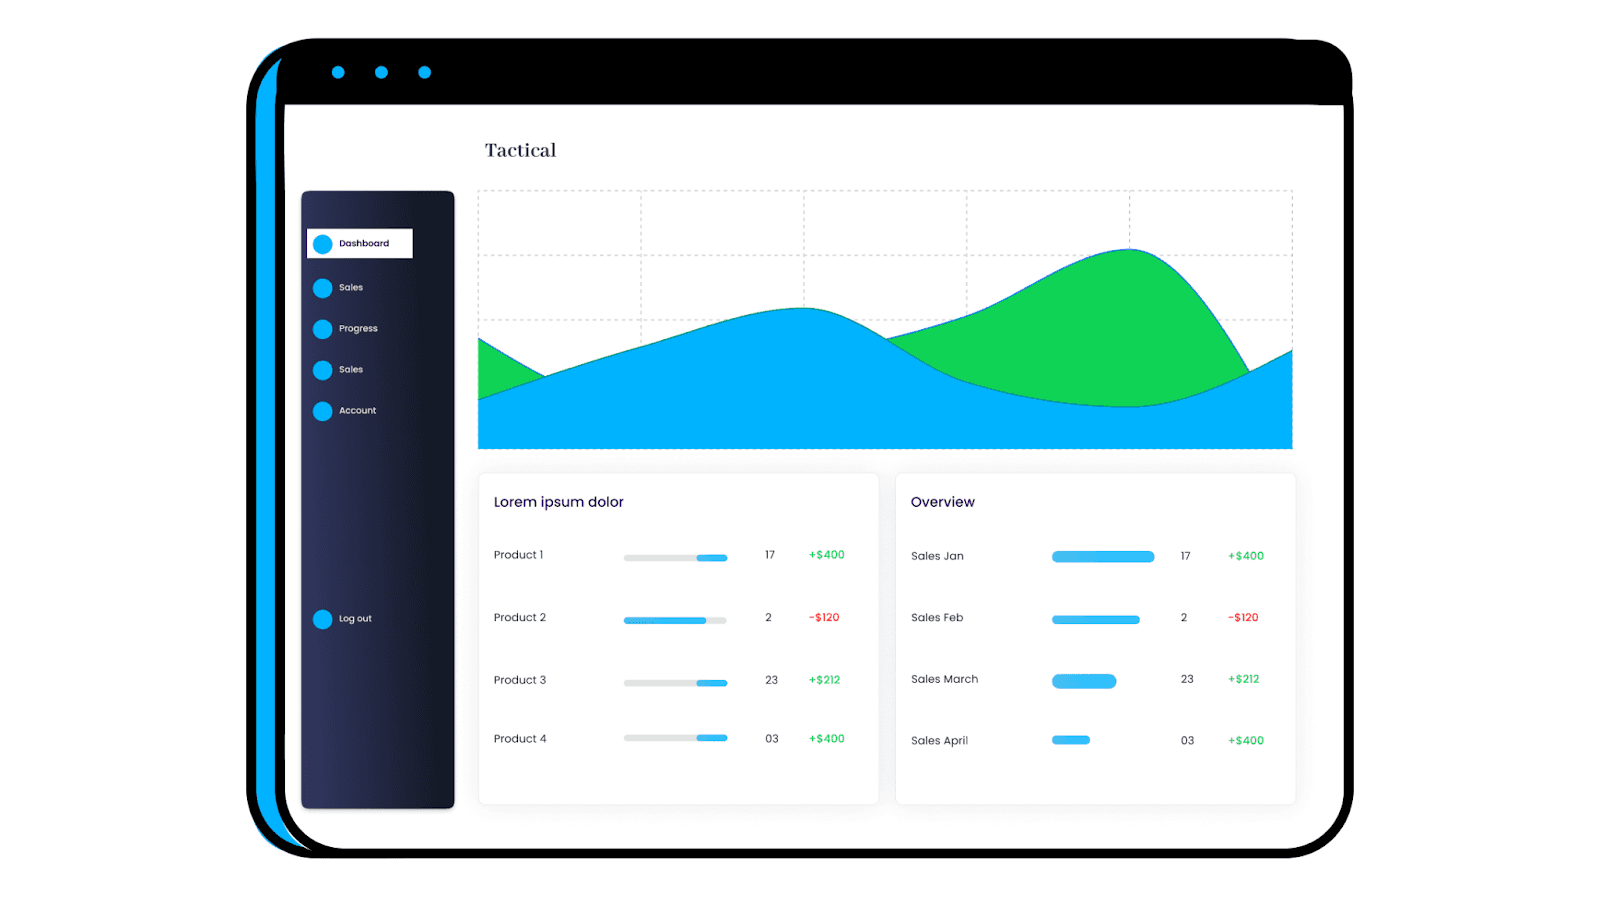
Tactical or strategic KPI reports are considered as a powerful tool for data-driven leaders. It provides in-depth insights into the organization's performance in key business areas. Furthermore, leaders can use this report to gauge the company's performance with respect to set goals.
Type #4. Analytical

Analytical reports provide a comprehensive overview of business KPIs. It provides in-depth details about each KPI and allows you to compare historical trends within the KPI data.
Key Performance Indicator Report Examples
Example #1. Financial KPI Report
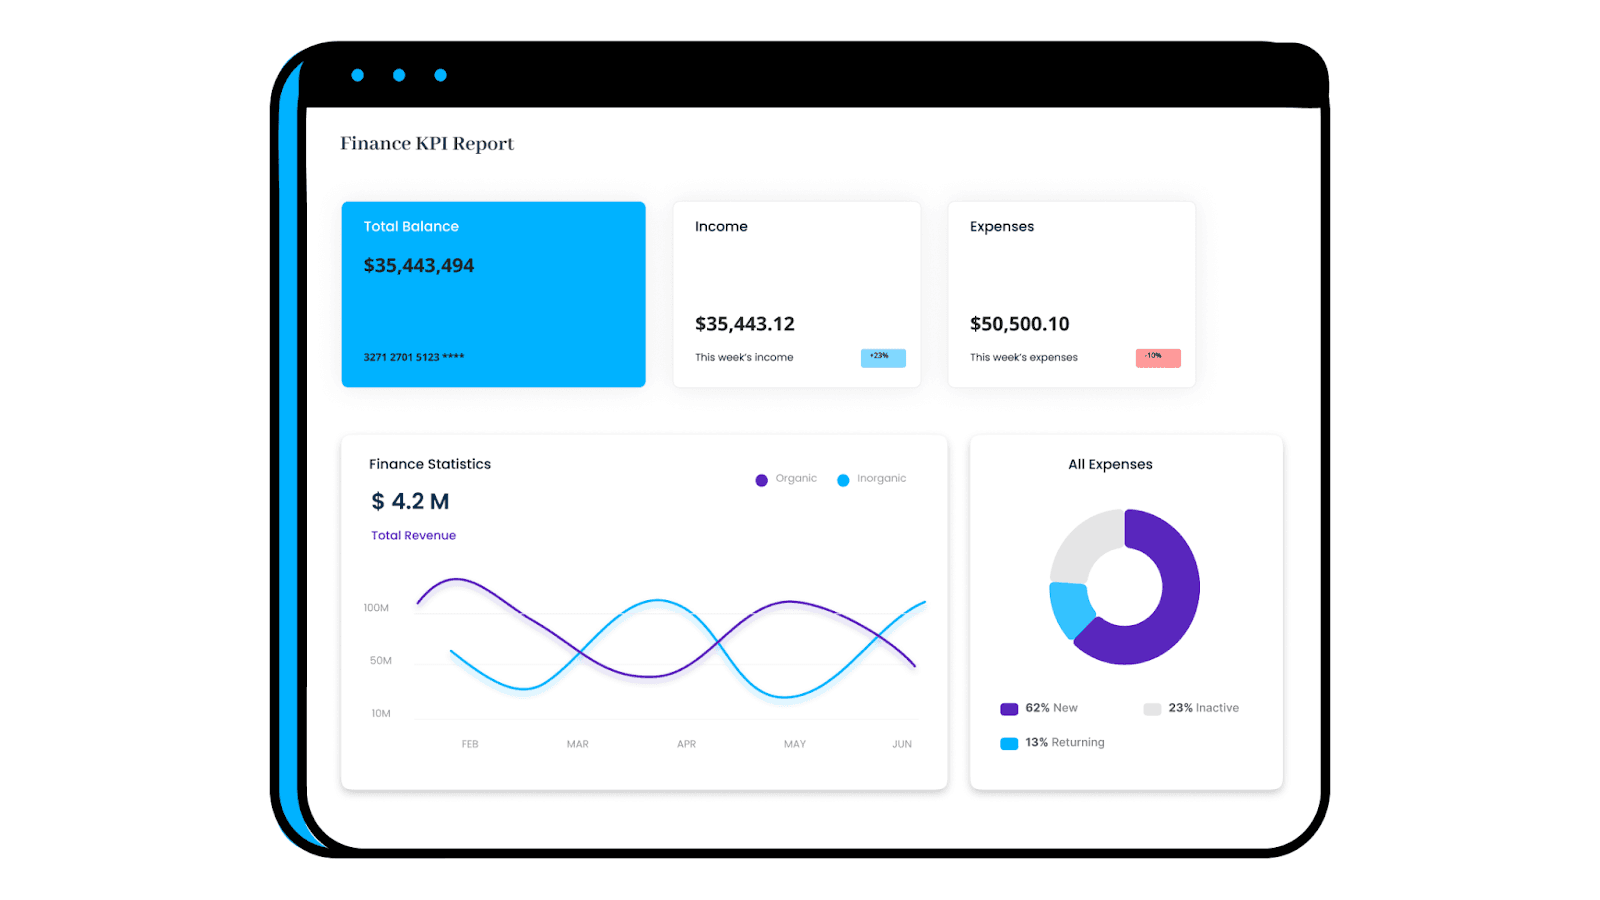
Financial KPI reports help to track and measure your organizational financial health. Besides revenue and profits, a financial KPI report conveys how afloat the organization is in monetary terms. It comprises all your financial data, such as expenses, sales, overheads, and more.
Who Is It For?
Financial admins and departments commonly use financial KPI reports to compare profitability, study cash flow, and determine other financial stats and compare them with their industry benchmarks.
KPIs That Go Into Financial Reports
#1. Total Income: Calculates the amount of money earned during the week; the KPI also shows % growth in income compared to the past weeks
#2. Total Expenses: Comprises of all the expenses (including miscellaneous) made during the week; also shows % ⬆⬇ in expenses compared to past weeks
#3. Account Balance: Shows the remaining balance after accounting for all kinds of expenses
#4. Income to Spending Ratio: A financial trajectory showing the amount of money earned and spent on a yearly basis
#5. All Expenses: A somewhat granular metric that displays all expenses made over a period with the help of a pie chart highlighting the various categories of expenses
Example #2. Employee KPI Report
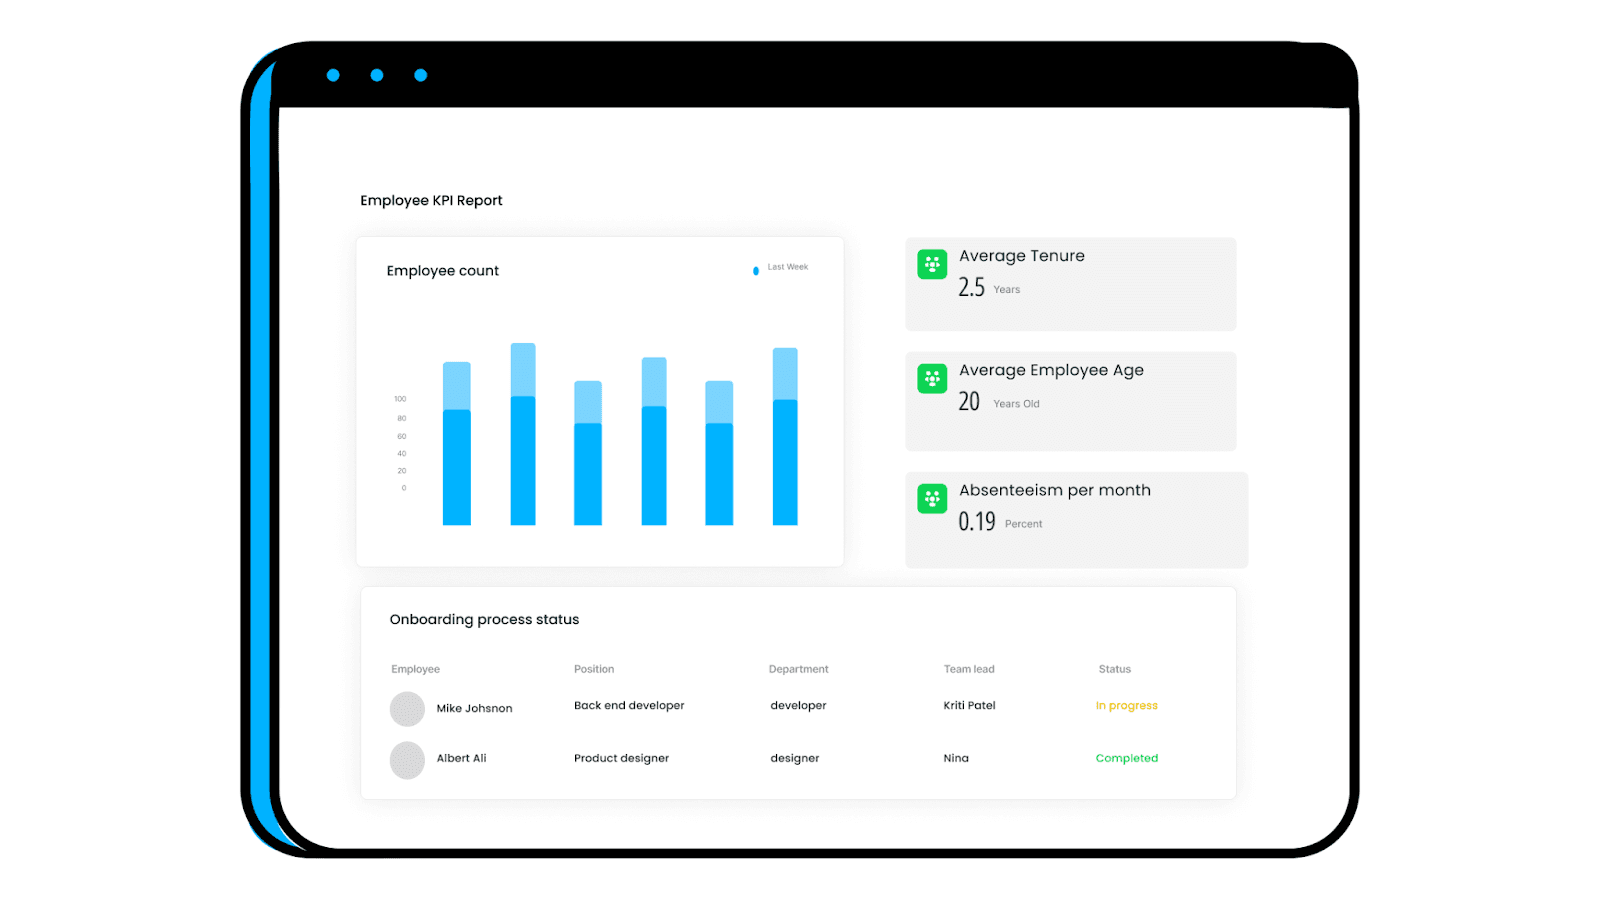
Employee KPI report tracks, monitors, and analyzes employees' performance over time. It comprises everything that comes under an HR job description, from individual employee overview to onboarding process and payroll updates.
Who Is It For?
HR professionals or recruitment firms generally use employee KPI reports to keep track of employee data and streamline recruitment processes.
KPIs That Go Into Employee Report
#1. Employee Count: Use of a stacked bar graph to display the increase and decrease in the number of employees on a monthly basis
#2. Average Tenure: Measures the time (in years) an employee stays with the organization; generally provides an excellent overview of your retention strategies and the company's working culture
#3. Average Employee Age: Not among popular KPIs but essential to measure when you have a product that’s age-specific or you want young talent in your company
#4. Absenteeism Rate: Measure the rate at which employees take leave from work
#5. Onboarding Process Status: Allows HR executives to streamline the onboarding process
Example #3. Customer Service KPI Report
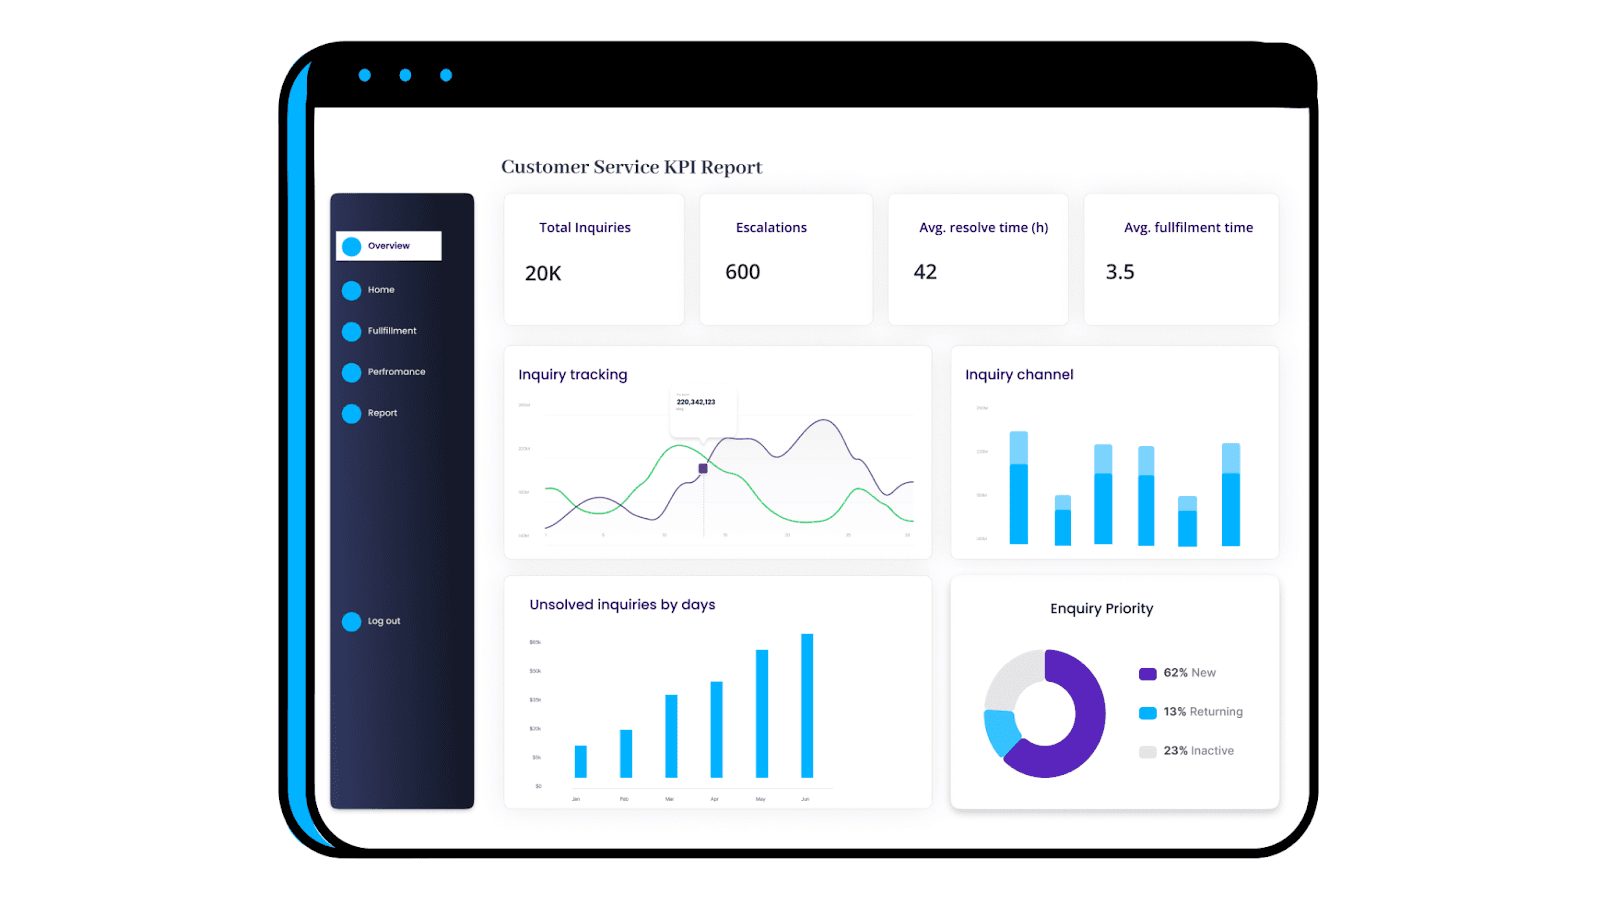
A customer service KPI report provides insights into the efficiency of your customer support department. In fact, in today's scenario, these reports play a crucial role in understanding the performance and efficiency of your customer support teams.
Who Is It For?
This report is typically used by SaaS (Software as a service) companies to monitor support executives because of the number of metrics they need to track. However, it's also popular among e-commerce companies aiming for impressive customer service.
KPIs That Go Into Customer Service Report
#1. Total Inquiries: Total number of tickets generated by customers via different platforms or devices; also allows to measures the variations in the number of tickets over time
#2. Escalation Rate: The percentage of support tickets escalated to a new support executive, generally on a senior level
#3. Avg. Resolution Time: Measures the average time a support executive takes to resolve a customer support inquiry
#4. Avg. Fulfillment Rate: Averaging the number of correctly served requests over the total number of requests
#5. New vs. Resolved Inquiries: A comparative KPI that displays the trajectory for new and resolved tickets over a given time.
#6. Unresolved Inquiries: Measures the total number of unresolved inquiries per day (typically measured in percentage)
#7. Inquiry Per Channel: Organizes the total number of inquiries via various channels and present insights in an organized manner via stacked bar graphs and colors
Example #4. Sales KPI Report

Sales KPI reports are used to measure and evaluate the effectiveness of the sales department. It helps you monitor three crucial aspects of sales:
-
Total sales
-
Total profits
-
Customer Loyalty
Thereby providing you with a comprehensive outlook on your sales efforts.
Who Is It For?
Sales play a significant role in the success of a company. Hence, sales KPI reports are valuable for higher authorities and sales teams who constantly worry about sales figures.
KPIs That Go Into Sales Report
#1. Total Orders: Comprises the number of orders received via different sources during a given period
#2. Total Sales: Accounts for the total revenue generated from selling products or services over the period; can use this KPI to compare present and past sales results easily
#3. Sales Per Channel: Organizes and segment sales based on source (online/offline) and measures the number of returns from overall sales
#4. Customer Loyalty Rate: To track and analyze the ratio of loyal or existing customers to new customers
#5. Avg. Order Value: Tracks the average dollar amount a customer spends per transaction with your store
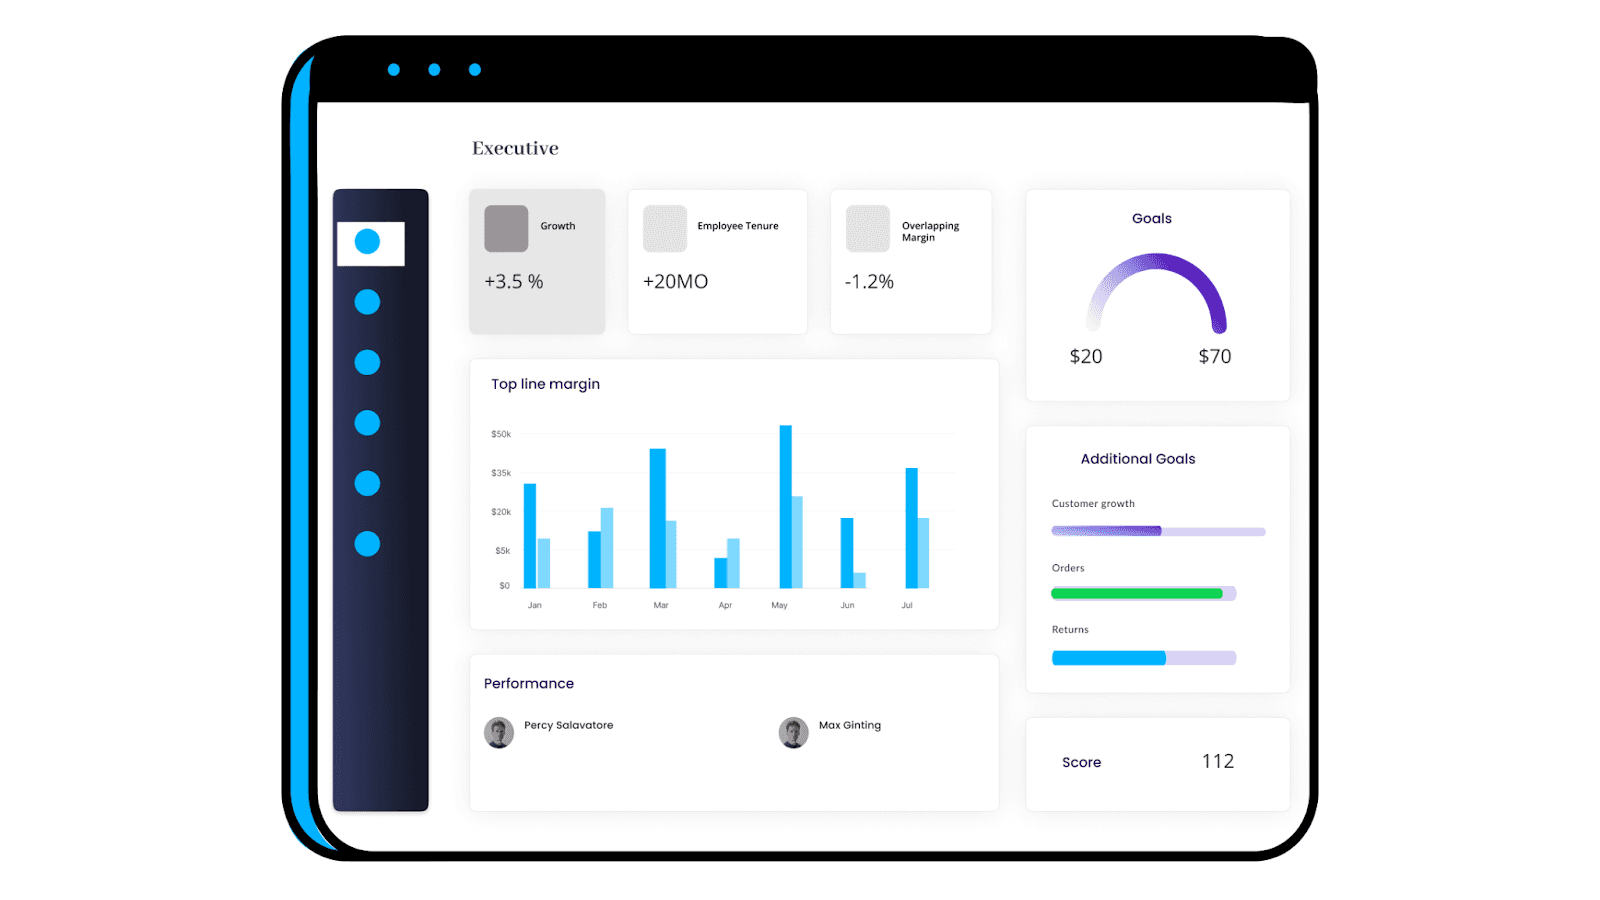
Example #5. SaaS Executive KPI Report
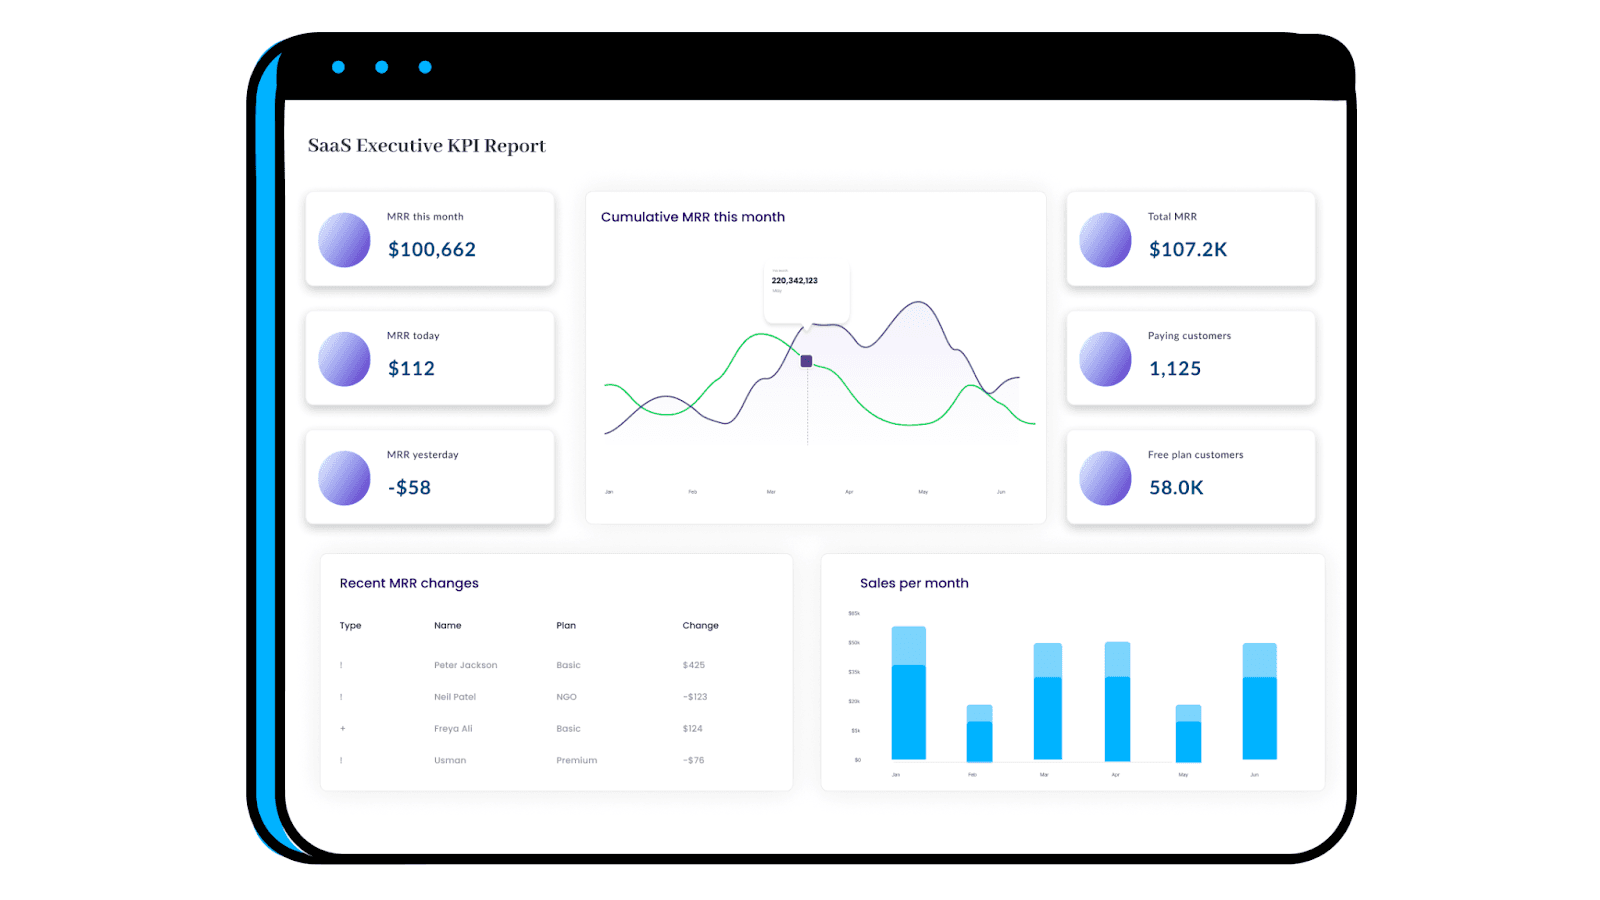
The SaaS Executive KPI Report visualizes important metrics related to the company's overall performance.
In particular, it covers data related to financial health, growth, customers, and other areas of strategic importance. Everything adds up to answer one question - How’s the company performing right now?’
Who Is It For?
This KPI report is beneficial for executives at SaaS companies and startups with a rather complex pricing model. Also, for those who want full-fledged reporting of their product success under one roof.
KPIs That Go Into SaaS Executive Report
#1. Monthly Recurring Revenue (MRR): The predictable total revenue generated by your business from all the active subscriptions in a particular month
#2. Monthly Signups: Measures the total number of signup received for paid or unpaid marketing efforts during the month
#3. Daily Active Users (DAU): The total number of unique users who use or engage with your product on a daily basis
#4. Monthly Active Users (MAU): It's a relatively comprehensive metric to DAU that measures the total number of unique users active on your product within a month
#5. DAU to MAU Ratio: This KPI measures the stickiness of your product by telling you how often MAU uses your product on a daily basis
Example #6. Project Management KPI Report
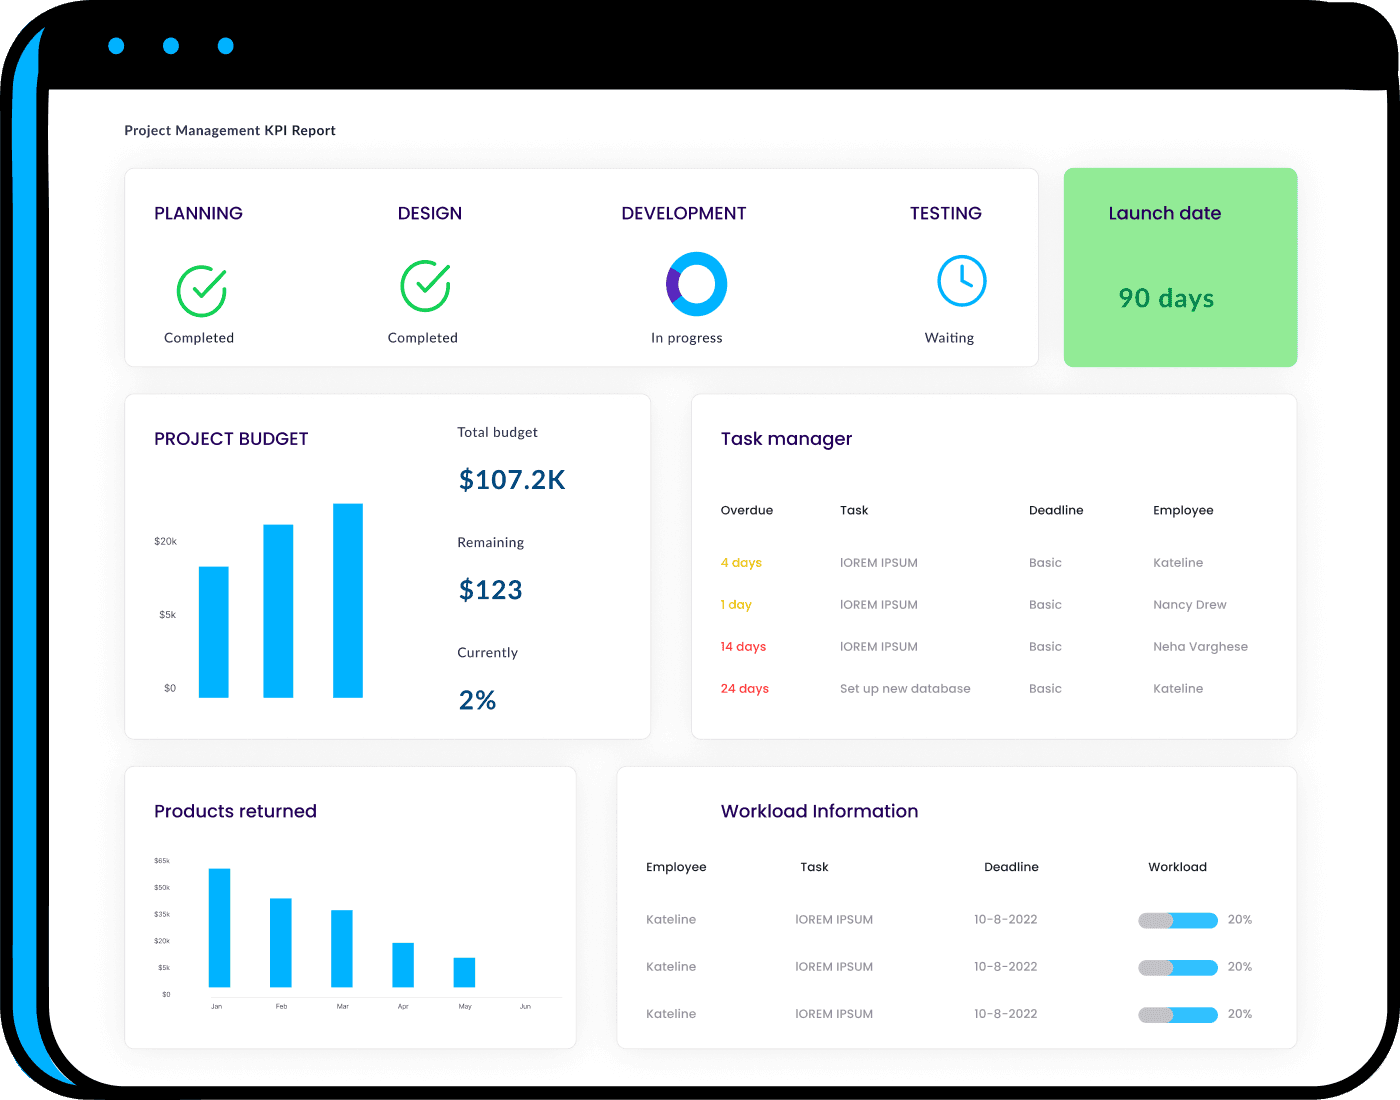
Project management KPI reports are used to track, analyze, and visualize the business processes involved in completing a project. These reports help high-level executives and project managers monitor and streamline complex projects with easy-to-understand visuals.
Who Is It For?
Project management KPI reports are used by software development firms or managers handling several projects simultaneously. These reports help them share the project status with clients and stakeholders in real time.
KPIs That Go Into Project Management Reports
#1. Budget Variance: Measure the difference between the estimated budget (earned value) and actual figures
#2. Workload: Determines the workload pertaining to each team member; also helps in resource allocation if needed
#3. Planned hours vs. Time Spent (overdue): Compares the planned time for completing the project to the actual time taken to complete the project
Example #7. E-commerce KPI Report

The E-commerce KPI report helps you track, monitor, and analyze all fronts of your online store. It gives online store owners an at-a-glance overview of their business, thereby allowing quick and confident decision-making.
Who Is It For?
E-commerce KPI reports are generally used by business owners or marketing agencies who need to prepare attractive reports for clients.
KPIs That Go Into E-commerce Reports
#1. New vs. Returning Visitors: Used for tracking new and returning visitors to your eCommerce site; helps you to evaluate the success of your acquisition and retargeting campaigns
#2. Gross Profit Margin: The leftover revenue after accounting for all direct expenses or Cost of Goods Sold (COGS)
#3. Conversion Rate: It measures the percentage of website visitors who have completed your desired actions out of the total number of visitors
#4. Net Promoter Score (NPS): Measures the overall customer experience of your brand based on customers' feedback and reviews
#5. Bounce Rate: Measures the percentage of visitors that leave your store without taking an action
#6. Cart Abandon Rate: Tracks the percentage of people who add items to their cart but don’t go through the checkout process and buy anything
Example #8. Deliverability KPI Report
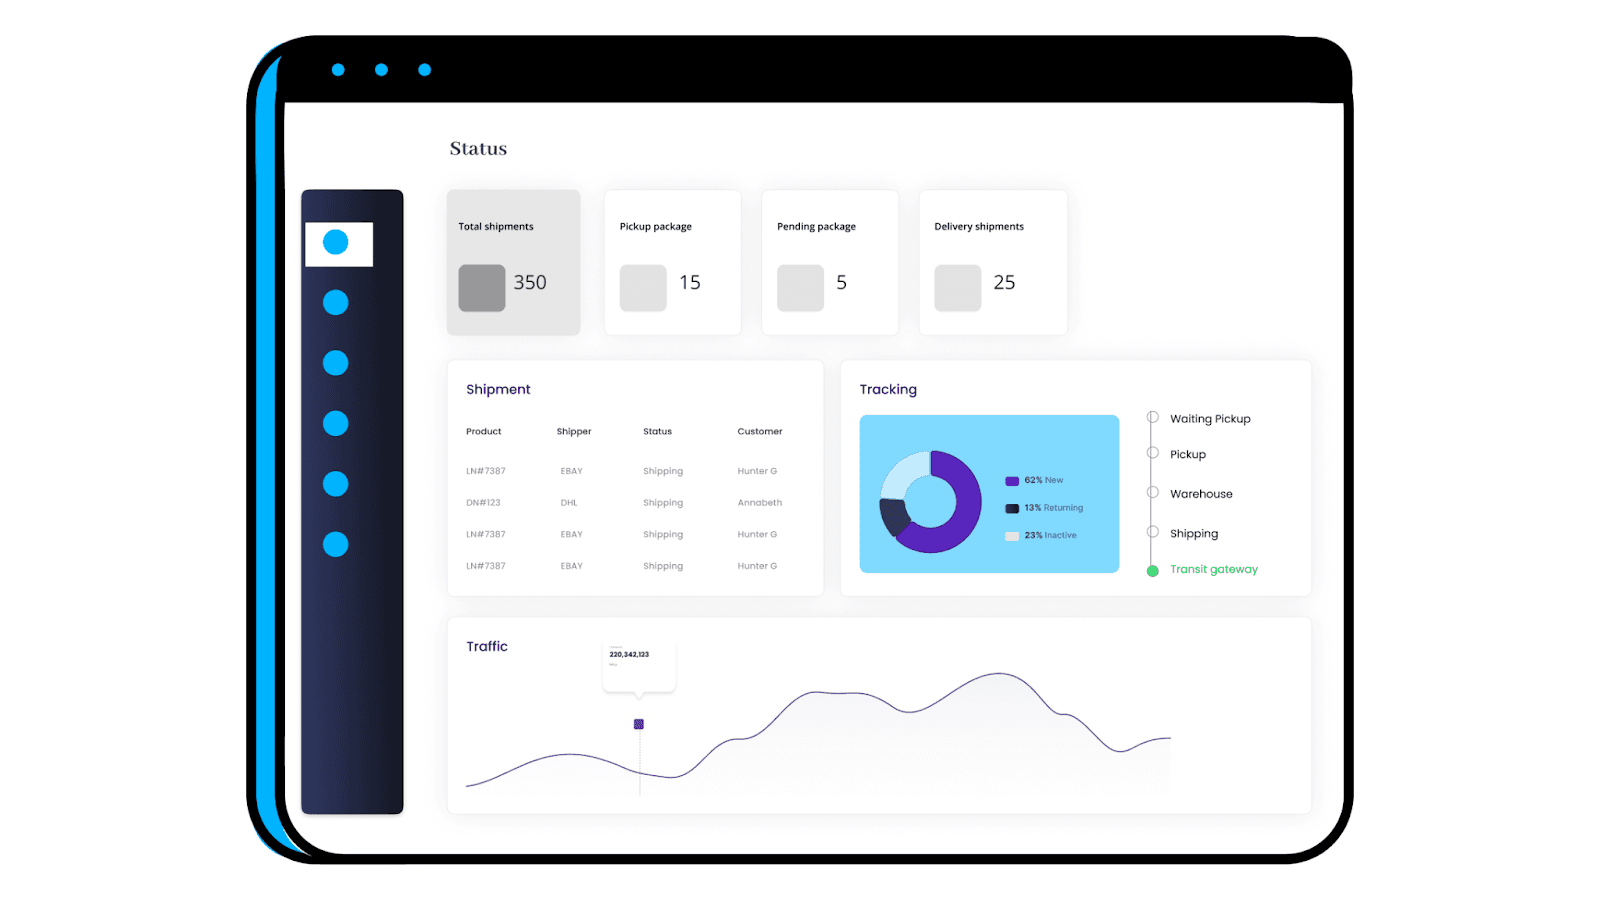
Deliverability or logistics KPI report allows you to gauge the performance of your logistics departments against set industry benchmarks. For example, it allows you to track the number of orders received and deliveries completed, average delivery time, pending delivery, and more.
Who Is It For?
This KPI report is essentially for E-commerce stores that need to focus on logistics and on-time delivery. Besides, the logistics KPI report is also popular among logistics companies like FedEx, DoorDash, and many more.
KPI That Go Into Deliverability KPI Report
#1. Number of Deliveries: Accounts for the total number of deliveries made during a given period
#2. Pending Packages: The number of packages that are packed for delivery but are not yet picked up from the warehouse
#3. Shipment to Delivery Ratio: Compares the amount of shipment and delivery made during a time frame to measure the efficiency of the logistics department
#4. Shipment Time: The time it takes for the delivery executive to pick up the package from the warehouse to the shipment yard for further movement
#5. Order Accuracy: The percentage of your orders that are fulfilled and delivered to their final destination without errors
#6. On-time Delivery Rate: The number of items that were delivered on or before time from the total number of orders received
Example #9. Marketing KPI Report
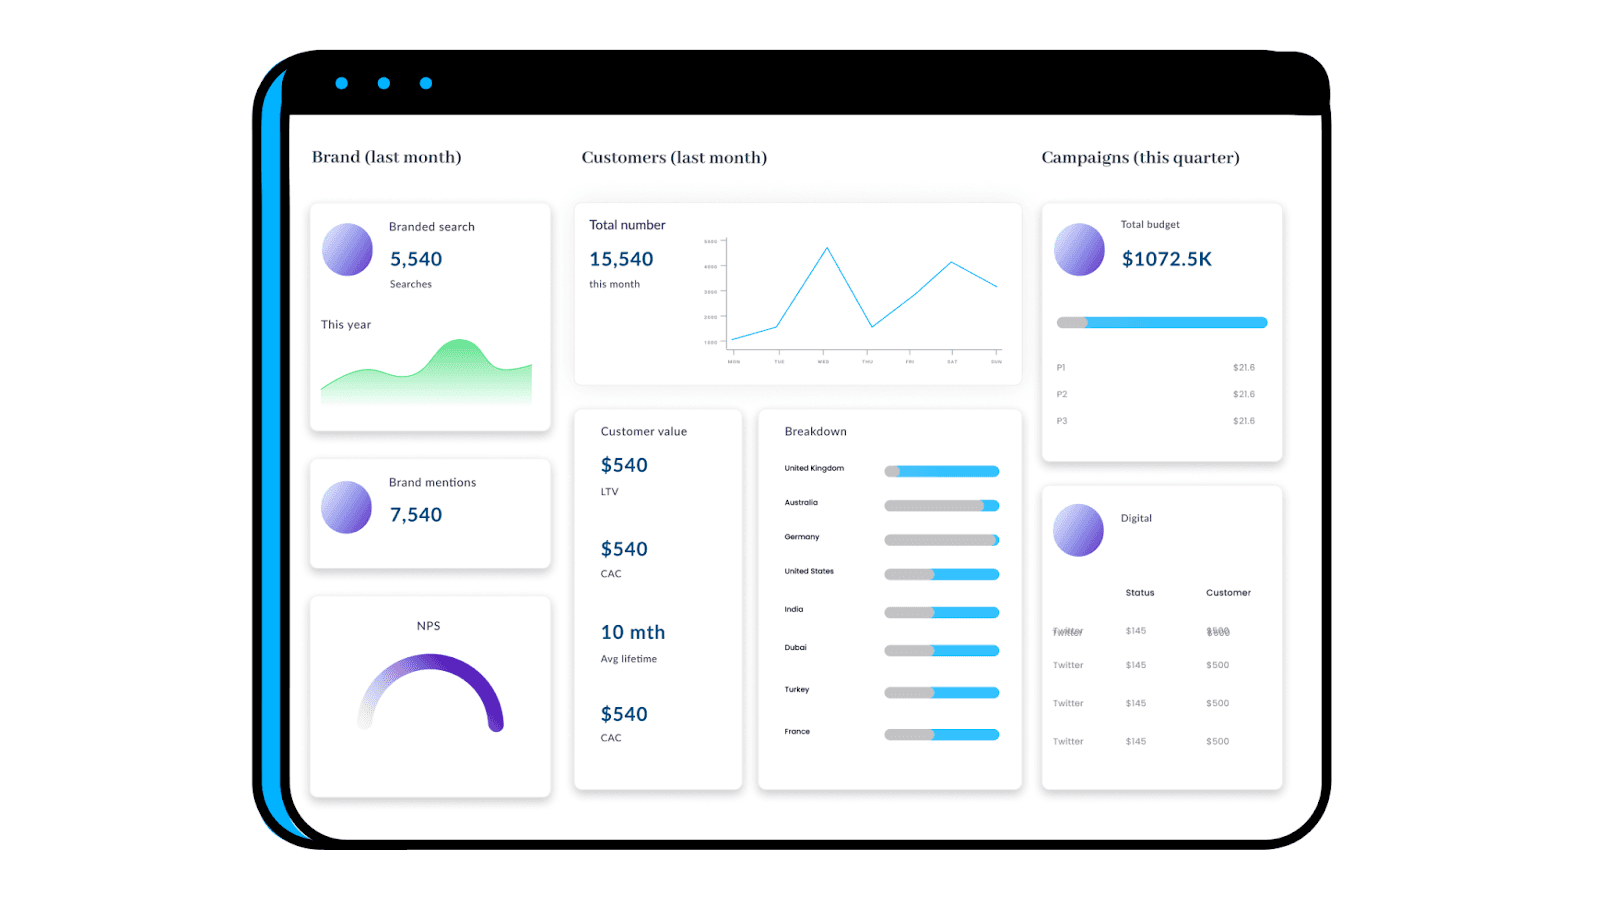
The marketing KPI report offers a high-level overview of your company's marketing spending and performance.
Who Is It For?
Marketing KPI reports are used by CMOs, marketing managers, and marketing and advertising agencies to present ROI on marketing to clients and stakeholders.
KPIs That Go Into Marketing Reports
#1. Customer Lifetime Value: Predicts the total revenue that a business can generate from a single customer over his relationship with the business
#2. Customer Acquisition Cost: Measures the total cost incurred for acquiring a new customer
#3. Brand Mentions: Comprises of the number of times your brand name was mentioned or tagged across various social media platforms
#4. Branded Search: Measures the number of time people initiate a search on the web that includes your brand name
#5. Advertising Spends: Accounts for all the marketing expenses, including display ads, PPC, CPC, sponsorships, and more
Example #10. Social Media KPI Report
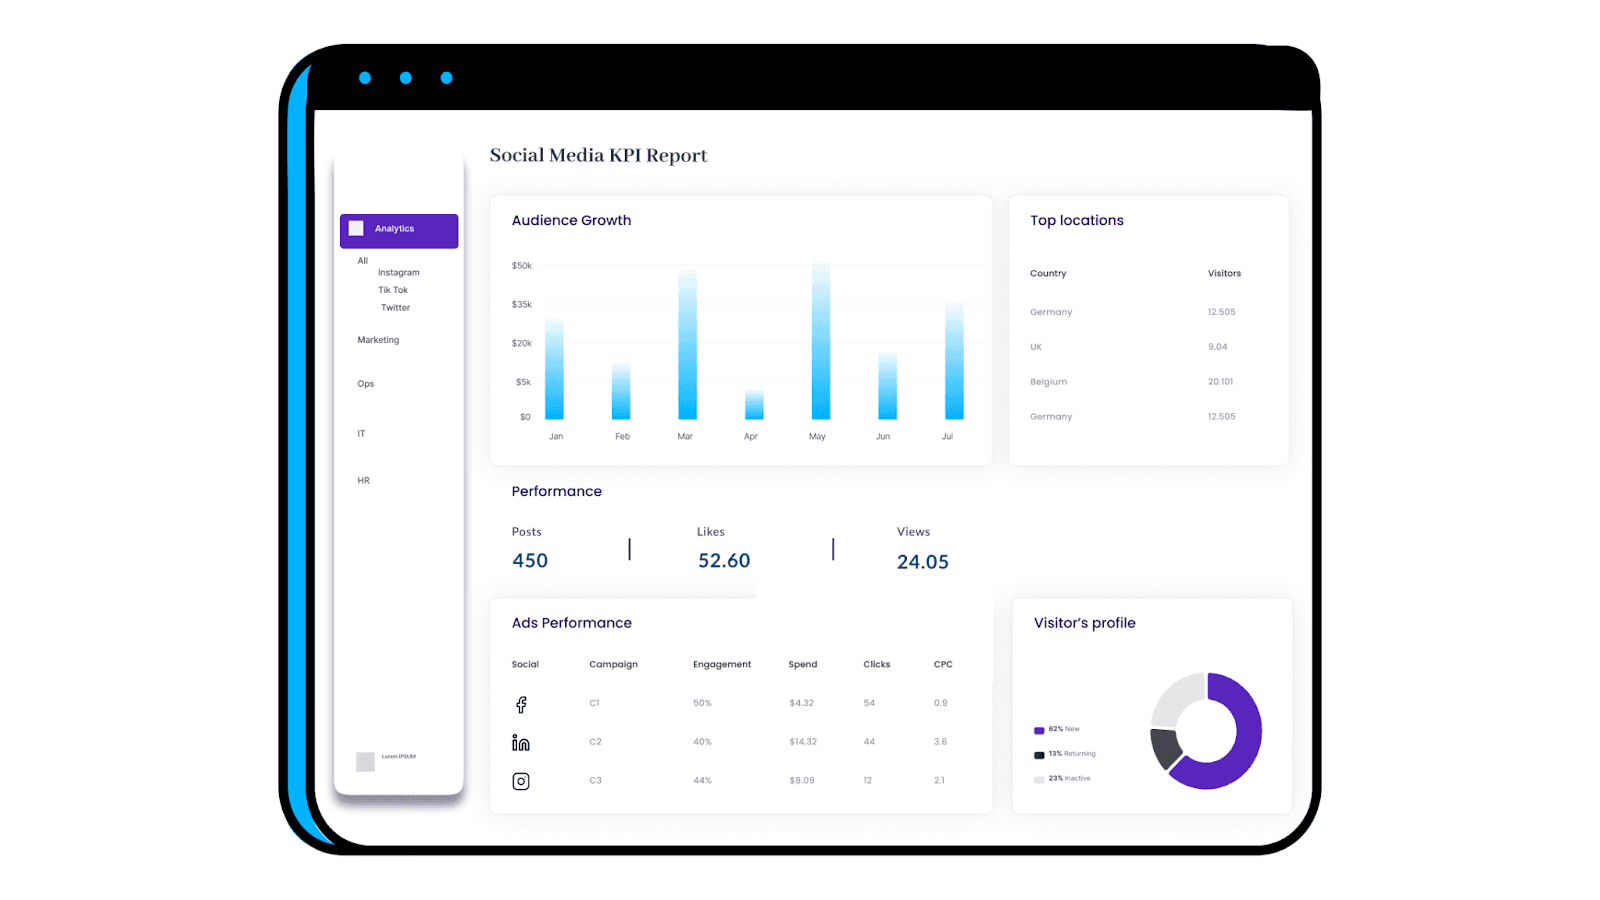
As the name suggests, this KPI report is reserved for tracking and analyzing your social media performance. It helps you identify whether your social media marketing campaigns and strategies are yielding results or not.
Who Is It For?
The social media KPI report is for brands looking to grow their online presence. It can also be used by influencers and marketing professionals to grow a brand page on social media.
KPIs That Go Into Social Media Report
#1. Total Likes: Measures the number of likes your get on your posts under a given time-frame
#2. Post Impressions: To calculate the number of unique users who viewed your post or content over social media
#3. Audience Demographics: To segment visitors profile based on gender, location, or device used
#4. Ads Performance: Measures the effectiveness of paid ad campaigns on different social media platforms
How to Create a KPI Report?
Amused by the number of examples? Feeling like creating one of these KPI reports for your organization?
We got you covered.
Datapad is a free mobile-first KPI dashboarding and reporting software that we built for both Android and iOS users.
Let us show you how you can make a stunning KPI report with our software.
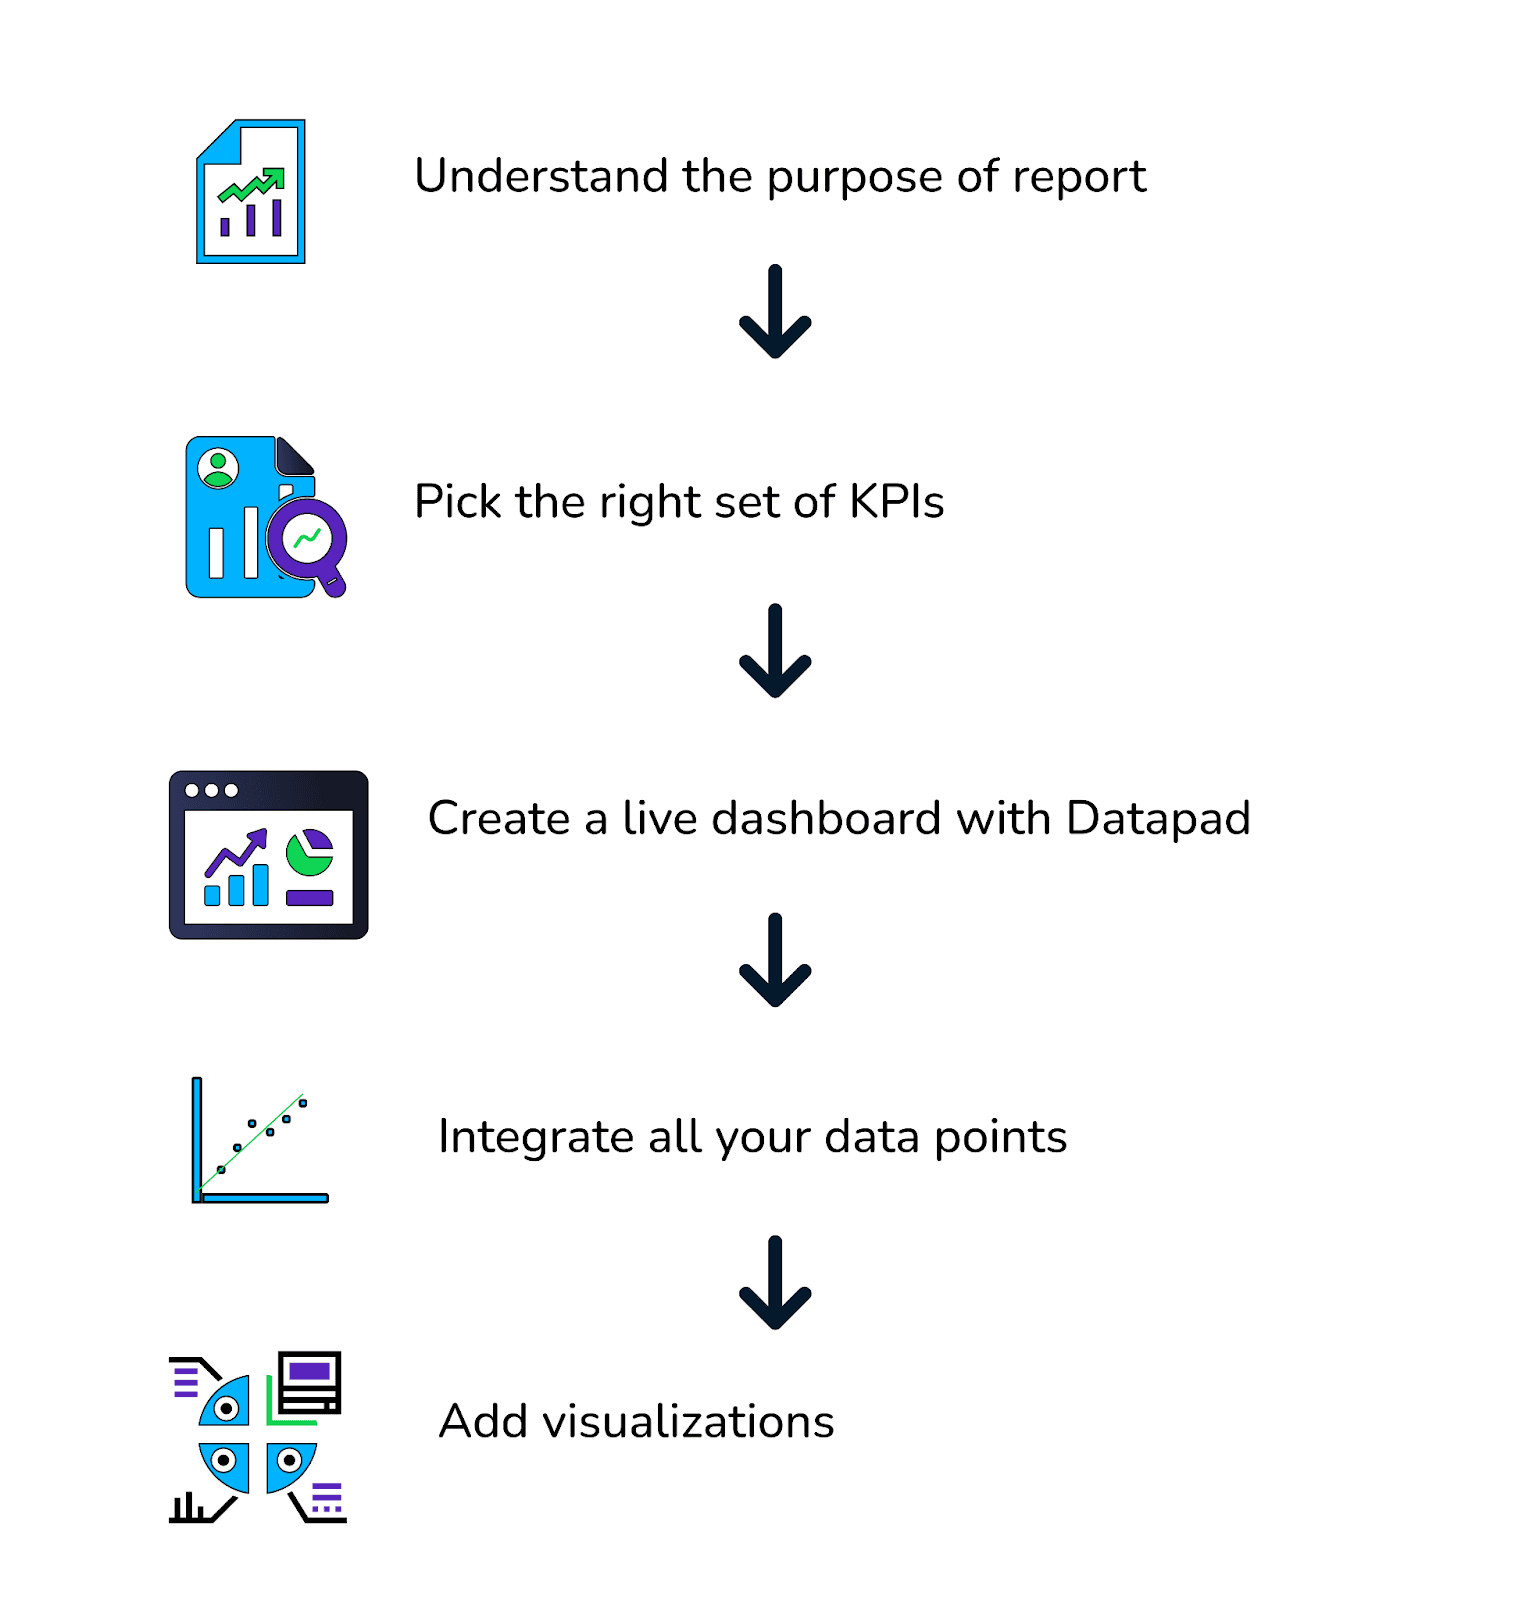
Step #1. Understand the Purpose of the Report
Before getting started with report creation, make sure you're clear on one question: What's your intention behind creating the KPI report?
Every business, regardless of size or industry, has predetermined goals and objectives. And to understand which KPIs fit best with your business model, you must have a chat with key stakeholders and decision-makers to discuss your business aims, strategic goals, and objectives.
Whatever it is, ensure that your report comprises three things:
-
A long-term goal
-
Measurable results
-
Achievable Milestones
Doing this will lay down the foundation of your KPI report. In addition, you'll better understand where to aim your efforts and what metrics or KPIs can help you measure success toward your goals.
Step #2. Pick the Right Set of KPIs
Once you've set your goals right, it's time to choose the KPIs that will gauge your performance.
Fortunately, there's a treasure trove of KPIs pertaining to your business needs. Whether it's for finance, marketing, customer service, or employee satisfaction – you can measure everything relevant to your business.
It's up to you what KPIs you find helpful in measuring business success. However, ensure that your chosen KPIs align with your long-term business goals.
Step #3. Create a Live Dashboard Report With Datapad
After you have your KPIs ready, it's time to create your first KPI report.
To get started, download our free KPI reporting tool on your mobile device (available for Android and iOS users).
Or, simply scan this QR code👇🏻to download our app.

Once you're in the app, signup with your email address, mostly it takes a few seconds to confirm your email (necessary to prevent bots from creating reports).
While we check your email ID's authenticity, you'll be prompted to create a workspace on the Datapad app.
For those unaware, a workspace is an area where you can perform all your activities, build reports, and collaborate with your team.
You just need to enter a name to your workspace, let's say," Max’s KPI Report."
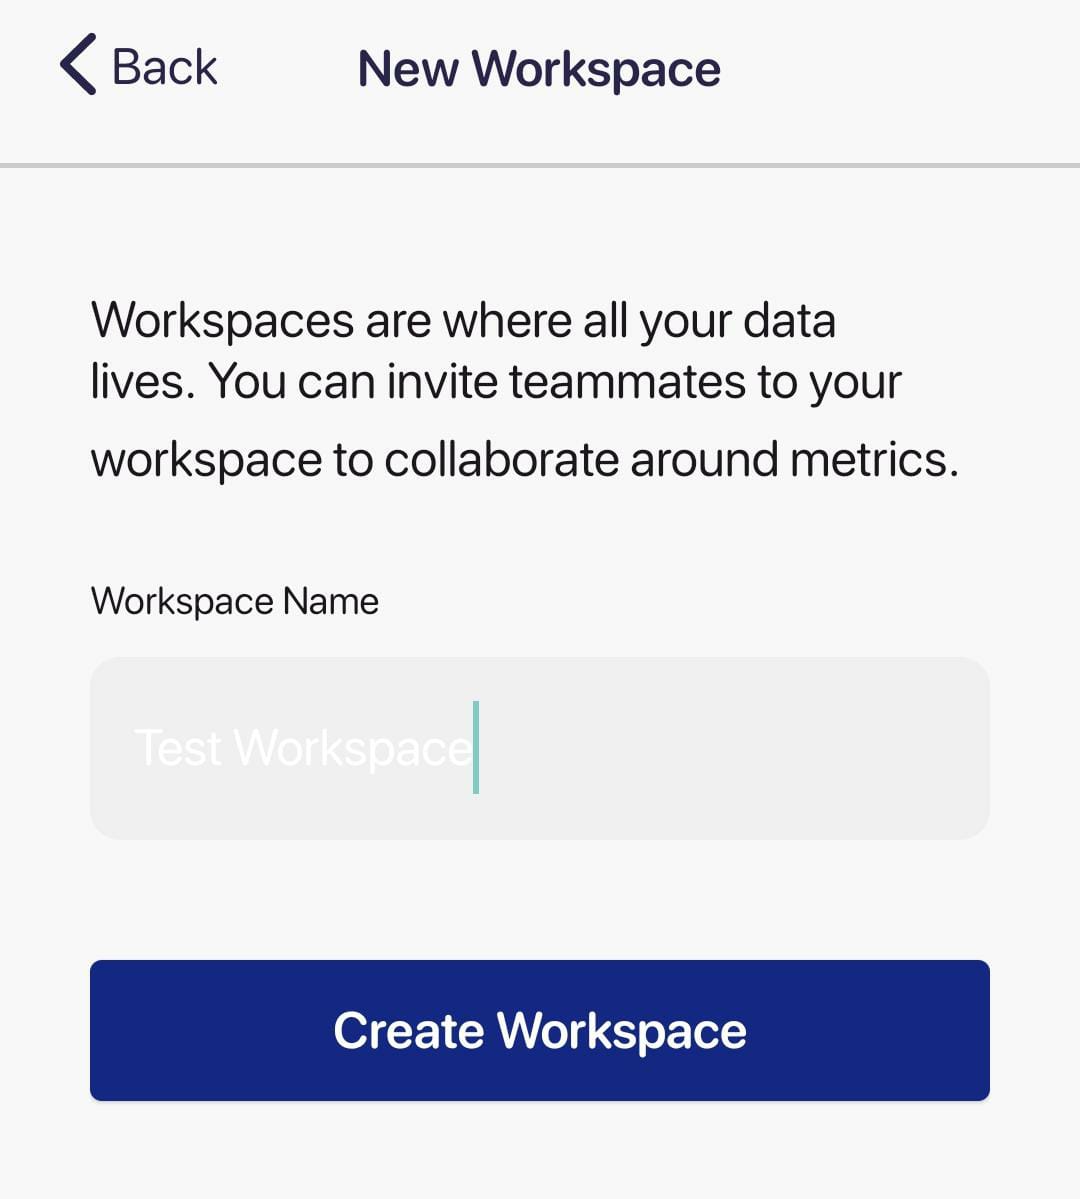
Then, click on Create a dashboard.

Here, you'll be asked to add a Title, description, and emoji (😇). Furnish the details and click on 'Create.'

Step #4. Integrate All Your Data Points
Now that your dashboard is ready, you need to integrate it with the required data sources to inflow data into the dashboard.
Fortunately, with Datapad, you can import data both ways: Manually and Automatically.
To add KPIs manually, tap on 'Enter Manually.' Then, add a value, set comparative standards, and choose the type of graph you want your KPI to have - A bar graph, Pie chart, Line diagram, or a simple table.

The other way to import data is via our one-click integrations to Google Analytics, Shopify, Facebook Ads, and more. To do so,
-
Press the '+' sign to create a metric
-
Click on 'Use a data source'
-
Choose from a library of datapoints
Step #5. Add Visualizations
Now you have enough data on your report ready to be visualized. Choose from our gallery of data visualization elements, such as bar graphs, pie charts, tables, and more, to transform your data into beautiful easy-to-understand visuals.
Furthermore, use our drag-and-drop editor to try out multiple visual elements on a single metric. Once you are satisfied with the visuals, perform further customizations such as changing texts, formatting fonts, colors, and more to make your report soothing to the eyes.
And that's it! Your first-ever KPI report is ready to be reviewed by stakeholders and decision-makers.
However, there are a few things that you must avoid when setting up your KPI reports.
5 Things to Avoid When Setting Up Your KPI Reports
-
❌ Don't over complicate your goals: Keeping it simple is the best way to achieve extraordinary things. As said earlier, decide on your goals and stick to them. Avoid adding new goals or improvising the set goals just to sound ambitious
-
❌ Don't add too much to your reports: It's easy to get overwhelmed by the number of data sources available. But you can leave out some KPIs that you feel are irrelevant. The best idea is to focus on a small number of KPIs that align with your business objectives.
-
❌Don't choose a tool with a higher-learning curve: If you're using a reporting tool, make sure it's easy to use by you and your team. Some features like drag-and-drop customizations, no-code KPI reporting, and more allow anyone to track and monitor KPIs easily.
-
❌ Don't leave your reports unchanged with time: Since the market is highly dynamic, you can't just create and forget about the KPI report. You must iterate or tweak your reporting KPIs or business strategies on a regular basis for accurate results and impactful decision-making.
-
❌Don't do it alone: And lastly, don't try being a one-man army. The proudy it sounds, the lamer it is. Since KPI reports play a significant role in making strategies and decisions, they should always be made in a collaborative environment.
Creating KPI reports isn’t a tough job. All you need to do is download Datapad, bring your team onboard, and create KPI dashboards that serve as reports to all the decision-makers in your company.