
Did you know that about 28.1 million websites currently use Google Analytics to track all important metrics related to their website? That’s a significant number.
If you’re a business owner or marketer looking to get an edge on the competition, then tracking the best Google Analytics KPIs is a must.
With the right KPIs, you can gain great insights into how your website is performing, where your viewers are coming from, and how to improve your online presence.
In this article, you’ll discover the top 12 KPIs Google Analytics KPIs you must track to stay on top of your competition.
So let’s get going!

What Are Google Analytics KPIs?
Key Performance Indicators (KPIs) in Google Analytics are quantifiable measurements used to collect, analyze, and optimize user behavior on a website.
They are the metrics used to measure the performance of your website or app. These metrics can help you gain insights into how people are interacting with your website, where they are coming from, and how to improve your online presence.
By tracking the right KPIs, you can better understand how to optimize your website and maximize conversions.
Let's dive deeper into how Google Analytics KPIs can help you increase revenue and skyrocket your website's performance. 🚀
What Are the Benefits of Tracking Google Analytics KPIs?
#1. Understanding Website And Online Marketing Performance
Tell us - How would you measure success in the digital space? 🤔
You certainly need some indicators that can vouch for your website's performance.
Google Analytics KPIs are a set of those leading and lagging indicators that help you understand your overall website performance.
From why someone visited your website to which device they used and what actions they took after visiting your website – you have dedicated metrics for everything in Google analytics.
Specific metrics such as new vs. unique users, conversion rate, retention rate, and many such KPIs deliver in-depth insights to gauge your marketing efforts over time.
#2. Identifying Opportunities for Improvement In Your Website
FACT: Everything that can be measured can be improved.
The benefits of tracking Google Analytics KPIs are not limited to measuring performance. These metrics help you get into the neck of the woods to identify opportunities for improvement.
For example, you can look at the conversion rate of different landing pages and identify underperforming pages.
Likewise, certain metrics such as website loading time, number of sessions, and engagement rate give you a better understanding of why and where your website is losing potential customers.
Let's take an example of an eCommerce store using Google Analytics KPIs.
The average cart abandonment rate (people who add products to their cart but don’t do the checkout process) is close to 69.99%. Which means, a significant portion of store visitors add products to their cart but exist without buying them.
Using Google Analytics, you can constantly measure your card abandonment rate and work on strategies such as exit offers and eye-catching deals to persuade customers into buying from you.
#3. Measuring the Effectiveness of Marketing Campaigns
The effectiveness of marketing campaigns is derived from the percentage of users who actually take action after seeing or hearing about your product.
Think about it: You’ve successfully launched a marketing campaign, say for a webinar, and want users to click on the link and register from a dedicated landing page on your website.
In this case, Google Analytics KPIs will help you measure:
-
Total number of impressions on the post
-
Total number of website visitors (top channels)
-
People who spent time on the landing page (average session duration)
-
People who clicked on the registration link (click-through-rate)
And it's not limited to all these.
Using Google Analytics KPIs, you can see how one campaign performs better than another on the website, and now you can optimize your other campaigns to match the better-performing one, or simply double down on the campaign that gives you the best results.
When you can make direct data comparisons between your ad campaigns, no matter the source, you will create a better online ad strategy, prioritizing winning campaigns and platforms.
From CTA clicks to form submissions and downloads to signing up for a newsletter – any form of engagement from the user's end that occurs as a result of an ongoing marketing campaign can be easily tracked and measured under the Google Analytics KPI dashboard.
#4. Providing Data-Driven Insights
Google Analytics KPIs eliminate the guesswork from the process of measuring and analyzing user behavior.
It provides actionable data-driven insights regarding your website and online marketing performance.
Insights like what percentage of visitors convert into actual leads, channels bringing in the most traffic, most viewed pages, and much more.
Now that you know a great deal about Google Analytics KPIs and the benefits of tracking them, it’s time to list down the most important website KPIs to track for business owners.
What Are the 12 Best Google Analytics KPIs to Track?
#1. Organic Traffic
Organic traffic accounts for the number of website visitors that land on your website from unpaid sources such as search engine result pages (SERPs).
Besides being affordable, good organic traffic (that comes with phenomenal SEO) also helps improve the DA of any website on a search engine.
How to Track Organic Traffic?
To track organic traffic on GA4, go to Reports > Acquisition > User or Traffic Acquisition.
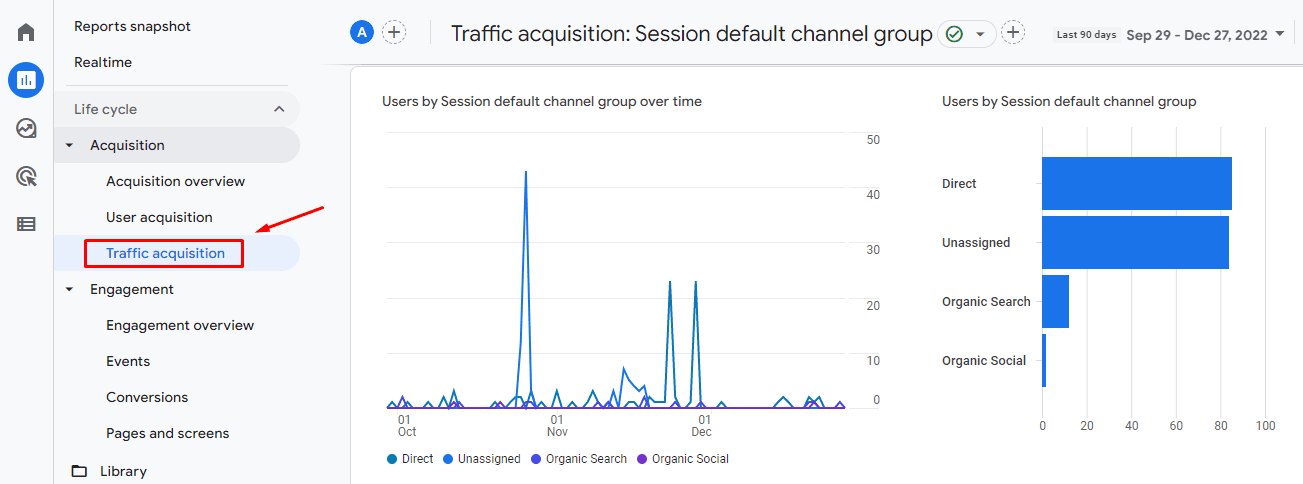
Here, you can find an 'overtime' chart depicting traffic from various sources. To exclusively view organic traffic, click on the Organic Search icon below the chart to highlight the line.
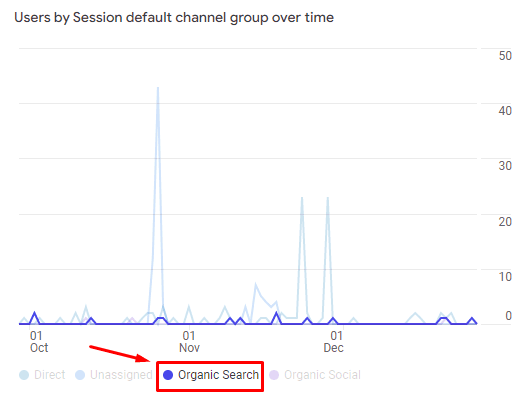
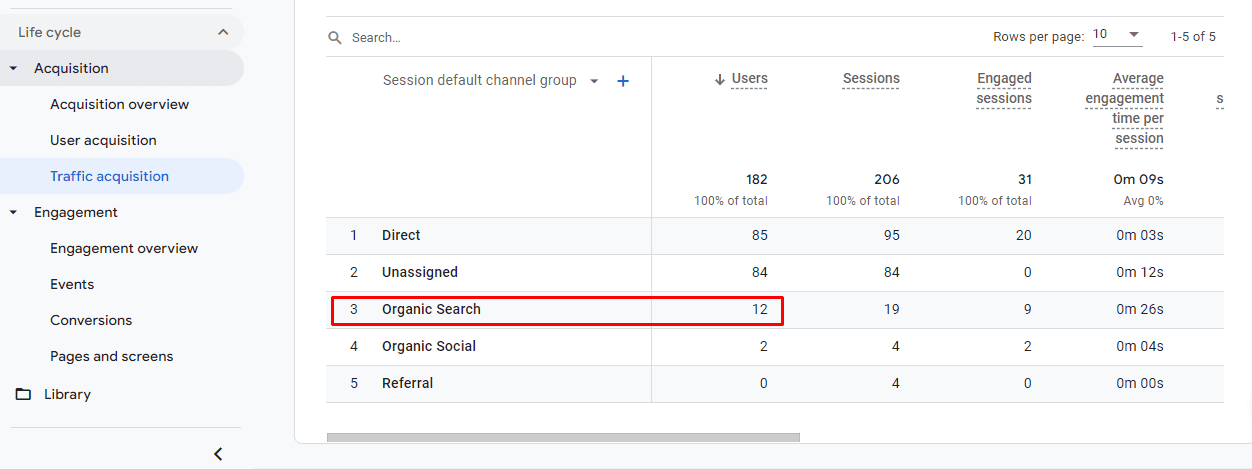
Furthermore, scroll down to the bottom to get a more comprehensive view of your organic traffic.👇🏻
#2. New vs. Returning Users
New users are those users who have visited your website for the first time, as per Google's tracking snippet.
Returning users, on the other hand, are users who have visited your website or app in the past but found it interesting enough to visit again.
So the question is, how does Google differentiate between new and returning users?
When someone views your website, Google's tracking snippet searches for a tracking cookie on the user's device:
-
If the cookie is not found on the device, Google creates one and marks the user as a 'new' user
-
If the cookie is available on the device, Google considers this a 'returning' user and starts a new session
How to Track New vs. Returning Users?
You can access new vs. returning users' insights via audience overview in universal analytics.
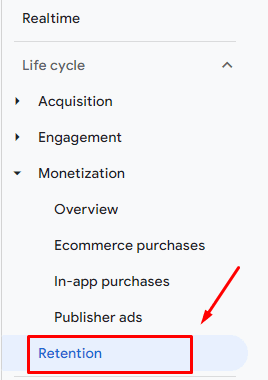
However, in GA4, the measurement process is a little different. To view new vs. returning visitors, click on Reports > Retention in the left side bar.
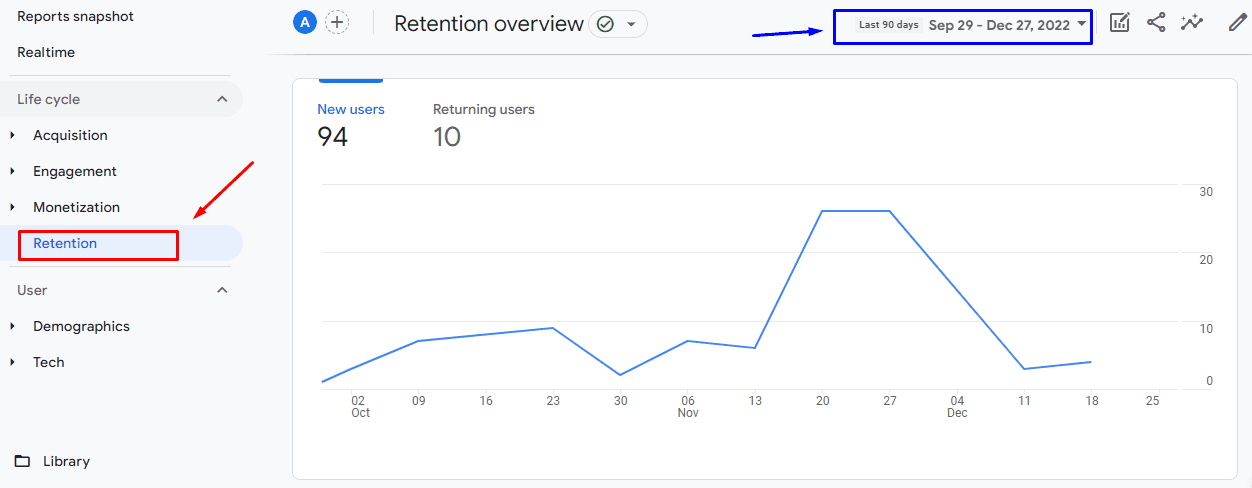
You can also gauge new vs. returning users for a specific time period from the blue highlighted area at the top.
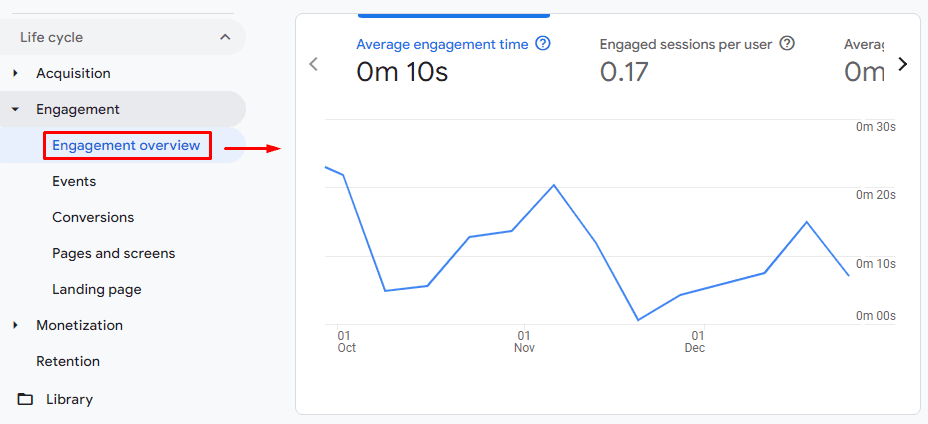
#3. Average Engagement Time Per User
Average engagement time per user measures the time duration that your web page was in focus on a user's screen. This can help you understand when users actively use your website vs. just have the page open in a tab but not displayed.
An excellent average engagement time on a website per user is anywhere between 0:27-1:30.
How to Track Average Engagement Time?
To track the average engagement time per user, click on Life Cycle in the left menu bar of GA4. Then click on, Engagements > Engagement Overview.
#4. Engagement Rate
The engagement rate measures the percentage of engaged sessions from the total number of sessions on your website.
In GA4, engagement rate essentially replaces bounce rate. Do you know why?
For instance, if a visitor landed on your page, downloaded a book, and then existed, your website would consider it a bounce. However, we can see the user is highly engaged with your website.
And that's why most companies, including Google, don’t focus much on low or high bounce rate metrics for measuring users' interests.
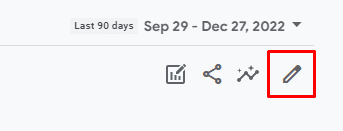
However, you can still add bounce rate in your dashboard by customizing your report view from the customize icon in the top right corner.
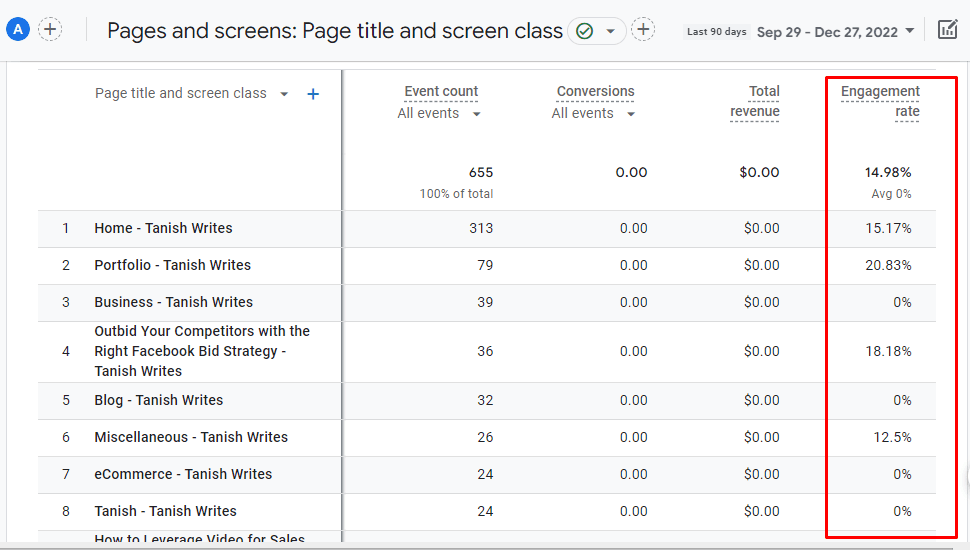
How to Track Engagement Rate?
Go to Reports > Engagement > Pages and Screens.
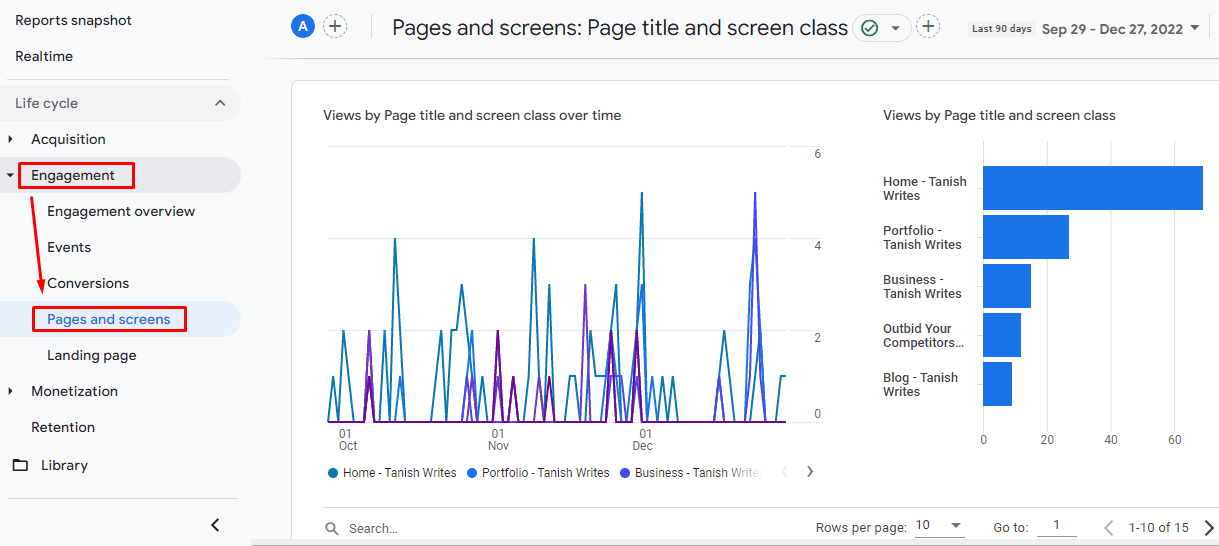
In some cases, it's possible that engagement rate is not selected as a default metric, and hence it's nowhere in your dashboard. But no worries!
You can add Engagement Rate as a metric through the dashboard customizer. Click on the Pencil Icon to access the customizer.
Once into the customizer, click on Metrics > Add Metrics.
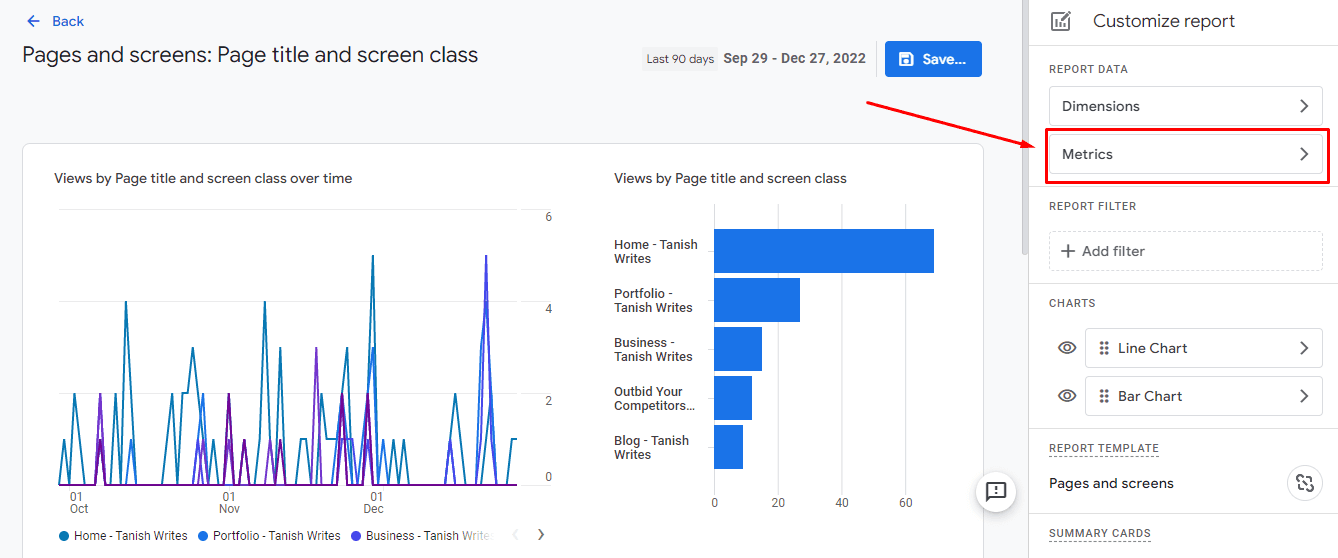
Choose Engagement Rate as a metric and click on Save.
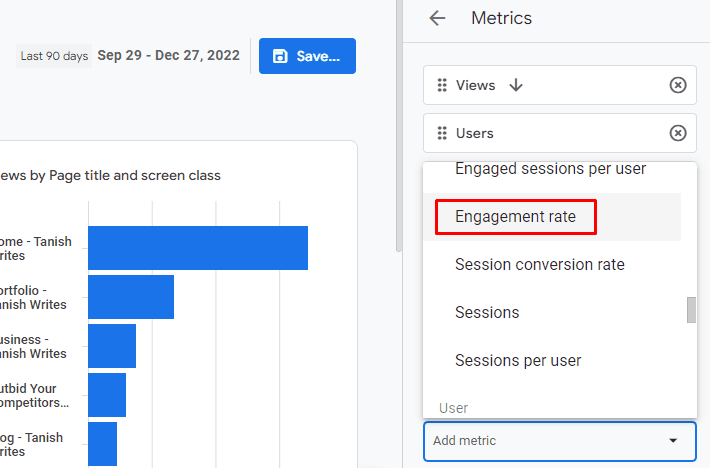
And there you go! 😄
#5. User Retention Rate
The user retention rate measures the percentage of users returning to your website or app over a given time frame. This metric is a crucial indicator of how well your retention strategies are working in retaining users over time.
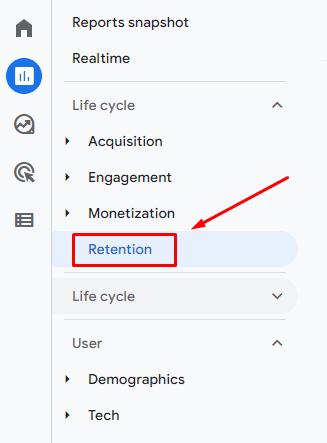
How To Track User Retention Rate?
To track user retention rate, click on Reports > Retention in the left menu bar.
Firstly you'll see a graph representing new vs. repeat users, but we’ve already measured that. To view your retention rates explicitly, scroll down to User Retention by Cohort Graph.
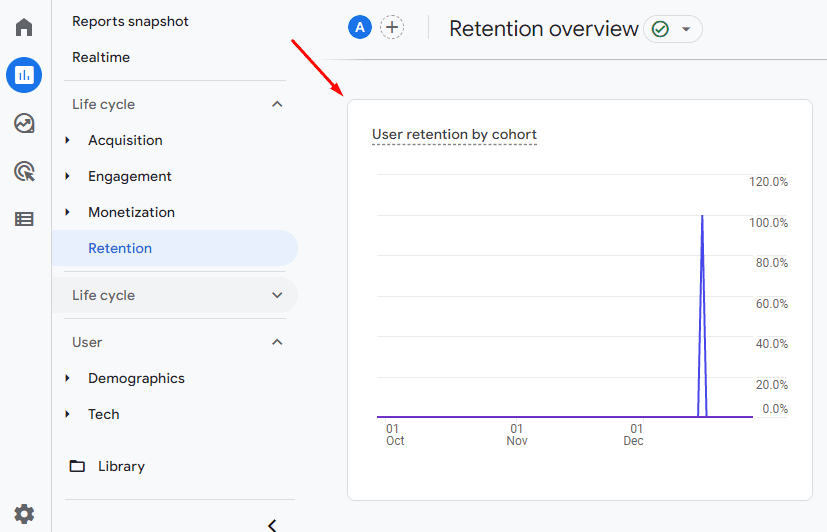
Furthermore, you'll see an exclusive User Retention Graph. This chart shows the percentage of recurring users in their first 42 days.
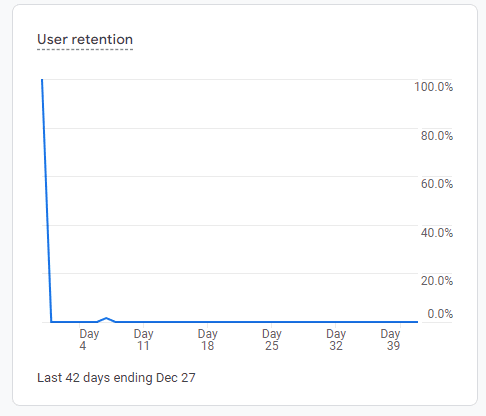
The chart starts with 100% user retention and slowly decreases from the first day as users drop off.
#6. Top Acquisition Channels
Top Acquisition channels are GA metrics that allow you to measure overall website traffic generated from individual channels or sources and identify the best-performing channels.
The KPI helps you answer questions like:
-
Where are new users coming from?
-
Which campaigns drive the most users to my website?
-
Are certain channels more effective at driving traffic to my website than others?
Thereby helping you divert your surplus resources and budget on the winning horse.
How to Track Top Acquisition Channels?
Go to Reports > Acquisition > Traffic Acquisition.
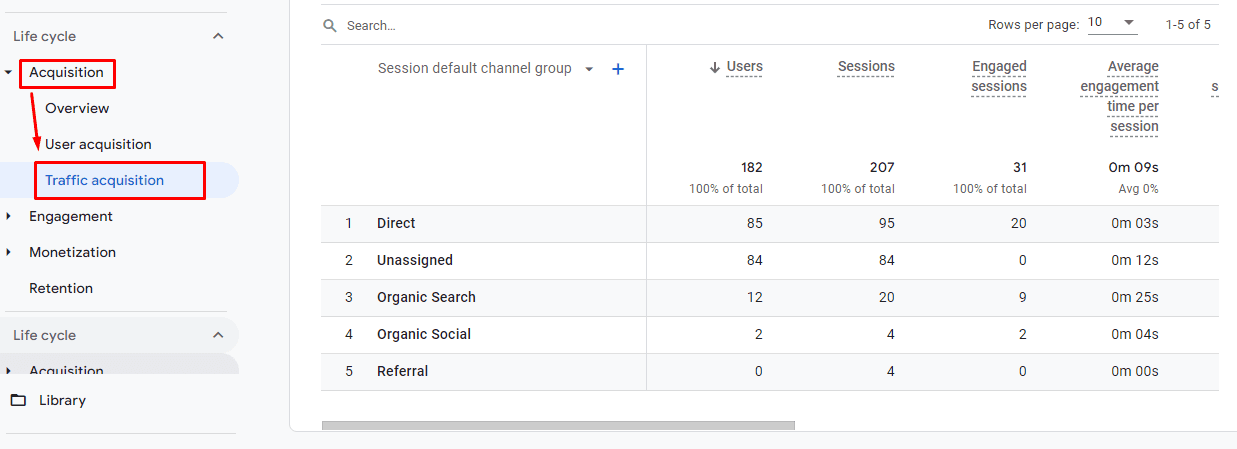
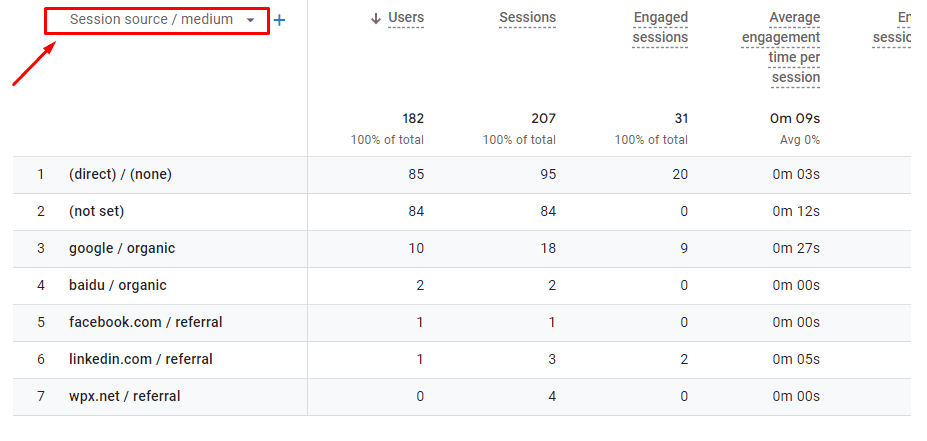
Google Analytics, by default, shows traffic by channel group such as direct, organic, or referral. However, if you want to dive deeper into the sources/medium of traffic, you can change the default filter "Session default channel group" to "Session source/medium."
#7. User Stickiness Ratio
The user stickiness ratio is a comparative metric that allows you to compare engagement rates by active users at a narrow time frame with their engagement over a broader time frame.
Basically, it's calculated based on how frequently users access your website. The higher the ratio, the more effective your retention strategies are functioning.
However, this metric was not available by default in Universal Analytics. This is a new metric that GA4 released along with the new platform, and we're big fans.
How to Track User Stickiness?
To track user stickiness go to - Reports > Engagement > Engagement Overview
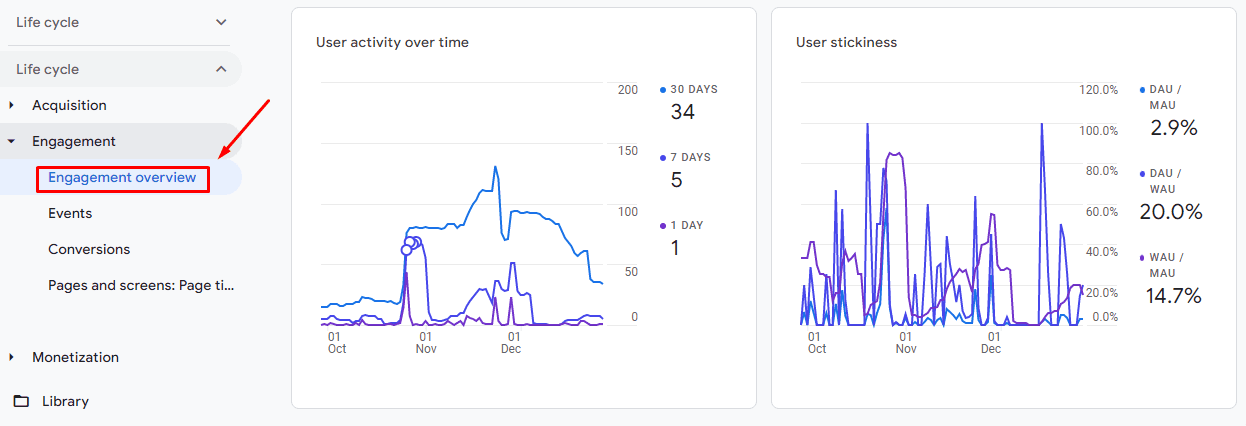
As you can see, there are two reports: User activity over time and User Stickiness. Let's stick to user stickiness. 😉
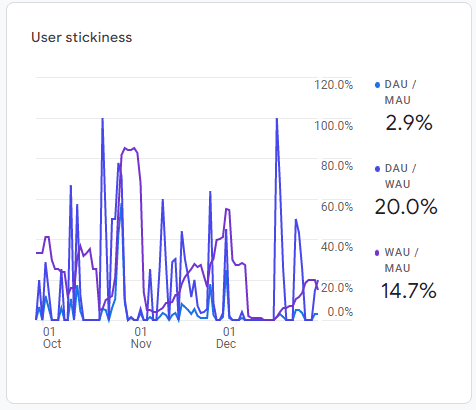
Here, Google Analytics measures the Daily Active Users (DAU), Weekly Active Users (WAU), and Monthly Active Users (MAU) and automatically presents a graph consisting these three ratios:
-
Daily Active Users (DAU) / Weekly Active Users (WAU)
-
Daily Active Users (DAU) / Monthly Active Users (MAU)
-
Weekly Active Users (WAU) / Monthly Active Users (MAU)
#8. E-commerce Purchase KPIs
Google Analytics provides a fantastic set of metrics for eCommerce owners to track the most-selling products on their website.
It has the following metrics:
-
Item Views: Total number of times the item details were viewed
-
Add-to-Cart Rate: Number of times users added a product to their shopping cart
-
Cart-to-View Rate: Number of users who added product(s) to their cart divided by the number of users who viewed the same product(s)
-
Purchase-to-View Rate: Number of users who purchased product(s) divided by the number of users who viewed the same product(s)
-
Item Revenue: Total revenue generated from selling items, excluding tax and shipping
How to Track E-commerce Purchase KPIs?
Step 1: Go to 'Reports'
Step 2: Click on 'Monetisation’
Step 3: Go to the 'Ecommerce Purchases' section
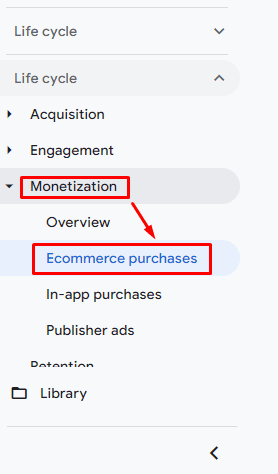
A report will appear on your screen, showing all the metrics mentioned above.
#9. Average Revenue Per User [ARPU]
The average revenue per user measures how much revenue you are generating from each active customer. ARPU can be calculated by dividing the total amount of revenue generated by the company by the total number of active users (i.e., customers).
An increasing ARPU indicates improvement in the monetization of the user base. Whereas, a decreasing ARPU suggests a deterioration in the monetization of the user base.
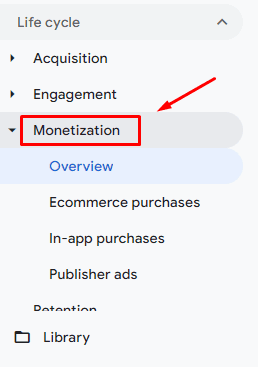
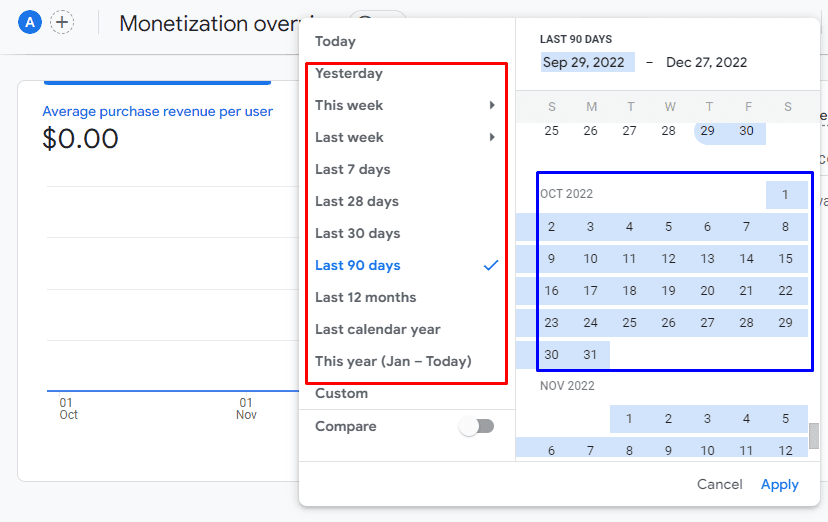
How to Track Average Revenue Per User?
Go to Reports > Monetization > Overview.
Then choose from predetermined time frames in the red highlighted box or select custom dates from the blue highlighted box.
#10. User Lifetime Value
User lifetime value measures the total revenue a business expects to generate from a user during their relationship with the company.
How to Track User Lifetime Value?
To track user lifetime value, click on Reports > Monetization > Retention.
Once you have the dashboard on the screen, scroll to the bottom to see the Lifetime Value graph. By default, the graph is set to last for 120 days.
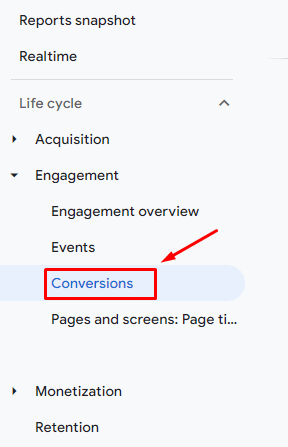
#11. Conversion Rate
This Google Analytics KPI measures the number of times your website visitors triggered a conversion event. It can be anything ranging from signing up to a newsletter to clicking on a Google ad.
How to Track Conversion Rate In GA4?
Go to Reports > Engagements > Conversions.
Google Analytics 4 features some new conversion metrics like:
-
Conversion by event
-
Total users converted
-
Event revenue
These supporting KPIs will help you measure your conversion rates in a better and more organized manner.
#12. Entrances and Exists
Wouldn't it be great if you knew where your customer first landed on your website? It can definitely help you enhance your user experience and make those landing pages more relevant and engaging.
The metrics indicate the number of times the first or last event in a session occurred. However, you don’t need to go that deep because Google Analytics collects data about entrances and exits automatically.
How to Track Entrances and Exits?
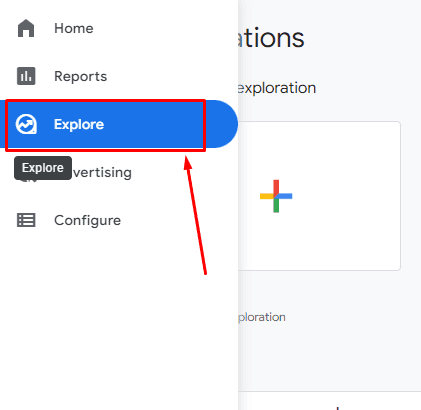
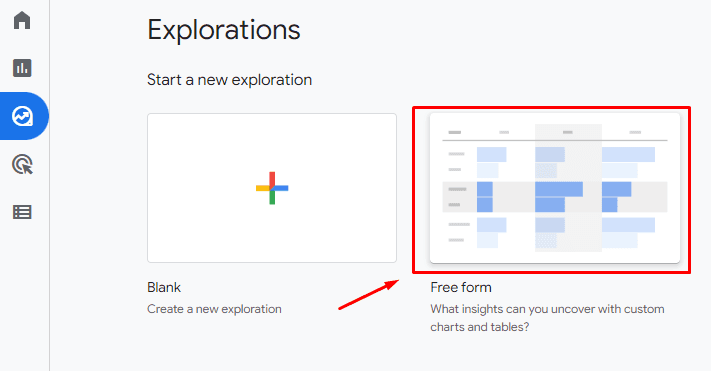
As for Google Analytics 4, these metrics are only available in Exploration. Right below Reports, here👇🏻
In exploration, click on Free Form.
Two tabs appear on the left bar:Variables and Tab Setting.
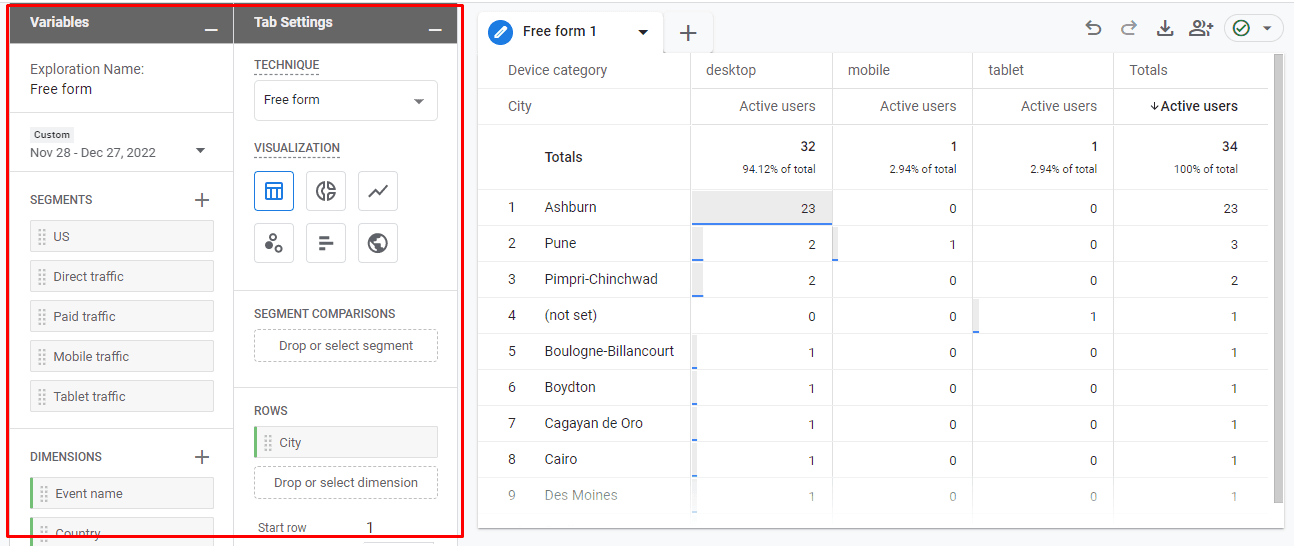
Scroll to the bottom of the Variable tab, and click on the '+' sign right above the metric section.
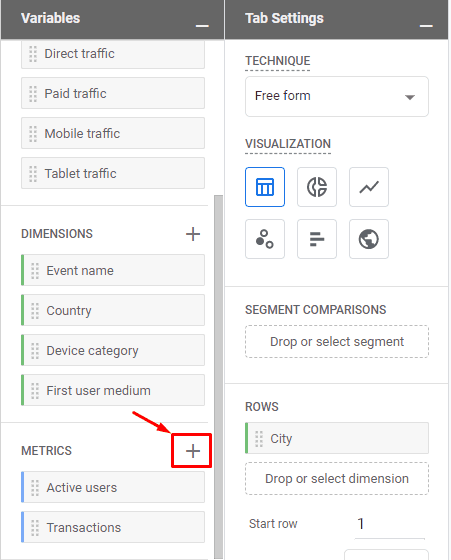
A library of pre-built metrics opens up.
From here:Step 1: Click on Page/Screen Dropdown
Step 2: Select Entrances and Exits
Step 3: Click on the Import button in the top right corner
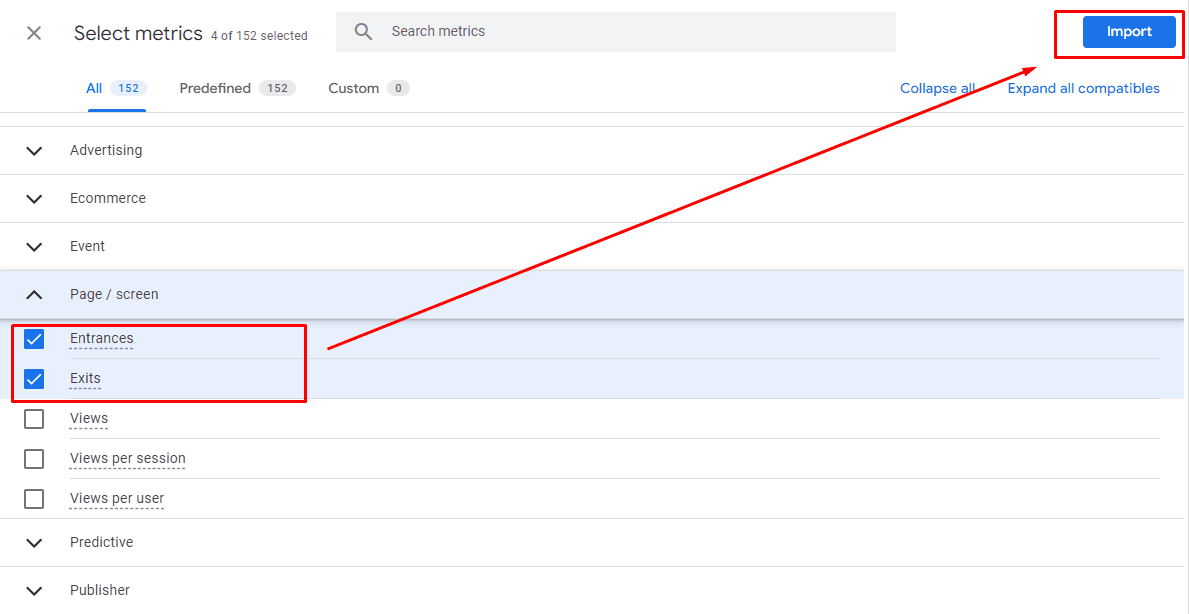
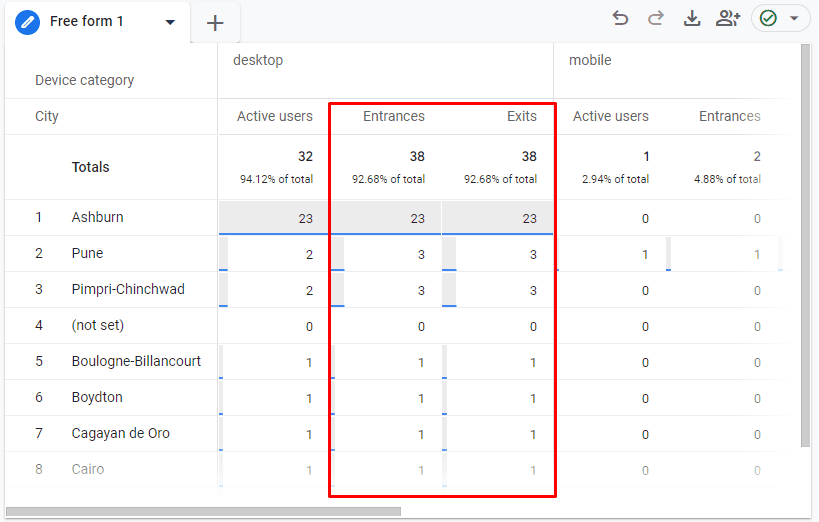
The selected metrics will be added to your list of metrics.

Now, double-click on both metrics simultaneously to add them to your report. And voila!
How to Track Google Analytics Metrics with Datapad?
Datapad is the industry's leading mobile-first dashboarding platform that allows you to track, monitor, and analyze KPIs on the go.
It's a popular tool among marketers to gauge their website and digital marketing performance on their mobile phones.
Besides, our tool's one-click integration with Google Analytics helps marketers track Google Analytics KPIs via stunning dashboards and easy-to-understand visuals.
Let's look at how you can build a dashboard and track Google Analytics KPIs in Datapad.
Step 1: Create a Dashboard
To get started, download the Datapad app from the web (available for Android and iOS devices). Or, simply scan this QR code.

Once into the app, you'll be asked to sign up with your email address.
Note: Please enter a valid email address, and we'll instantly send a verification mail to the address provided.
Meanwhile, you'll be asked to give a name to your workspace.
A workplace in Datapad is like your personal office space, where all our KPIs and dashboards are secured. You can invite teammates to your workspace to collaborate and analyze metrics (more on this later).

Give a name for your workspace and press the '+' sign in the top right corner to create your first dashboard.
Fill in the details, like the dashboard name (Google Analytics Dashboard), description, and an emoji (if any), to personalize your experience on Datapad. And then click on 'Create' in the top right corner. That's it! Your first dashboard is created.
Here's the whole dashboard creation process in action:

Pro Tip: Before moving to step 2, ensure you set the right business goals for your company.
Step 2: Import Data to Your Dashboard
An empty dashboard won't be enough, so let's flood it with some meaningful data.
Datapad offers two methods to import data: Automatically and Manually.
You can easily import data from our one-click integrations to Google Analytics 4. Here's how automatic data import works:

Or, you can import data manually in Datapad. Here’s how to do it:

Step 3: Bring Your Marketing and Analytics Team On Board
Now that you have a data-focused Google Analytics KPI dashboard in action, it's time to onboard your team.
Datapad offers a seamless team onboarding process. You can click on the '+' sign at the bottom > Manage users > Enter the email addresses of your teammates > Press send.

Step 4: Customize on the Go
Personalizing the look and feel of your dashboard is a hassle-free process with Datapad. Our drag-and-drop customizer helps you easily customize every section of your dashboard.
You can also perform granular customizations such as formatting fonts, colors, and chart types.
What's more, we offer a string of features such as:
-
Commenting under KPIs to talk to your teammates
-
Set automated alerts for messages and changes in KPI trends
-
Assign tasks and monitor the activities of team members
-
Enable role-based management; control who can view/access/edit data
Want to try Datapad? Scan the QR code below, sign up, and get your website rankings up in no time.