An average gen z millennial spends 2 to 3 hours daily on social networks. And that’s probably during the weekdays; it increases significantly during the weekends.
The post-pandemic buzz of social media has convinced marketers and companies to reshape their traditional marketing strategies with the virtual space.
Regardless of the industry and size, companies are pumping in $$$ to social media analytics and marketing. And to help the cause, social media KPIs come into play.
In this article, we’ll decode the meaning, importance, and 13 most popular metrics to measure for various popular platforms like Facebook, Instagram, LinkedIn, and Twitter.
Whenever you’re ready! 🏁
What Are KPIs in Social Media?
In the context of social media, key performance indicators are used to measure the success rate of social media campaigns across multiple social media platforms like Facebook, Instagram, LinkedIn, Twitter, and more that you can recall.
Social media KPIs track every activity that goes along your company's social profiles, from number of likes to shares and conversion to engagement rates - you get a number for every social media marketing strategy you implement on social media channels.
But you might already be tracking many other KPIs for the website, finances, operations, and more. So, is tracking your social performance really important?
Short Answer: Yes
Long Answer: Read the next section
Why Should You Track Social Media KPIs?
Social media platforms have remarkably expanded their user base post-covid. As per Statista, over 4.26 billion people were using social media in 2021, and this is projected to grow to almost six billion in 2027.
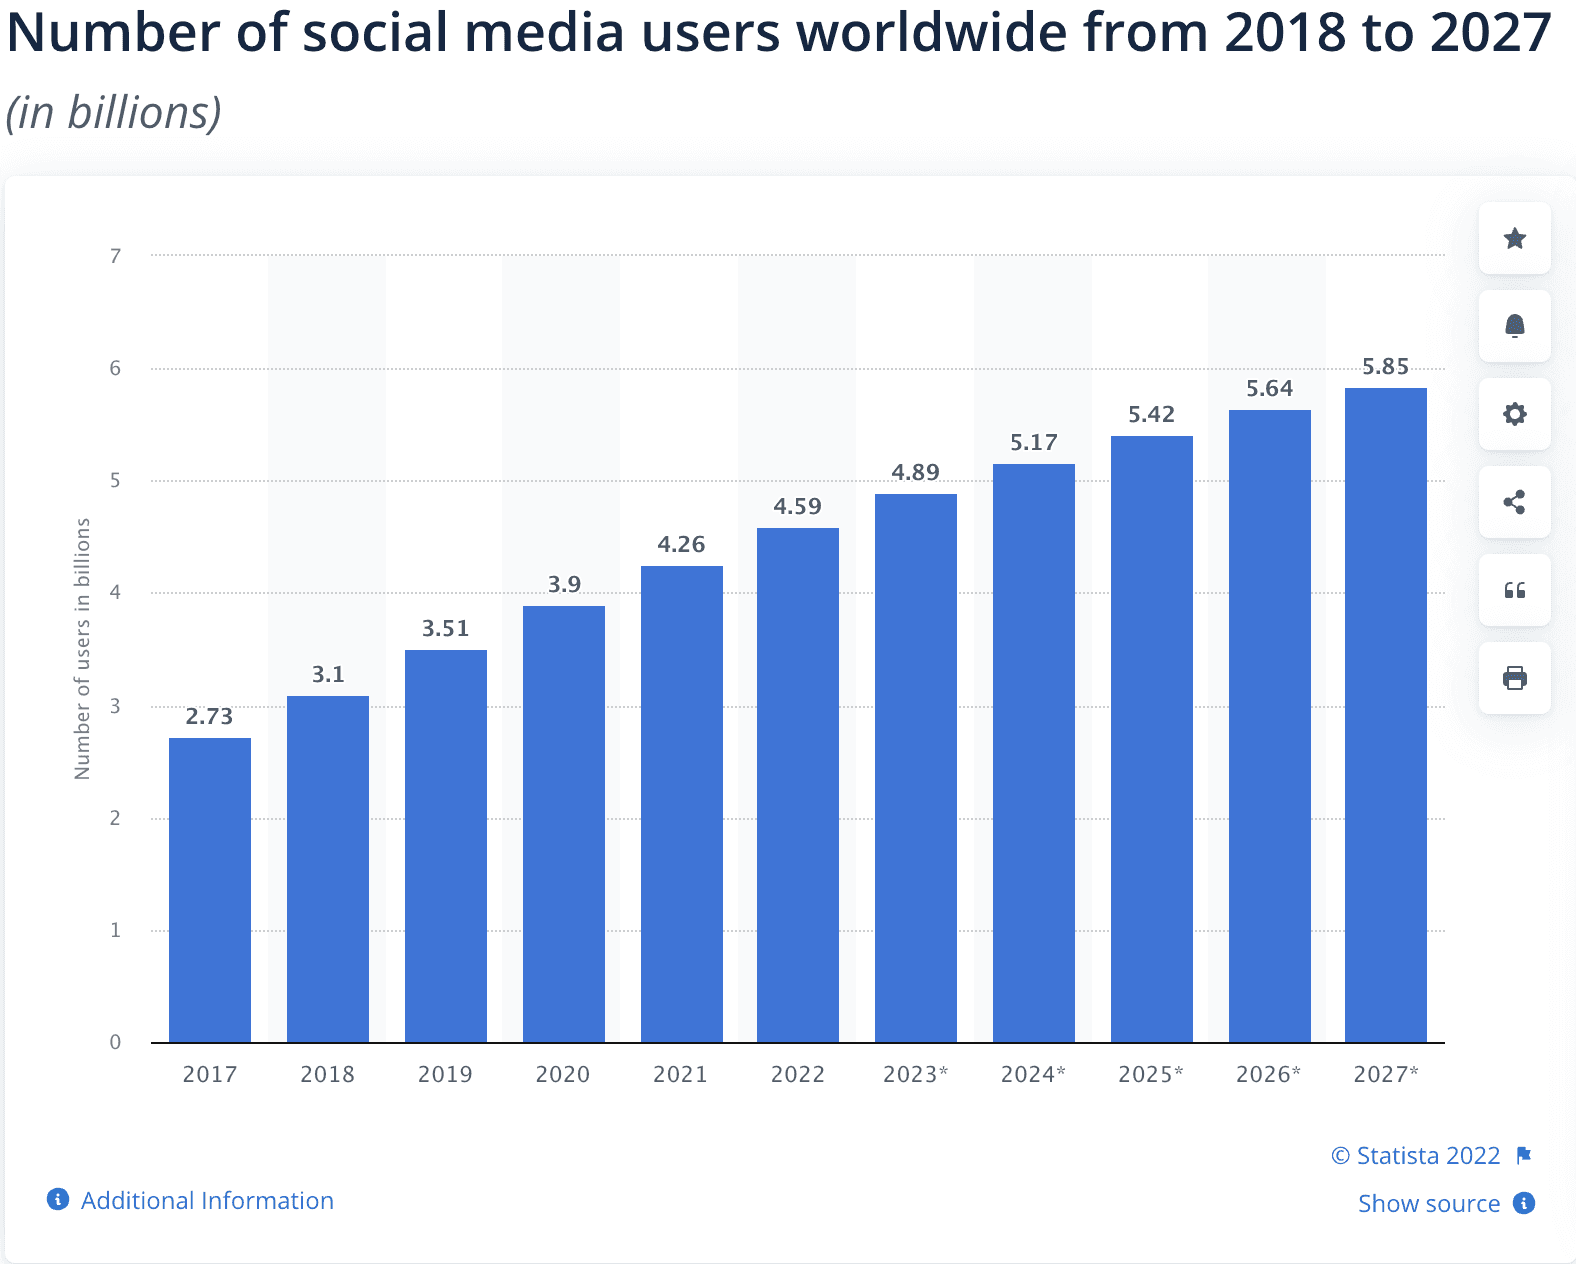
As the numbers soar, social platforms are becoming a marketing hub for companies. No wonder when you can reach four billion people with a click, why try anything else?
Marketers leverage social media for promotions, lead generation, and brand awareness. In 2020, social media ad spending stood at $132 Bn, with the US being the largest social media ad market globally.
But what after you spend billions and trillions on running ads and campaigns?
You sit quietly in a dorm room waiting for customers?
https://giphy.com/gifs/theoffice-nbc-the-office-tv-F3BeiZNq6VbDwyxzxF
Nah!
Instead, you create a free dashboard on Datapad and track dozens of metrics to get an edge over the competition (more on this later).
You can measure every aspect of your social performance by leveraging social media KPIs.
But with ROI in mind, you only need to worry about those that answer the following questions:
-
Are you reaching qualified people?
-
Are you engaging with qualified leads?
-
How many of your social media fans recommend your product?
-
How many of them actually become customers?
Now that you know why it’s important to track social media KPIs, here’s a list of 13 crucial metrics based on individual social platforms.
13 Important Social Media KPIs to Track For Facebook, Instagram, LinkedIn, Twitter
#1. Facebook
KPI #1. Average Engagement Rate
Facebook engagement rate measures the percentage of people that interacted with your post one way or another: Like, comment, share, or anything that counts as an interaction.
Why Is It Important?
Just by creating an account on Facebook, you aren't helping your business grow. It requires consistent posting and building engagement via unique content, or else your page won’t get any reach.
To avoid becoming just another boring company page, you must put up content that resonates with your target audience. A higher engagement rate indicates excellent fan-following of your company's Facebook page.
To calculate this social media KPI, you need to calculate two metrics:
-
Engagements by followers
-
Engagements by reach
Let's see how you can calculate both.
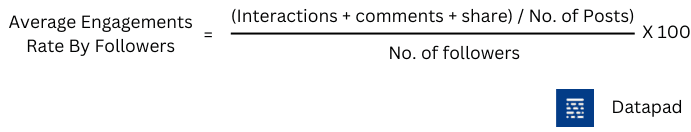
To calculate the social media engagement rate by reach, simply change the denominator value to the number of people reached.
KPI #2. Click-Through Rate
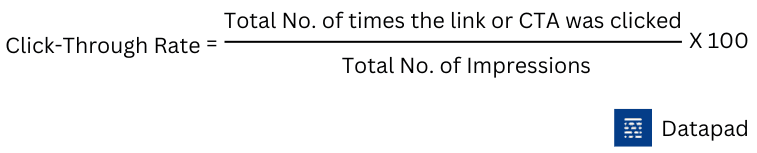
Click-through rate, or CTR, refers to the percentage of people who clicked on a CTA or link after viewing your social post or advertisement.
Why Is It Important?
As of 2022, Facebook has an impressive CTR of 3.86%, the highest among other social media platforms. Thus, when tracking KPIs for Facebook, the click-through rate is something you don't want to miss.
Besides, Facebook's CTR is four times that of Instagram. It seems the perfect reason why marketers are pumping heavy money into Facebook advertisements.
A high CTR indicates that users are interested in the advertised product or service, while a low CTR may suggest that the ad is irrelevant to them.
CTR also acts as a benchmark for the performance of your campaigns. A bump in this metric can be due to multiple factors, such as:
-
Irrelevant content in context to viewer demographic (gender, age, or interest)
-
Unattractive ad design or poorly crafted ad copy
-
Weak call-to-action button text and placement
Here's how you can measure click-through-rate:
KPI #3. Cost Per Conversion
Cost per conversion is a social media strategy metric tracked by 99% of marketers in the online advertising industry.
It measures the ratio of the number of advertisements or post views to the number of successful conversions derived from it.
Why Is It Important?
Honestly, this is the most straightforward metric to help you better understand your campaign's performance.
If your CPC is too high, it indicates a loose string in your ads. Either you might be targeting the wrong audience, or maybe your ad copy just isn't captivating enough.
Moreover, a lower conversion rate accounts for a poor ROI.
You see, if viewers are not converting into actual customers, what's the purpose of shedding $$$ on advertisements?
As per the Wordstream report, the average conversion cost across all industries is $48.96 for search ads and $75.51 for display ads. So if your CPC is around these numbers, you're running a profitable campaign.
Here's how you can figure out your CPC:
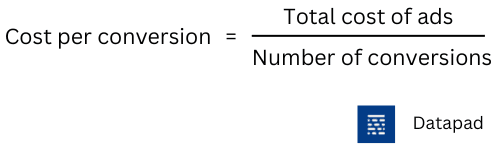
For example, if you spend $1000 on an ad campaign and you gain 40 new customers, your conversion cost will be calculated as follows:
$1000 / 40 = $25
Your cost per conversion, in this case, will be $25.
#2. Instagram
KPI #4. Amplification Rate
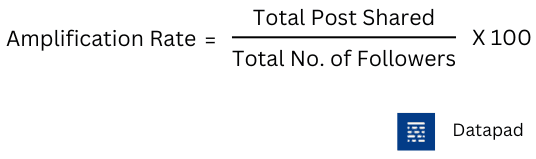
The amplification rate measures the number of social shares per post to the number of total followers. Simply put, it's the rate at which your followers take your content and share it across their network.
Why Is It Important?
Amplification, as the term suggests, allows your brand to amplify or expand its reach. This reach is not a result of campaigns or ads, but it's a reach companies get from the word-of-mouth social media marketing of your loyal customers.
Basically, the higher your amplification rate, the more willing your followers are to associate themselves with your brand. And, the more delighted they're to re-share your content in their network.
Instagram, by far, has the highest content interaction rate in the industry. Therefore, measuring this metric becomes extremely important.
Here's a simple formula to calculate the amplification rate:
KPI #5. Engagement Per Follower
Unlike the amplification rate, engagement per follower is a more contrary term. It's comprehensive in one glimpse and granular in the other.
We call this metric comprehensive because it measures engagement in all forms (likes, comments, shares). It's also granular because it measures engagement for individual followers.
Why Is It Important?
Big brands like Oreo, Nike, and Dominos have millions of followers on social platforms, and they see a lot of engagement on anything they post. You, on the other hand, aren't a big brand yet!
Here’s how you can leverage engagement per follower KPI:
You can calculate the engagement per follower to determine whether your current follower base interacts enough with your content and compare the same with top brands' engagement rates. This will likely help you forecast future growth and work towards improvements.
The formula for measuring the engagement rate per follower on Instagram is pretty straightforward:
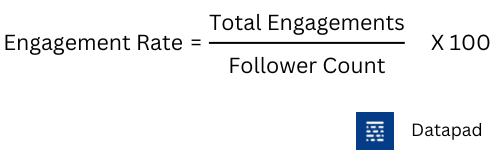
Tracking this metric over time will give you a sense of overall performance trends, though you can also calculate it for specific social media posts to get an idea of the content types that resonate with your audience.
KPI #6. Monthly Growth Rate
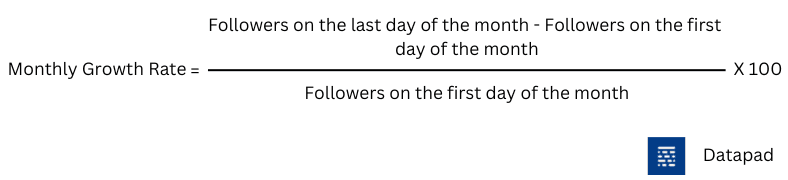
Monthly Growth Rate measures the increase in the number of followers on your social media account (Instagram) over a specific period of time. Since the metric is preferably measured every month, it's also coined as monthly growth rate.
Why Is It Important?
A business's growth can be in terms of revenue, staffing, or demographic expansion. In the social media context, however, growth is defined by the increase in the number of followers on your social profile.
The metric shows how quickly your Instagram account is gaining or losing followers. While the exact number of followers you have is not so significant, the rate at which that figure changes is an important metric to track.
If there's a steady increase in the follower count, you're highly likely to get discovered and drive engagements from new followers. And if the trajectory is nose-diving, it's the other way around.
The average Instagram account sees a follower growth of 1.69% each month. So if you're close to this number, your marketing strategies are just working fine.
Here's how you can measure your Instagram growth rate:
KPI #7. Instagram Story Metric
For those unaware, Instagram stories are 24 Hr snippets that allow you to add music, mentions, polls, questionnaires, and more to it.
This KPI is dedicated explicitly to measuring the performance of your Instagram stories, i.e., how popular and engaging they are.
Why Is It Important?
Arguably the most essential component of any Instagram marketing strategy is Instagram stories.
The disappearing nature of the photos and videos gives you even more freedom and flexibility than your feed does. And so, it's comparably a feasible way to put out content in a relatively short period.
There's no defined formula for measuring the performance of Instagram stories. However, you can get insights about the same in your Instagram professional dashboard.
There are a few good metrics to keep tabs on, such as story replies, story taps, story exits, and Impressions.
Here, a higher number of impressions indicates your story is getting good reach, while a higher number of story replies means your story is well-resonating with your audience.
There's no specific formula or benchmark for tracking Instagram story metrics, just keep an eye on the stats and ensure it's increasing or consistent.
#3. LinkedIn
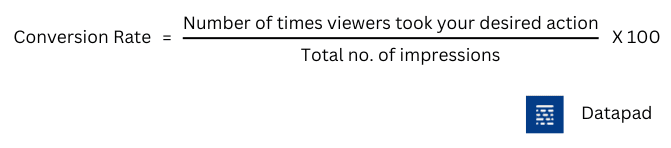
KPI #8. Conversion Rate
Conversion rate is the percentage of people who viewed or clicked your LinkedIn post. The action can be as simple as filling out a form to as complex as making a purchase or starting a free trial.
Why Is It Important?
93% of B2B marketers consider LinkedIn as the most effective social platform to win leads. Moreover, LinkedIn generates more leads than Facebook, Twitter, or Blogging.
So, tracking your conversion rate on LinkedIn is essential to identify if you're utilizing the platform's potential to the fullest.
Besides, LinkedIn doesn't have in-built conversion rate tracking. So either you can use UTMs and measure the KPI in Google Analytics, or even better, use the below-given formula.
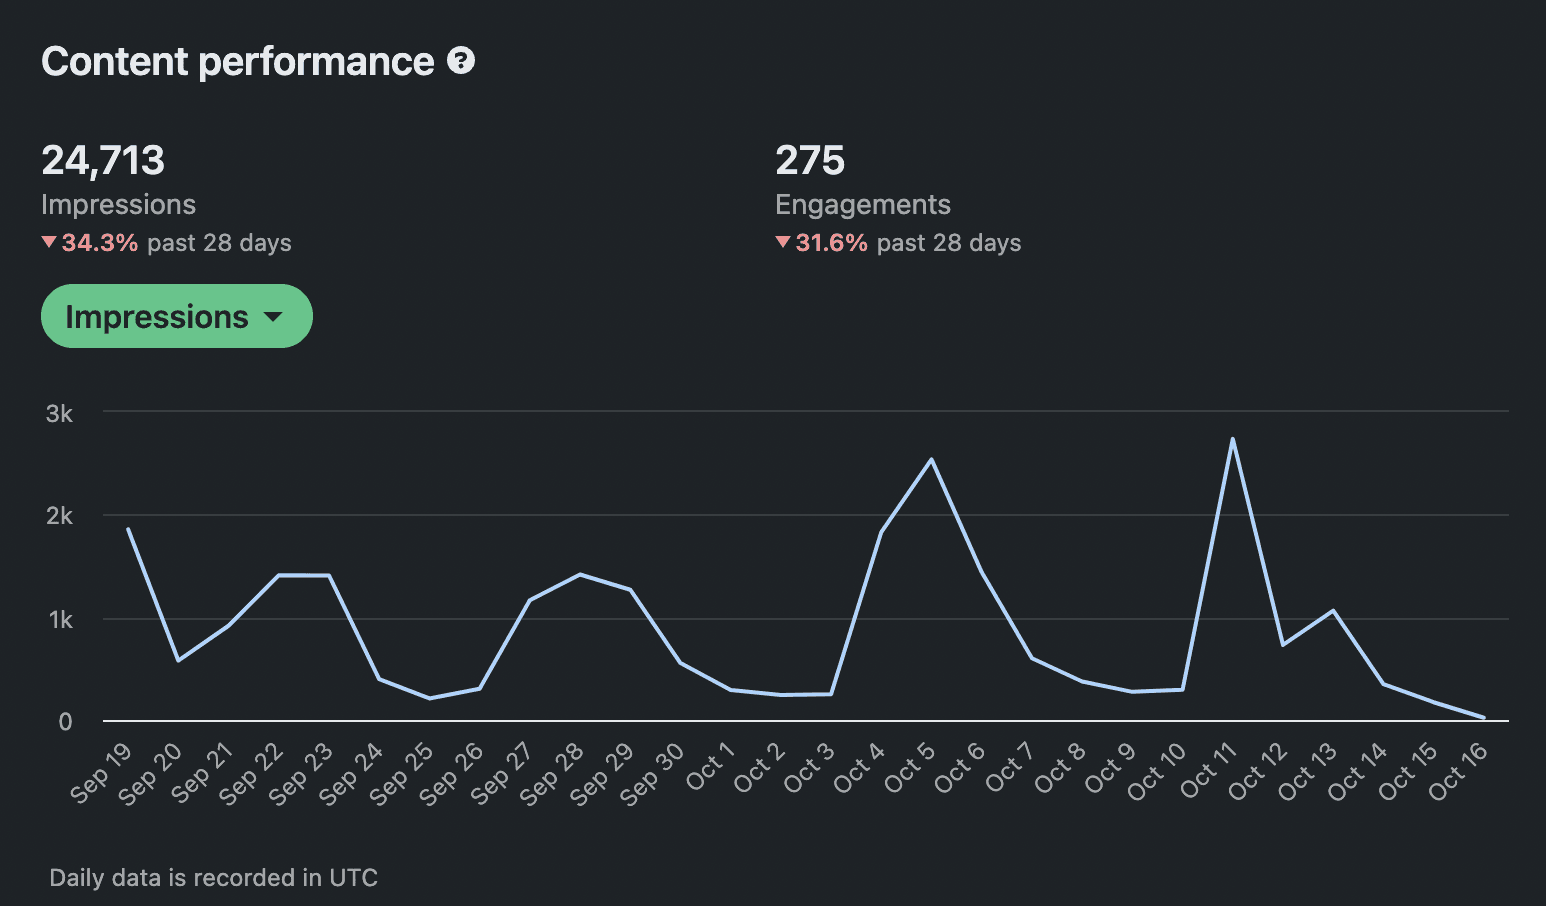
KPI #9. Total Impressions
LinkedIn impression metric measures the number of times your ad or post was displayed on a user's screen.
Why Is It Important?
The total number of impressions your page or social post gets is a prolific indicator of the exposure your content gets. Impressions speak a volume about reach.
LinkedIn counts impressions as the number of times your content "is at least 50% in view, for at least 300 milliseconds.
The insights from the metric can be further used to measure other essential metrics such as engagement rate, cost-per-thousand-impressions, conversion rate, and more.
For the most part, LinkedIn insights allow you to track impressions per post. The higher number of impressions a post gets, the more people it's visible to.
KPI #10. Reach by Post Type
Reach by post type is a granular LinkedIn metric that helps you figure out which kinds of posts are getting boosted by LinkedIn algorithms, thereby being visible to a broader audience.
Why Is It Important?
Content can be in any form: single image, text, audio, video, carousel, and more. But identifying which content types work best for your LinkedIn audience can ease your marketing efforts.
Here's our take on the type of posts that perform best on LinkedIn:
-
Firstly, text-based posts are a dear friend to the LinkedIn algorithm. These posts are 4X more effective than images on LinkedIn
-
Secondly, general updates and mini-blog posts with a link to the full article in the comment section
-
Video posts as they generate over 300 million impressions in 12 months, making them three times more engaging than articles
KPI #11. Average Amount of Links clicked
The average number of links clicked measures the number of times a link in your tweet is clicked to the total number of post impressions.
Why Is It Important?
Twitter allows up to 280 characters per post, which means you can barely put 40-50 words of content per post.
Due to this limited content approach, marketers emphasize Twitter for sharing direct links. Hence, the number of clicks on a link becomes a critical metric to track on Twitter.
Generally measured per post or day, the link clicked metric allows you to identify the topic or content that gets the maximum engagement.
To track this metric internally, open Twitter and click on "View Tweet activity". Here you are presented with your overall engagement breakdown categorized by link clicks, profile clicks, and more.
The other way is to use this simple formula:

KPI #12. Number of Retweets
The number of retweets is regarded as the soul metric for Twitter.
Just like the share button on Facebook or Instagram, retweets are a way of re-posting a tweet. You can even re-post your own tweet from the past to give it a fresh try.
Why Is It Important?
Retweets amplify your tweet visibility. It's a great way to share likable content over Twitter.
Moreover, more retweets indicate that your content resonates well with your Twitter audience. Besides, retweets are a great way to go trending on Twitter.
To measure it, you can simply count the number of retweets you get on every post and keep a written record.
KPI #13. Hashtag Performance
Hashtag performance measures the effectiveness of Twitter hashtags in providing your content with better visibility.
Why Is It Important?
Now, with ~30 words and a link, you can't expect your content to stand out from the competition. Here's when Twitter hashtags make the difference.
Ensuring that you use the most relevant, popular, and visible hashtags allows your content to be viewed by the right audience.
You can use the Twitter hashtag tracker tool to track hashtag performance and get relevant insights.
Apart from the above-mentioned KPIs, there are some more which you can track when you scale your business:
-
Bounce Rate: The number of users who have engaged with your post but haven’t taken any action and scrolled down further their newsfeed
-
Share of Voice: The visibility you have in comparison to your competitors
-
Cost-Per-Click: The amount you spend on getting a lead if you run ads on social media
How To Track Social Media KPIs In Datapad?
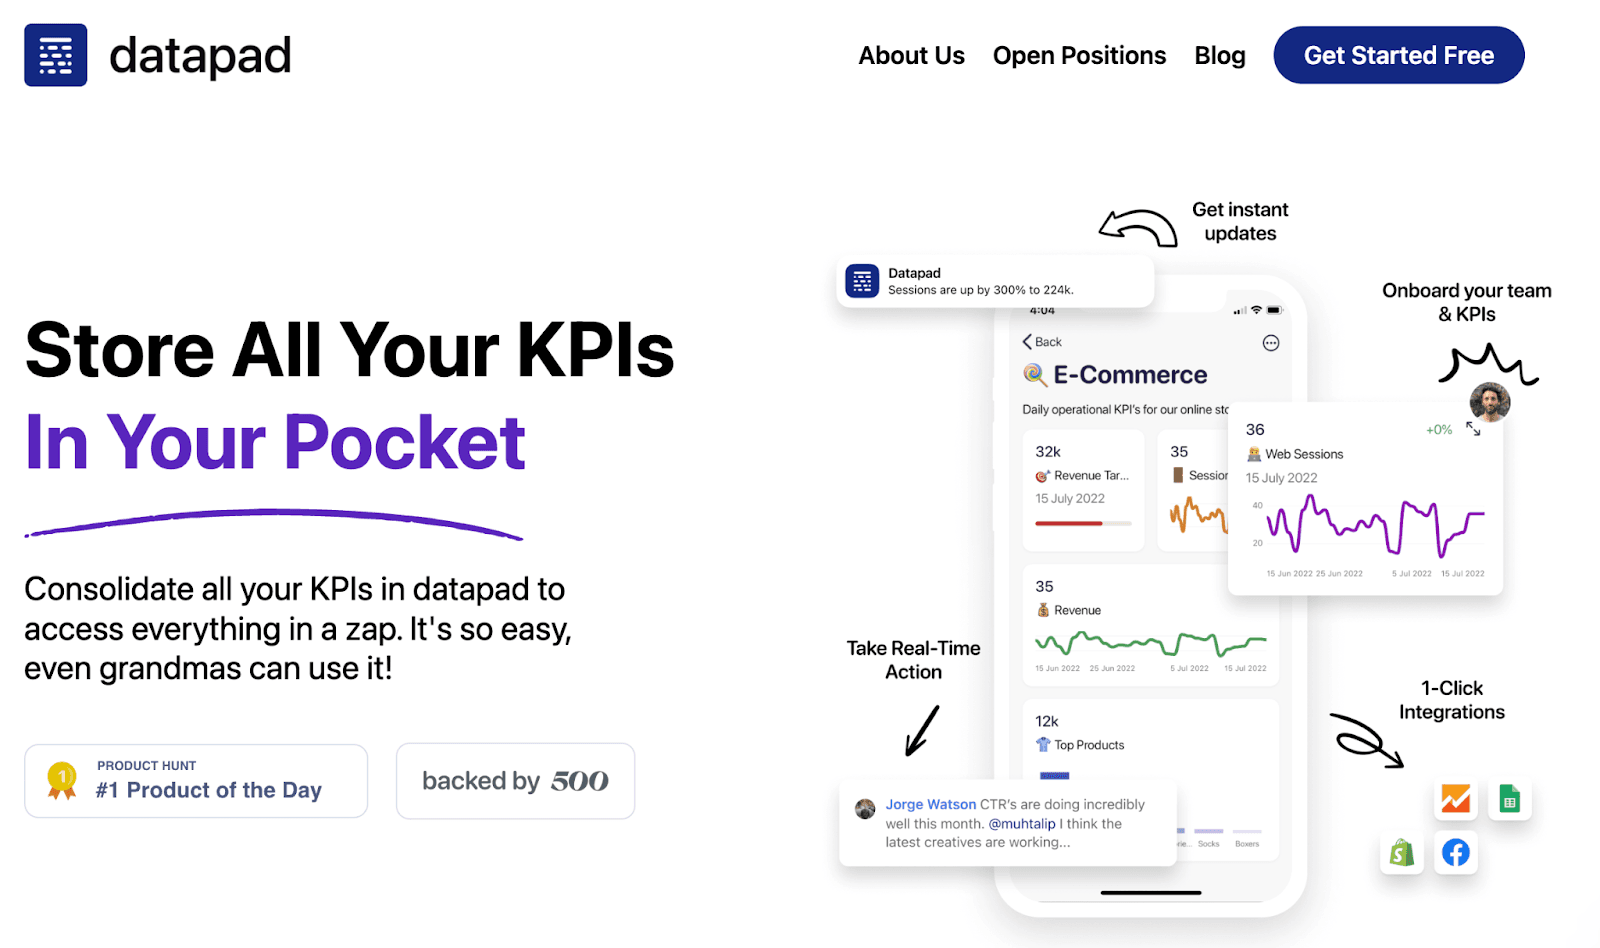
Datapad is a mobile-first dashboarding and analytics tool that could save you enormous time when tracking social media KPIs.
It allows social media managers to track, monitor, and visualize crucial social media metrics on their mobile phones.
You must be wondering, being a mobile-only platform, Datapad might lack behind in functionality. But that's not the case!
Datapad is designed to support all the features and functionalities of a typical desktop dashboarding software. Moreover, our tool is compatible with all known small-screen devices.
Besides, creating a social media dashboard in Datapad is no more than a three-step process.
Here's how you can do it effortlessly.
Step 1: Create a Dashboard
To get started, download our app (available for Android and iOS devices) and sign up with your email address.
Once we verify your email, you're all set to create a dashboard.
Open the app, and press the '+' sign in the top right corner.
Fill in details like the dashboard name and description, and click on Create.
That's it! Your dashboard has been created automatically.
Step 2: Bring Your Social Media Team On Board
Now that you have your personalized social media dashboard, it's time to onboard your team.
Datapad assists you with a quick and effortless team onboarding process. You can simply enter the email addresses of your teammates and send them email invites to get them onboard.
Step 3: Import Data to Your Dashboard
Once you're done and dusted with everything else, let's add some numbers to your dashboard.
Our tool lets you import data both ways - automatically and manually.
You can use our one-click integrations to import data hassle-free. Here's how automatic data import works:

Or, if you have a smaller data set, you can enter data manually with Datapad:

Step 4: Customize on the Go
Personalizing the look and feel of your dashboard won't be an issue with Datapad.
You can select the chart type, name, color, and set business goals for every KPI you plan to track on your social media dashboard.
What's more, we offer a string of features such as:
-
Comment under KPIs to trigger real-time communication
-
Set automated alerts for messages and changes in KPI trends
-
Assign tasks and monitor the activities of team members
-
Enable role-based management; control who can view/access/edit data
Sign up for Datapad today to experience the magic of free.