![12 Best Dashboard Tools in 2023 [In Depth Guide]](/_next/image?url=https%3A%2F%2Fframerusercontent.com%2Fimages%2FBgCBjb7ZQV9catN4CtYoW5Rodo.png&w=3840&q=75)
Some of the best dashboard tools for visualizing your metrics and KPIs are Datapad, Geckoboard, Databox, Plecto, Metabase, Redash, DashThis, ThoughtSpot, Yellowfin, Dundas BI, Sisense, and Phocas.
In this guide, you will find a detailed review of these dashboard software and also find the best one to reshape your performance measurement and reporting process.
But first things first, let’s address a basic question…
What Is a Dashboard?
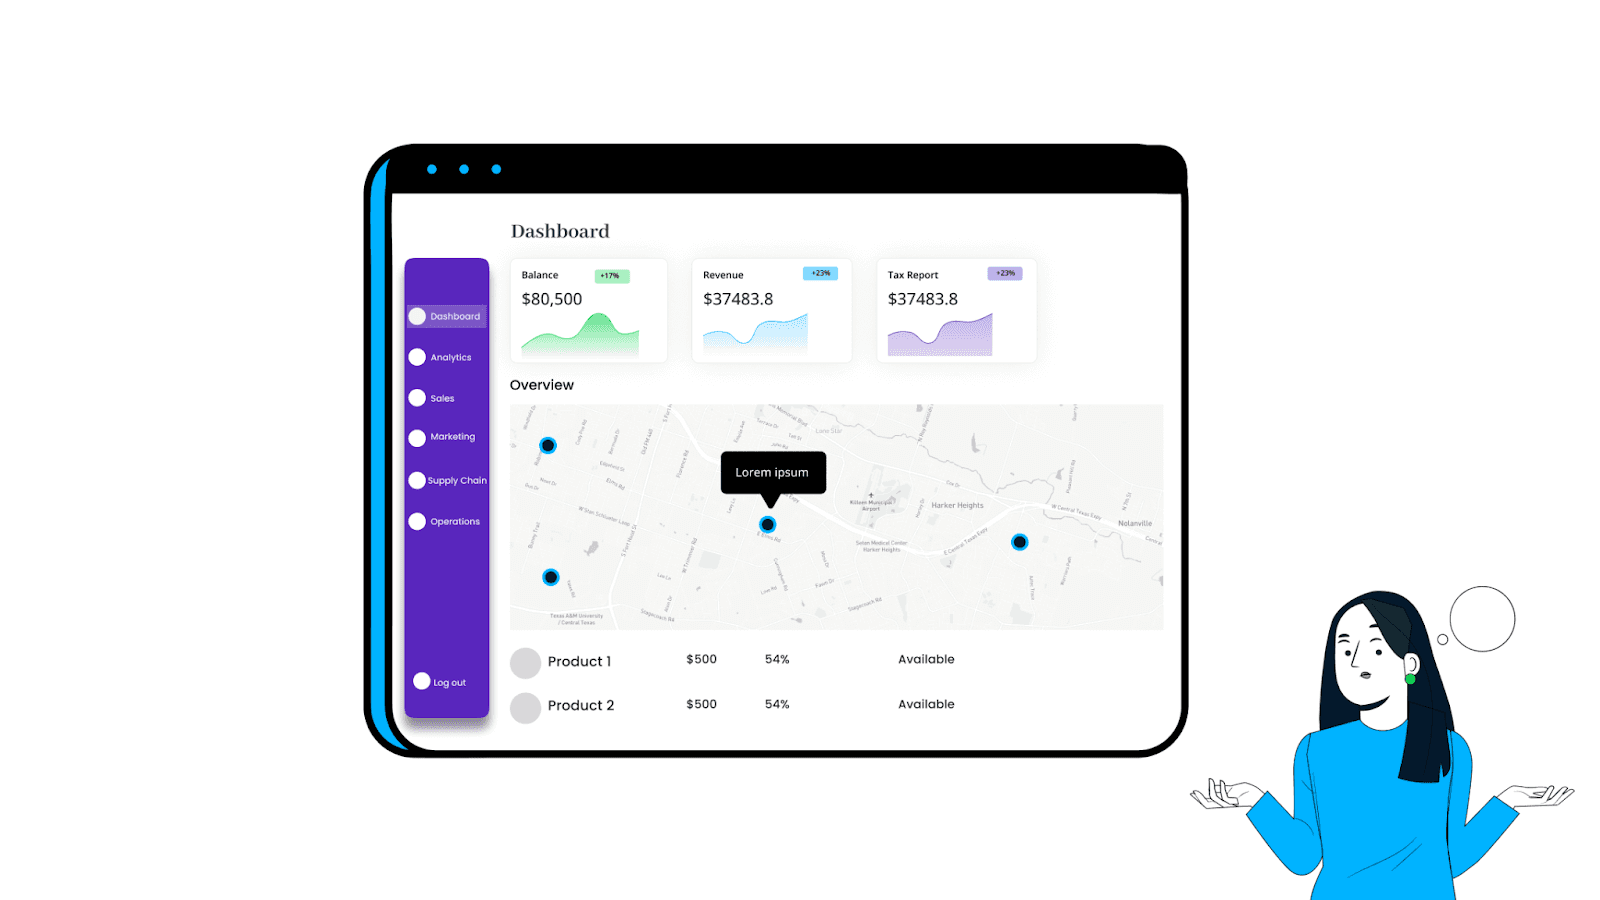
A dashboard is a graphical representation of all your data collected from different sources and channels to be displayed under a unified section.
While a dashboard can be used for all the good reasons, business owners typically use it as a knee-jerk reaction when they need to measure their business performance at-a-glance.
What's more, Dashboards generally comprise a set of KPIs and metrics inclined towards determining your business success over time.
Besides, they use tons of visualization elements like graphs, charts, tables, and even widgets to present these KPIs in an easy-to-understand format.
If you plan on manually creating a dashboard, it might be overwhelming, hectic, and time-consuming. However, modern problems require modern solutions. 😉
Platforms such as Datapad, Geckoboard, Databox, etc., help you create stunning dashboards with dynamic visual aids and analytical capabilities.
But with so many opinions available, how do you vouch for a dashboard that's perfect for your business needs?
Don’t worry, we’ll help you out. ✌🏻
Factors to Consider When Choosing the Best Dashboard Software For Your Team
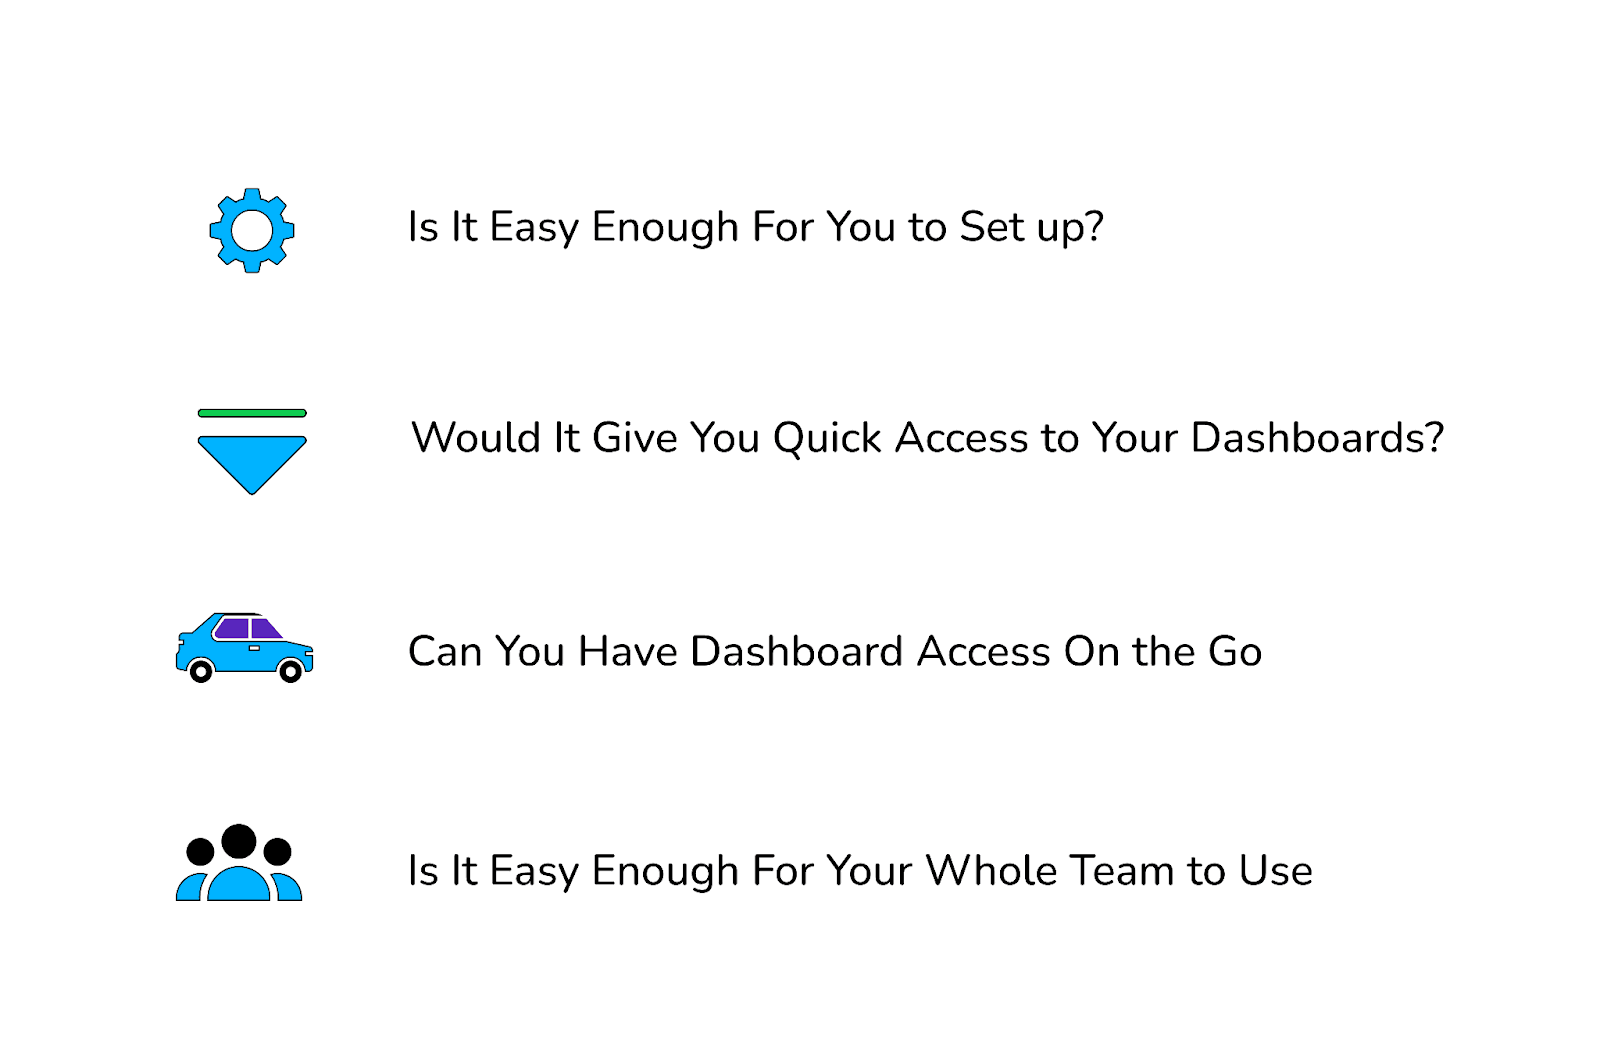
#1. Is It Easy Enough for You to Set Up?
Implementation is the most difficult part when getting your dashboard up and running. A typical dashboard tool can take up to a few minutes or even days to set up, depending on the assistance provided by the software.
Ensure that the platform provides adequate resources to help with initial configuration, like online setup guides, video tutorials, 'how-to' blogs, excellent customer support service, and more.
Another way to gauge this factor is to check the platform's online customer reviews. We highly recommend this because customers have a lot to unfold about the tools they use online.
#2. Would It Give You Quick Access to Your Dashboards?
Since you’re choosing a dashboard software to save time and resources, would you mind if the tool consumes the same time buffering?
Certain factors, such as multiple logins, poor navigation, and long-loading time prevent you from getting quick access to your dashboards.
Again, make use of online reviews and ratings to compare tools that offer efficient workflow vs. those that act as bottlenecks in quickly presenting the information you need.
#3. Can You Have Access on the Go?
Some dashboards are desktop-ridden – you can only access them while sitting against your system. Eventually, this limits you from staying updated or accessing your dashboard when you’re away or off work.
Nevertheless, your business is running 24/7 with or without you monitoring it. And leaving it unattended until office hours might be a little problematic at times.
So, ensure that the tool offers mobile-friendly dashboard solutions. Or even better, it comes with a dedicated mobile app. Any of these can help you access your dashboard on your mobile phone in real-time, regardless of your place or time.
#4. Is It Easy Enough for Your Whole Team to Use It?
While a dashboard tool does automate half your work, still, a significant portion of the work is to be done by you and your team.
Works like creating KPIs, assigning roles, determining goals, comparing results, and choosing data sets, are something AI can't do on its own.
Hence, a simple yet compelling UI/UX design goes a long way to assist your team in collaborating when working on a dashboard.
Besides, if you’re a non-tech company, we recommend choosing a no-code platform. This will help your team monitor, analyze, and visualize KPIs without writing a single line of code.
Down the lane, we have curated a list of the best dashboard tools, some no-code, some low-code, and some with dedicated mobile apps.
All of which you can find right here. 👇🏻
What Are the Best Dashboard Tools to Create Stunning Dashboards?
Before we start reviewing dashboard tools, here is a quick overview video:
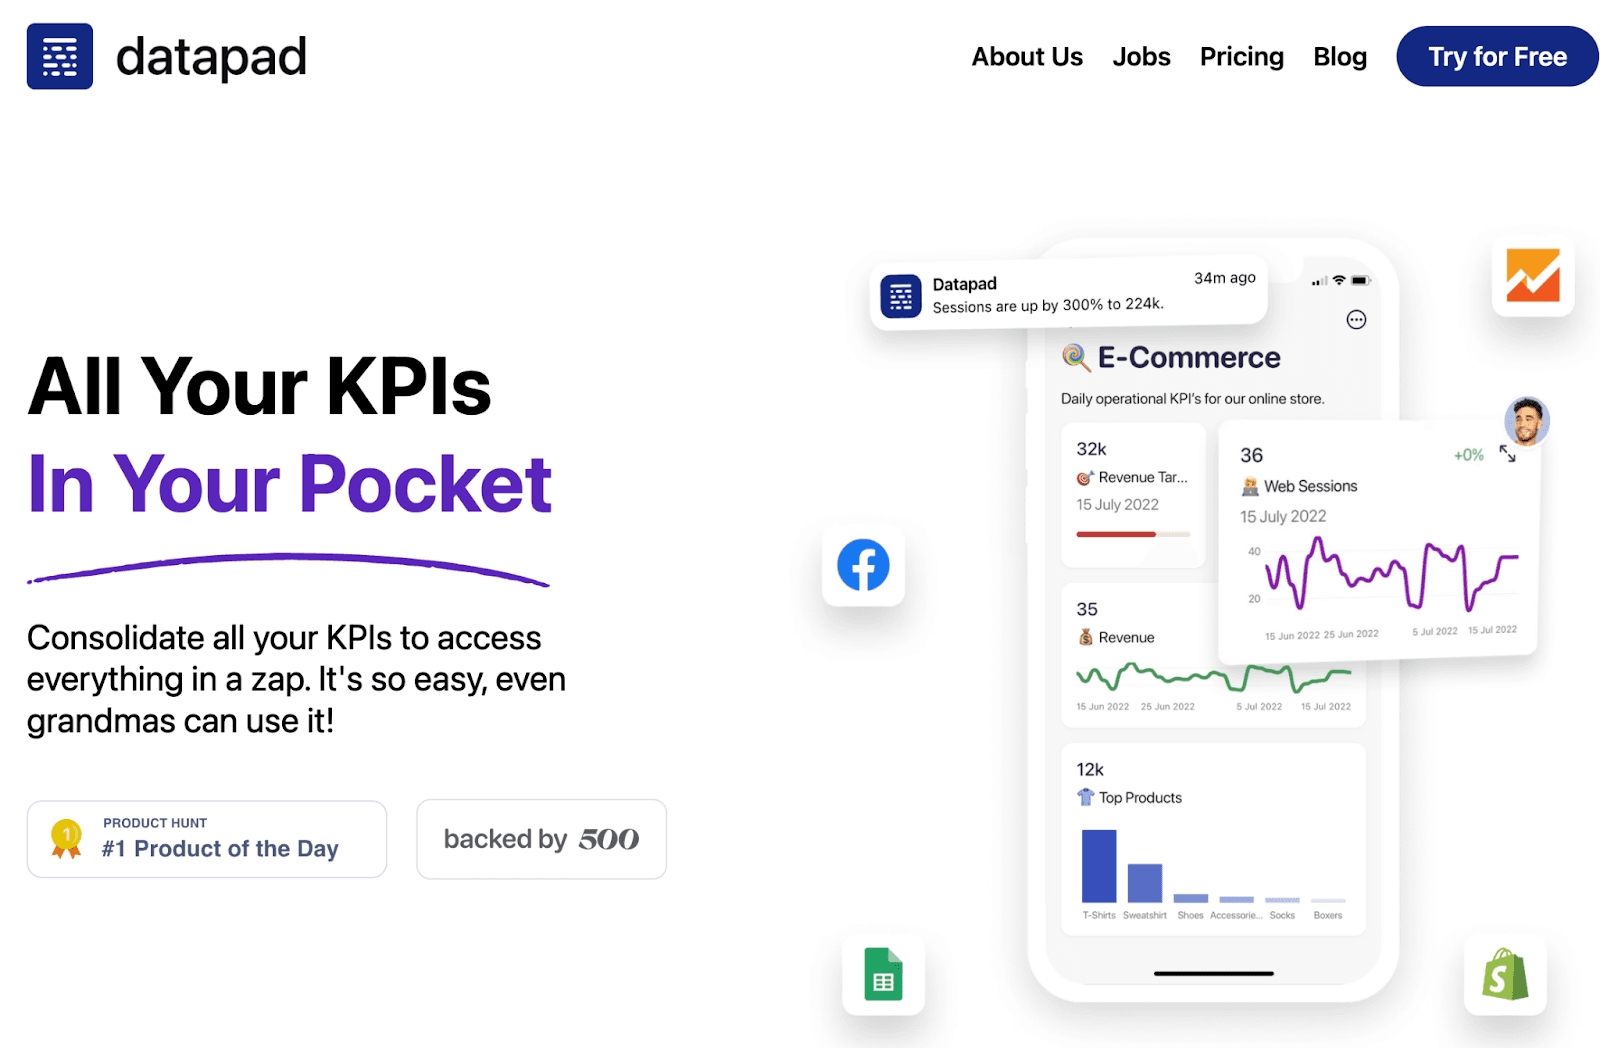
Datapad is the industry's first mobile-only dashboard tool that allows anyone to track, analyze, and visualize KPIs via beautiful and interactive dashboards.
Who Is It For?
Datapad is an excellent choice for gen z entrepreneurs who want to track and manage their business performance on the go.
It's also a mobile tool for small to medium biz that still needs to be funded enough to pay for another innovative tool.
Besides, here are some key features that make Datapad perfect for small to medium-sized enterprises and teams.
Key Feature #1. Access Dashboards in Real-time
With Datapad, you get the freedom to have your dashboards in your pocket (on your mobile phone).
You see, as a mobile-only tool, Datapad comes with a highly responsive mobile app that allows you to access your dashboard anytime and anywhere.
Besides, our app is designed in a way to present pixel-perfect dashboards on all known small-screen devices.
Even better, you can easily edit your dashboards in real-time. All you would need is a reliable network connection.
What's more, you can easily search for specific KPIs from any dashboard from within the app and get related insights on your mobile screen within seconds.
Here's how:

Key Feature #2. Ease of Data Import
Datapad offers both automatic and manual data import features.
You can use Datapad's one-click integrations to popular data points like Google Sheets, Facebook Ads, Google Analytics, and more to collect data with a tap. Here's how you can do it:

Moreover, you can also import data manually if you want to measure a specific dataset or add data to an existing data block. Here's how you can manually import data:

Key Feature #3. Seamless Team Collaboration
Our tool is built for progressive teams who like to nurture business growth via collaborative decision-making and team efforts.
Firstly, it lets you quickly onboard your teammates via email invites. Once they are onboard, you can easily assign tasks and set role-based management depending on individual members' roles and responsibilities.
And secondly, you can communicate with your team in real time within the platform. How?
Datapad allows you to comment under KPIs to strike a discussion anytime.
Here's how it works:
-
You place a comment under a specific KPI or metric
-
Datapad sends real-time push notifications to team members
-
Teammates can reply just below your comment
Following this, a conversation thread gets created that can be viewed anytime later on for clarification.
Here’s the feature in action:
Key Feature #4. Flexible Customizations
Another prolific feature of our tool is its no-code customization. That's right, you don't need a developer or require any tech expertise to visualize data.
Datapad's intuitive drag-and-drop customizer allows you to rearrange, replace, or edit every neck of the woods in your dashboard.
Besides, you get a gallery of pre-built templates and data visualization elements like graphs, tables, and charts to work-on data visualization with ease. Moreover, you can also customize the little things like font type, color, and text as per your company's branding guide.
Pros and Cons
Pros
✅ Datapad is a dedicated dashboards creation mobile app
✅ Provides instant access to dashboards via mobile
✅ In-built team chat and collaboration feature
✅ Allows to set up custom alerts for changes in KPI trends
Cons
❌ No web version of the platform (coming soon)
❌ Not suitable for creating sophisticated dashboards or meant for drill down on data
#2. Geckoboard
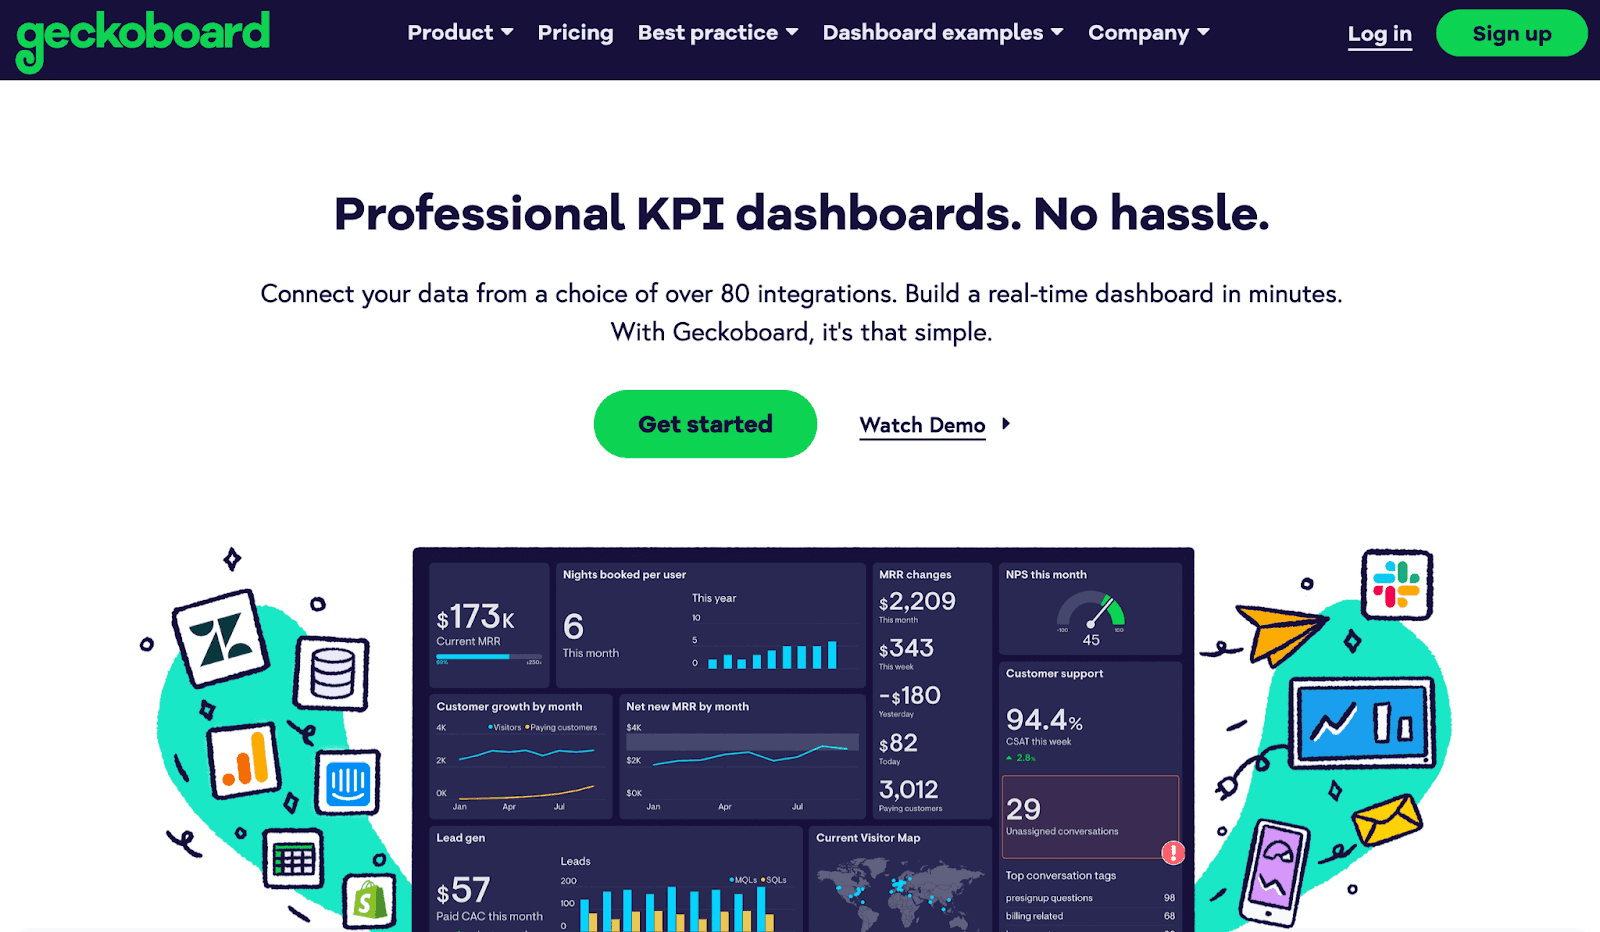
Geckoboard is a popular dashboard tool that allows you to share live data across teams and departments via professional-looking KPI dashboards.
Who Is It For?
1000s of data-driven organizations like Airbnb, Monday.com, BuzzSumo, and more use Geckoboard's professional dashboards to cater to their data visualization needs.
Besides, the platform also offers a free-forever plan making it a suitable choice for beginners creating their first-ever dashboard.
Features
-
Easily import data to dashboards from over 80+ data sources or use spreadsheets and custom APIs to import data manually
-
Intuitive drag-and-drop editor to rearrange or customize every section of the dashboard
-
Enable role-based management to control who can view or edit dashboards
-
Generate secure links to easily share live dashboards; setup automatic emails with snapshots of the dashboard to specific clients
-
In-built display-to-TV feature to present live dashboards on big TV screens and keep your team updated with business trends in real-time
Pros and Cons
Pros
✅ Easy to use and setup
✅ Offers mobile-friendly dashboards
✅ Includes free-forever plan
Cons
❌ Lacks real-time alerts and notifications
❌ Creating multiple dashboards with Geckoboard can be costly
#3. Databox

Databox is a leading business analytics tool and KPI dashboarding platform that lets you easily connect data, build dynamic dashboards, and uncover hidden insights from a single screen.
Who Is It For?
Databox is an easy-to-use platform that caters to over 20,000+ businesses. The platform is great for organizations requiring too many integrations and connectors.
Besides, similar to Geckoboard, Databox has a free-forever version making it a decent choice for startups and solopreneurs.
Features
-
Has over 70+ one-click integrations to popular data sources and allows importing data via custom APIs, Google Sheets, Zapier, etc.
-
Comes with drag-and-drop dashboard designer tool to quickly build and customize dashboards from scratch - no coding required
-
Over 200+ pre-built dashboard templates and examples, hundreds of data blocks, and thousands of metrics ready to be used
-
Use the in-built query builder to combine data and create custom metrics
Pros and Cons
Pros
✅ Supports a decent number of integrations and data connectors
✅ Get automated alerts for changes in KPI trends
✅ Offers white-label dashboards
Cons
❌ Limitations in viewing historical data (depends on the plan)
❌ Limited customization options
#4. Plecto

Plecto helps companies around the world not just measure but boost performance and generate a hoard of actionable insights via interactive KPI dashboards.
It's the only dashboard software that combines KPI visualization with gamification and coaching tools to provide a suite of dashboard solutions.
Who Is It For?
Plecto is a versatile tool that caters to all types of organizations regardless of industry and size. Mainly for companies looking to motivate and engage employees to perform better.
Features
-
Over 100+ one-click integrations to popular platforms and data points
-
Combine multiple integrations to create custom KPIs and measure exactly what your business needs
-
Choose from a library of 200+ pre-built widgets to quickly create dashboards
-
Leverage KPI-crushing contests and rewards to encourage employees for carrying out healthy competition among them
-
Get automated push notifications on mobile when performance goes below a certain threshold, both overall and for specific campaigns
Pros and Cons
Pros
✅ Create unlimited dashboards at a fixed monthly price
✅ Excellent number of integrations and data connectors
✅ Instantly view dashboards over mobile phones, iPad, or even Apple Watch
Cons
❌ Comes with a steep learning curve due to the number of features
❌ Not a budget tool for small-sized businesses
#5. Metabase
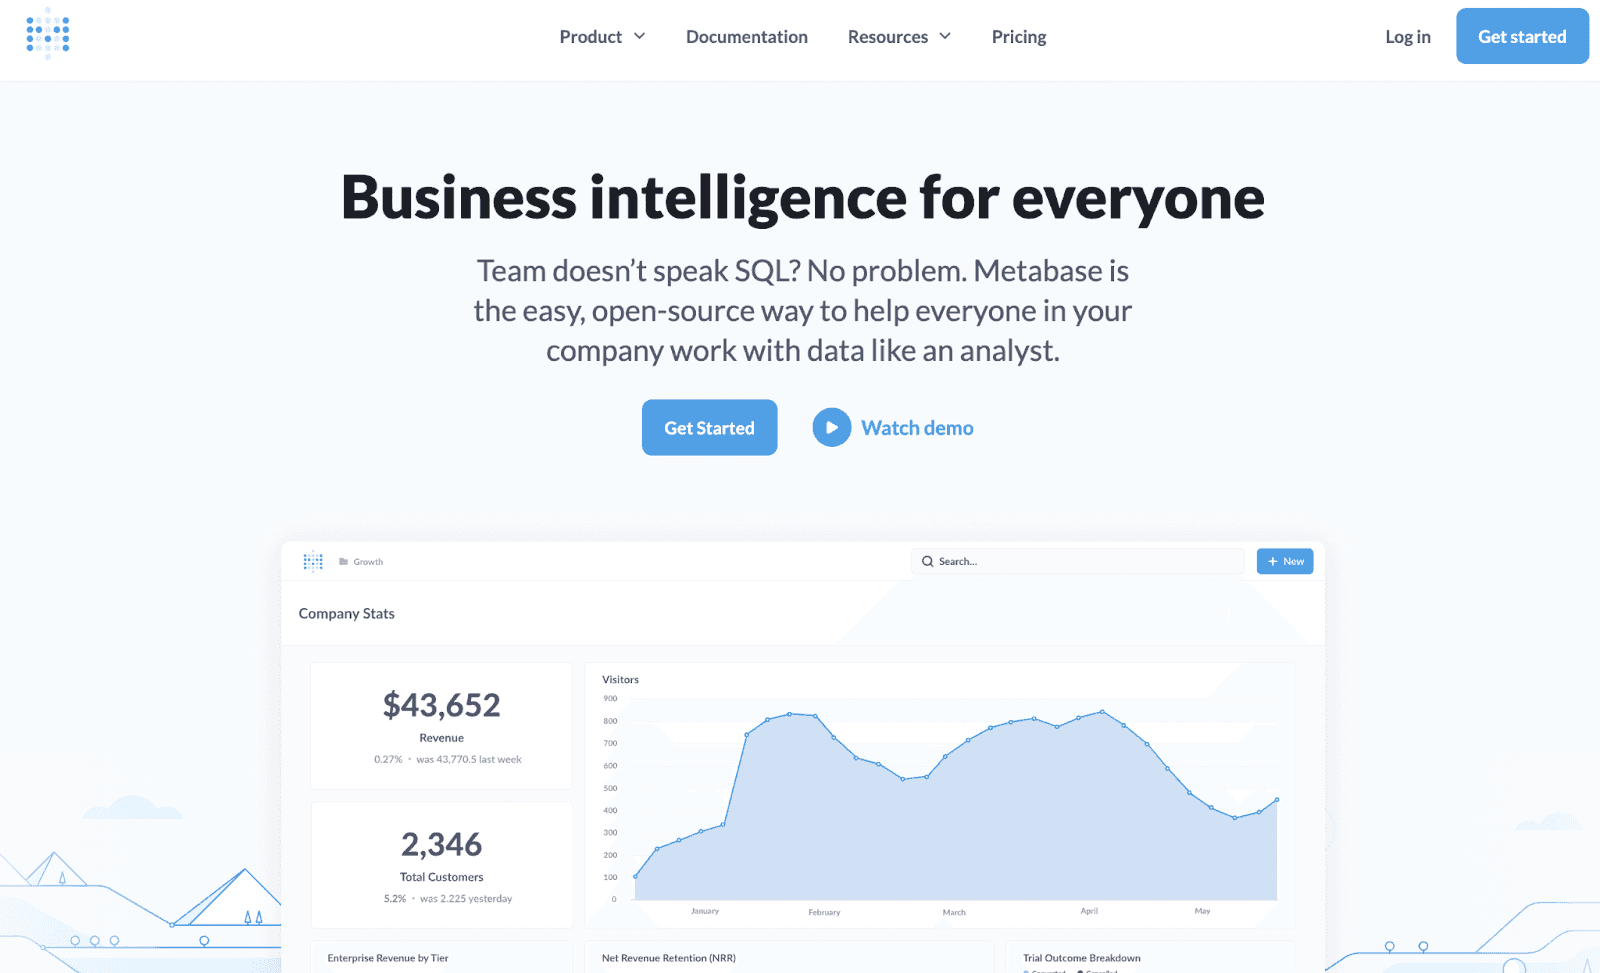
Metabase is an open-source business intelligence software and analytics solution that allows anyone in your organization to get answers to complex data queries via easy-to-explore interactive dashboards.
It's an excellent tool when it comes to answering questions about data without writing a single line of code.
Who Is It For?
45,000+ companies, including Angellist, Dribble, Calendy, and more, trust Metabase with their data visualization and dashboarding needs. The tool's meant for mid-sized businesses that have a significant amount to invest in KPI tracking.
Features
-
Has over 15+ pre-built visualization elements and an intuitive drag-and-drop editor to create beautiful live dashboards
-
Easy spreadsheet-like controls and built-in tools like filters and action menus encourage business users to use dashboards as a knee-jerk reaction to further exploration
-
Use advanced tools like Notebook and SQL Editor to dive deeper into your data, perform complex calculations, and discover hidden insights
-
Enable role-based management to control who can view/access/edit dashboards
-
Integrate with SSO of choice to automatically handle user signups and group permissions
Pros and Cons
Pros
✅ Easy to use and setup
✅ Has an excellent UX interface that is great for beginners
✅ Impressive data exploration capabilities
Cons
❌ Lacks key features like ad hoc reports, benchmarking, and predictive analysis
❌ Has a steep learning curve (highly reliant on SQL)
#6. Redash
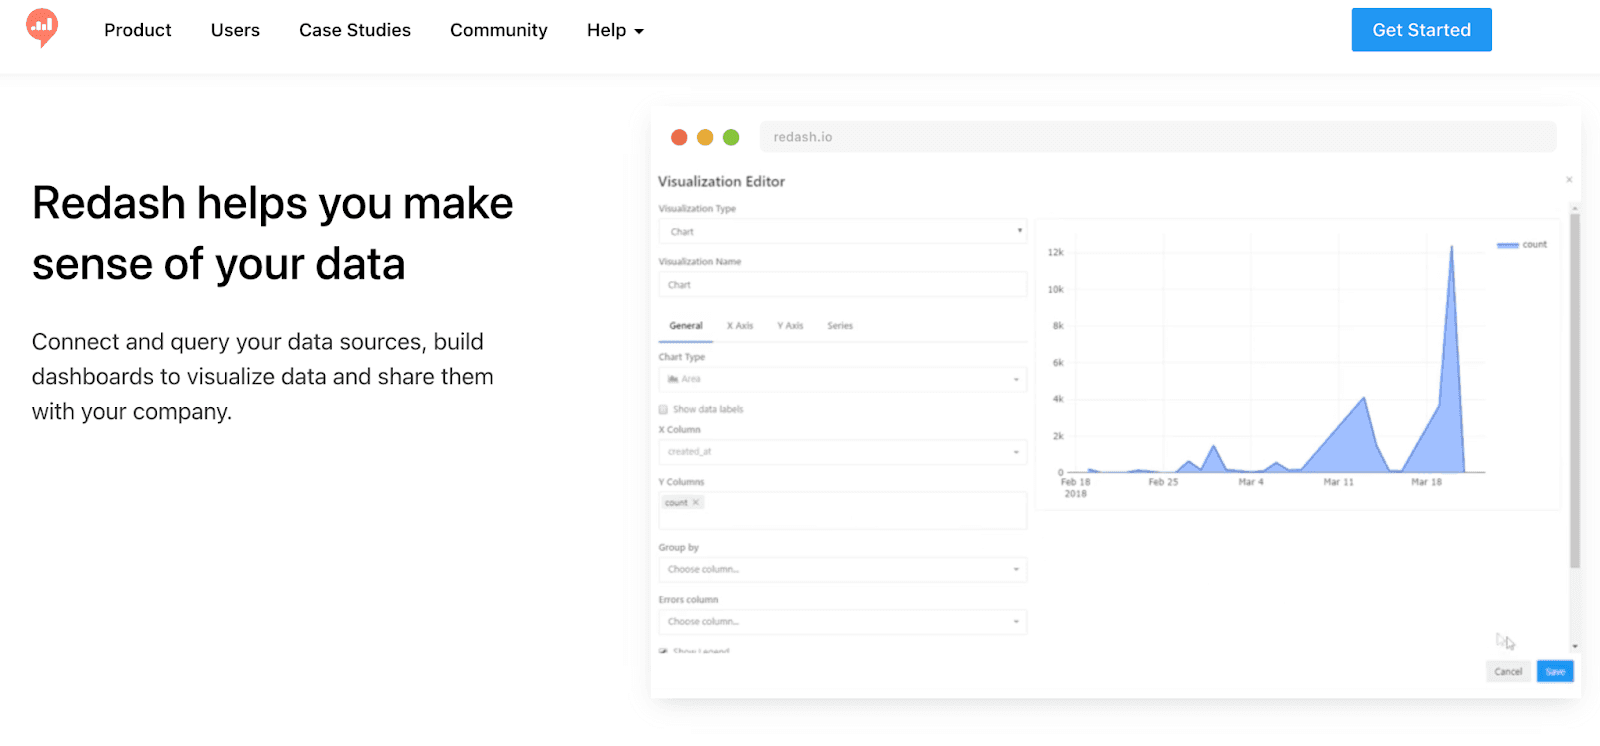
Redash is a low-code, publicly accessible dashboard software that allows you to harness the power of data by creating beautiful and insight-driven dashboards within minutes.
Who Is It For?
From small teams to huge organizations like Alibaba, Redash caters to tens of thousands of organizations. Besides, SQL users leverage Redash to explore, query, visualize, and share data from any data source.
Features
-
Leverage in-built Query Editor to write queries in natural syntax, explore schemas, create snippets, and auto-complete lines of code
-
Choose from a gallery of visualization elements like charts, cohorts, boxplots, maps, and more to create eye-catching dashboards within minutes
-
Easily share dashboards via smart URLs or embed widgets anywhere you need for timely and contextual data
-
Set up automatic event-driven alerts for proactive decision-making; enable role-based management to confine or democratize access to dashboards
Pros and Cons
Pros
✅ Easy to setup and configure
✅ An open-source platform allowing anyone to contribute to the cause
✅ Strong data modeling layers, suitable for creating sophisticated dashboards
Cons
❌ Requires basic knowledge of SQL
❌ Limited number of data visualization elements (compared to other tools in the list)
#7. DashThis
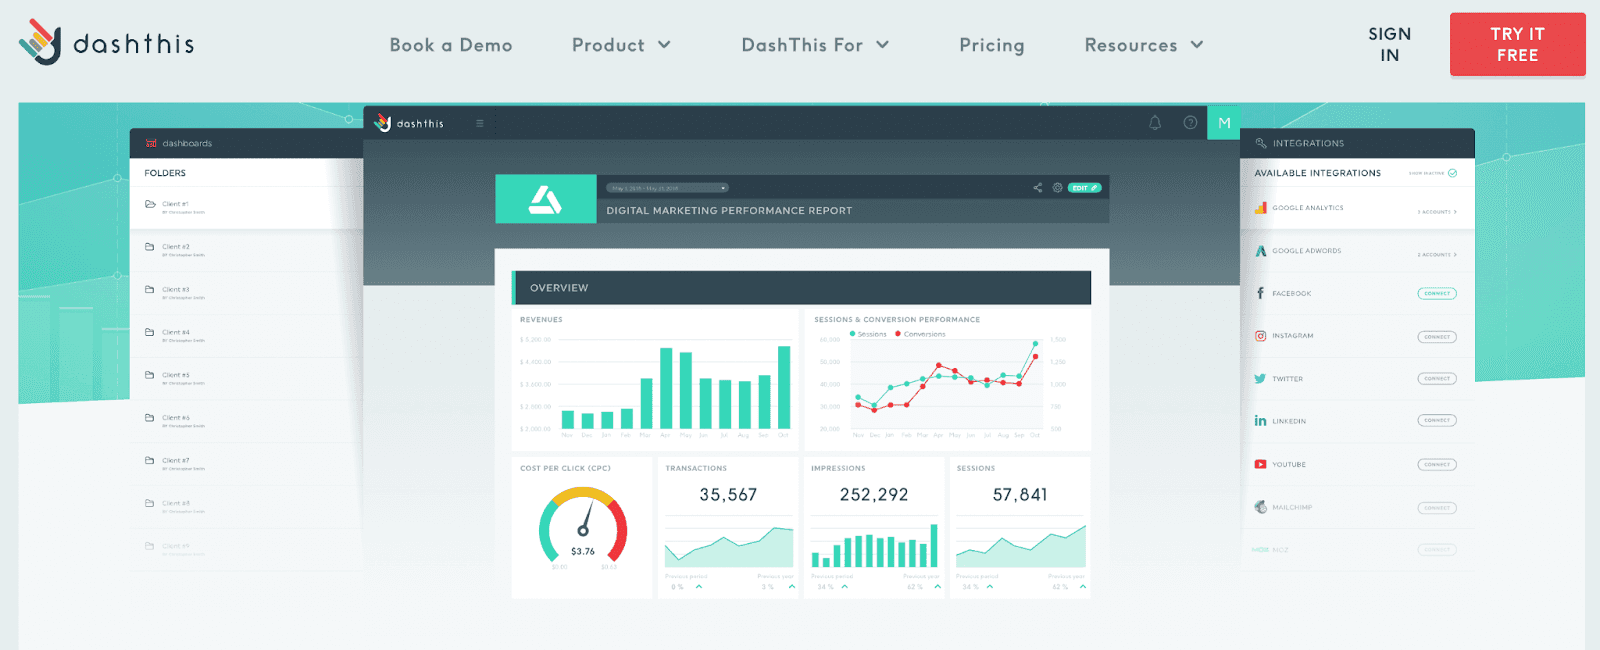
DashThis is a cloud-based automated marketing reporting tool that makes your life simpler and your business traceable by helping you to create meaningful dashboards.
Who Is It For?
DashThis is a popular tool among digital marketing agencies, marketing teams, small businesses, c-level executives, and freelancers.
Features
-
Easily import data via one-click Integrations to over 34+ popular marketing platforms
-
Has an extensive gallery of 50+ pre-built dashboard templates and 1000+ widgets to quickly build dashboards
-
Make use of grouping and cloning features to replicate pixel-perfect dashboards and prevent double work
-
Easily export dashboards and reports in multiple formats or share live dashboards via smart URLs
-
Use white-label customizations to add your brand's logo, color schemes, and custom domain to make the dashboard your own
Pros and Cons
Pros
✅ Data on dashboards refresh automatically
✅ Mind-blowing customer support
✅ Unlimited client accounts, data sources, and users with any plan
Cons
❌ Not a great tool for creating sophisticated dashboards
❌ Limits in terms of data visualization and presentation
#8. ThoughtSpot
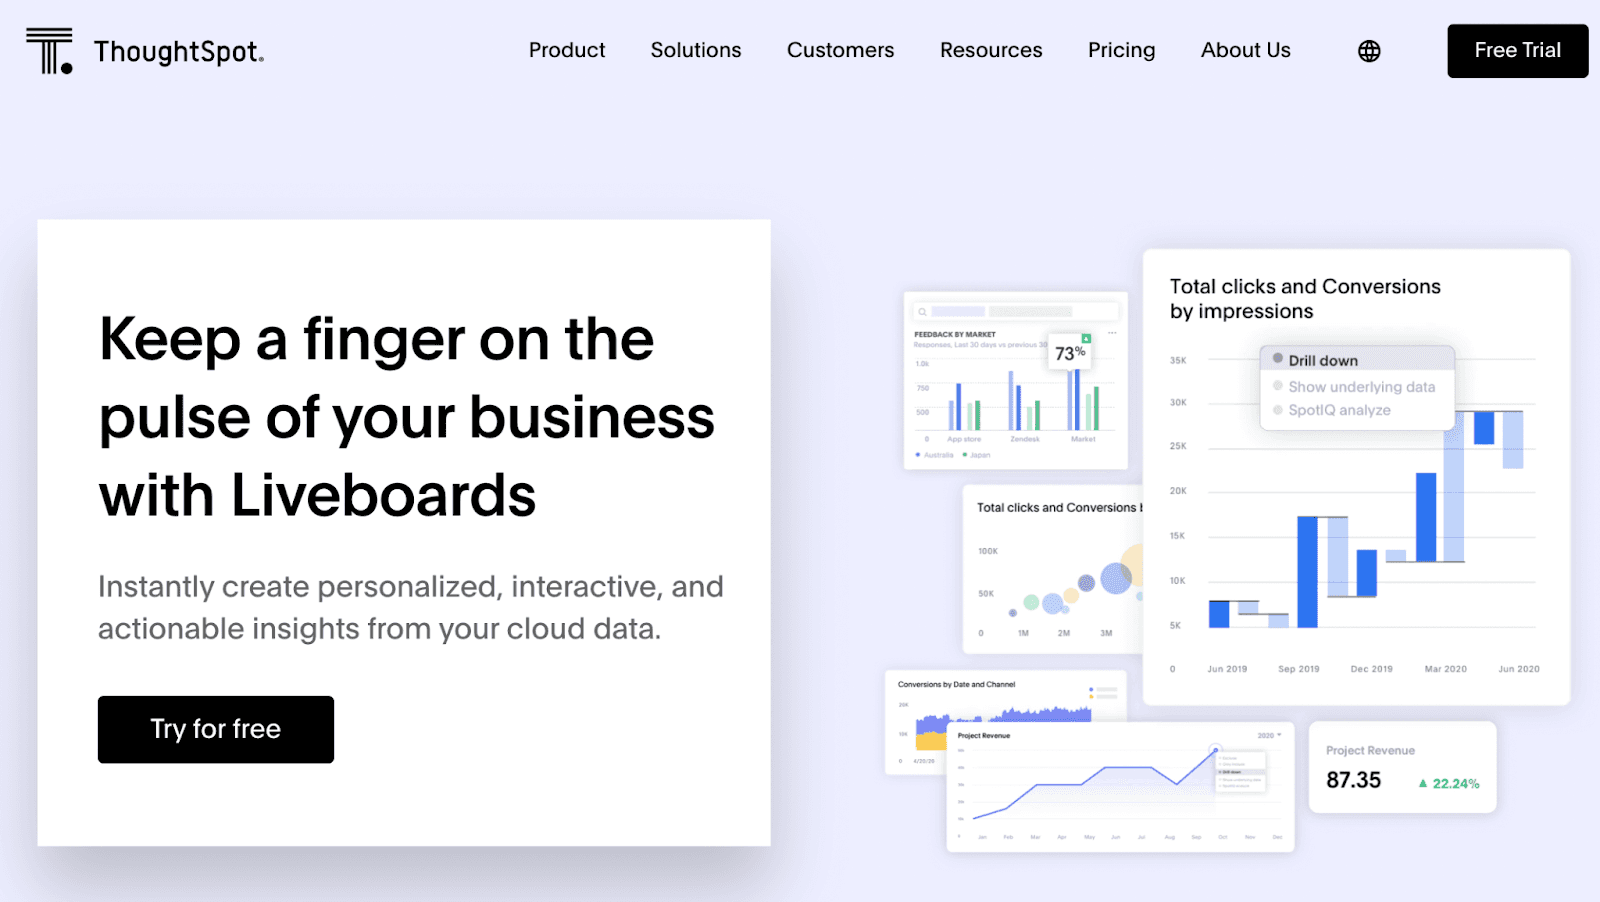
ThoughtSpot is a self-service BI dashboard platform that leverages ML and AI to empower anyone to explore, analyze, and visualize complex data into easy-to-read dashboards.
Who Is It For?
ThoughtSpot is an excellent choice for organizations seeking a deeper understanding of their proprietary data to make better data-driven business decisions.
Moreover, the tool makes analytics available with the ease of a search function, making it a decent choice for non-technical users and beginners.
Features
-
Leverage intelligent query generation to search across complex schemas using natural language, all with 100% accurate results
-
Dozens of pre-built data visualization elements, advanced chart configurations, and an intuitive drag-and-drop editor to create compelling live dashboards with ease
-
Quickly share charts or liveboards with a click; receive proactive alerts on Slack, email, or mobile when key business metrics and trends change
-
Keep data safe from hacking and accidental leakage by restricting access via granular user privileges
-
Use ThoughtSpot Mobile to get instant access to KPIs and liveboards, even in offline mode
Pros and Cons
Pros
✅ Well-defined integrations and custom connectors
✅ Excellent customer support
✅ Great for handling complex data and creating custom dashboards
Cons
❌ Limited customization options
❌ Lacks adequate user training resources (makes it tough to use the platform)
#9. Yellowfin BI
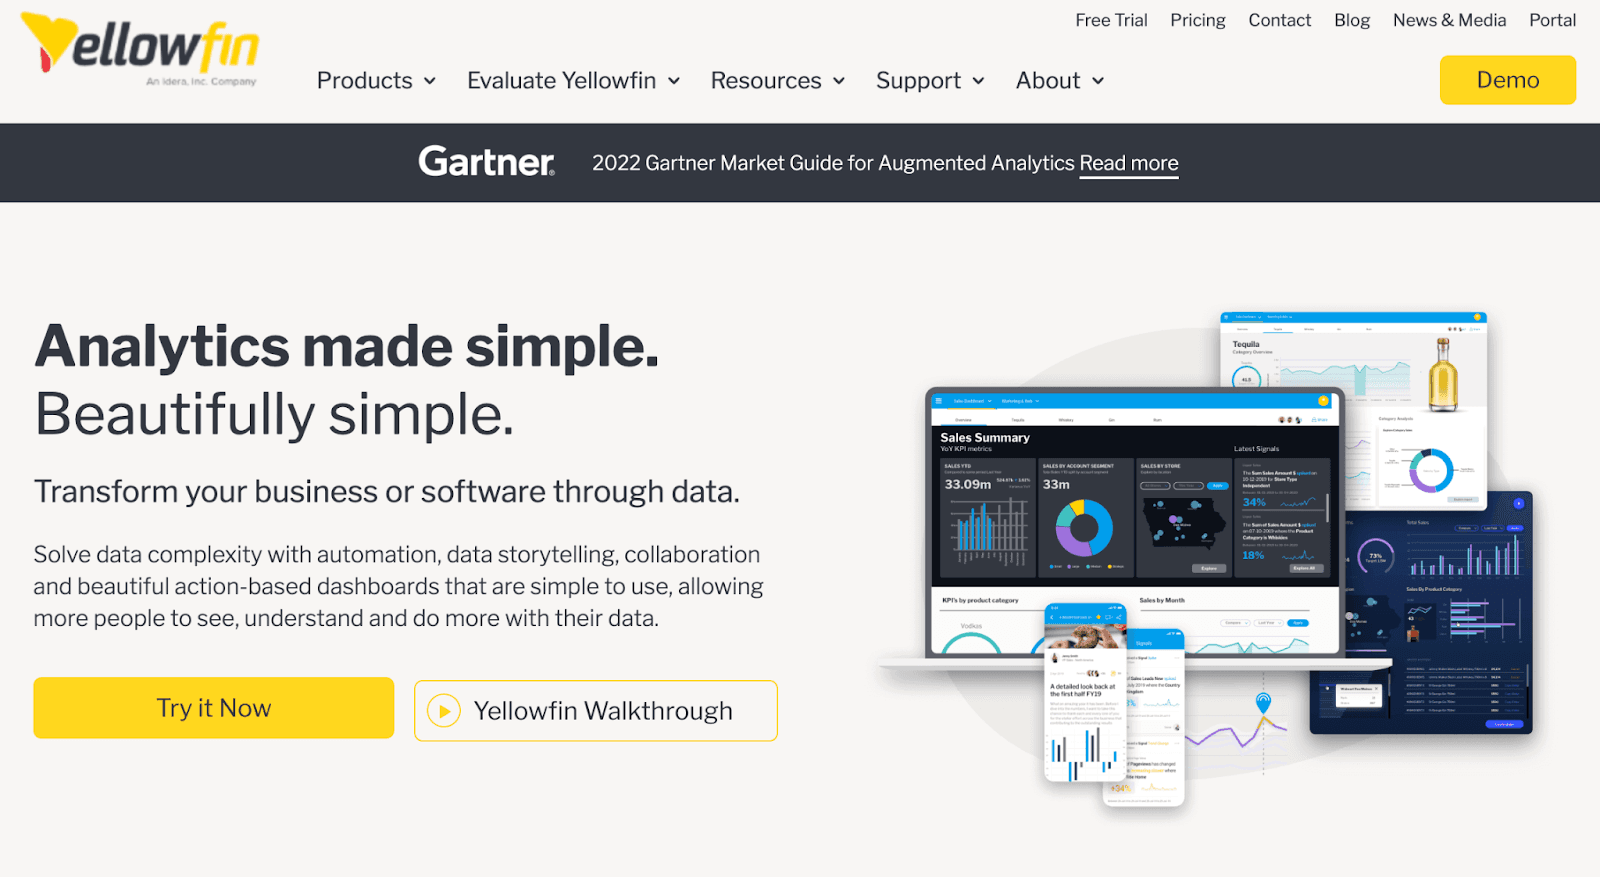
Similar to ThoughtSpot, Yellowfin BI is a self-service data analytics platform that simplifies the entire analytics process by helping you connect, prepare, and visualize business data via easy-to-read dashboards.
Who Is It For?
Over 29,000+ world-class companies, including Honda, Coca-Cola, and more, trust Yellowfin for their data visualization and dashboarding needs.
Moreover, it's a wise choice for data scientists, analytics teams, developers, and all sizes of businesses dealing with complex datasets.
Features
-
Has an extensive dashboard gallery, over 50+ data visualization elements, and an in-built canvas designer to create beautiful dashboards with ease
-
Use no-code/low-code action buttons to support and trigger workflows like logging a ticket or writing a note directly from within the dashboard
-
Discover changes and outliers in your data in real time via threshold-based alerts or fully automated AI-driven signals
-
Leverage AI and ML capabilities to perform automated analysis, compare trends or forecast revenue
Pros and Cons
Pros
✅ Easy to setup and use
✅ Offers interactive and mobile-friendly dashboards
✅ Suitable for creating sophisticated dashboards
Cons
❌ The platform is only accessible through the web application
❌ Poor customer support (does not offer a Knowledge Base, Forum, or Phone support)
#10. Dundas BI
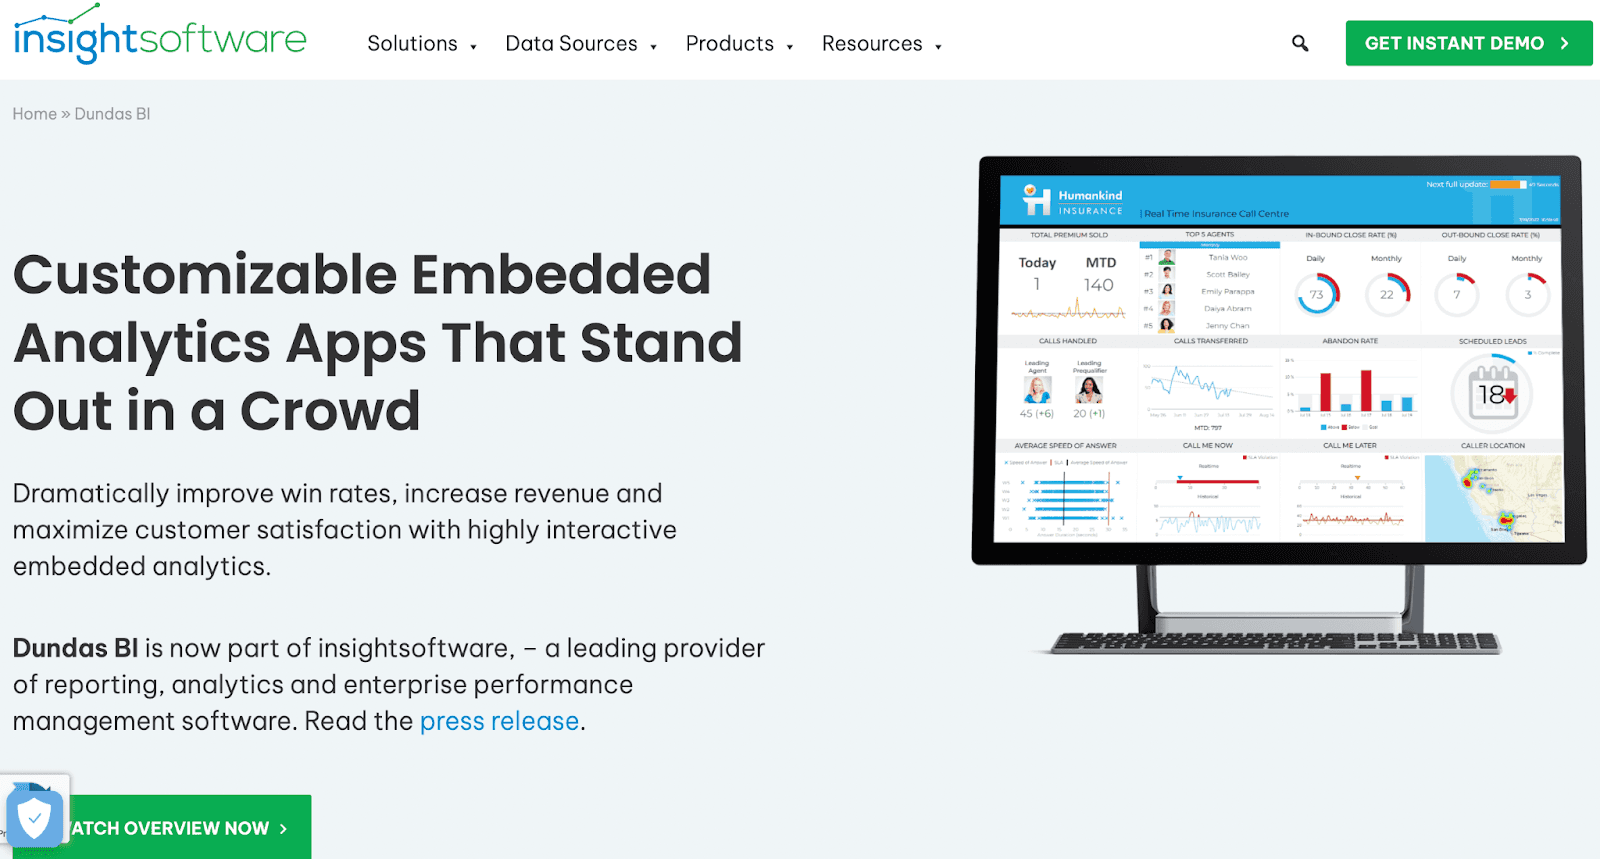
Dundas BI (now owned by Insight Software) is a low-code business analytics and dashboard creation tool that lets you quickly visualize data and create highly customizable dashboards.
Who Is It For?
Dundas BI is a lightweight yet robust dashboard tool that can be utilized by small to large-sized organizations. Its customer base includes the likes of IBM, Symbox, CyberMaxx, and more.
Features
-
Over 55+ smart data connectors, including cloud data warehouses and traditional SQL databases to easily import data into dashboards
-
Use in-built z-engine to analyze and optimize tens of thousands of user requests within minutes
-
Empower multi-source analysis and data mashups using z-engine's fusion technology
-
Easily embed Dundas BI tool with business processes and applications to automate actions and workflows
-
Use white-label capabilities to transform and customize the dashboard look with your company's branding and color palette
Pros and Cons
Pros
✅ Satisfactory third-party integrations and data connectors
✅ Allows you to embed the tool into workflows
✅ Offer white-label dashboards
Cons
❌ Requires you to have technical know-how
❌ Limited customizations (compared to other similar tools)
#11. Sisense
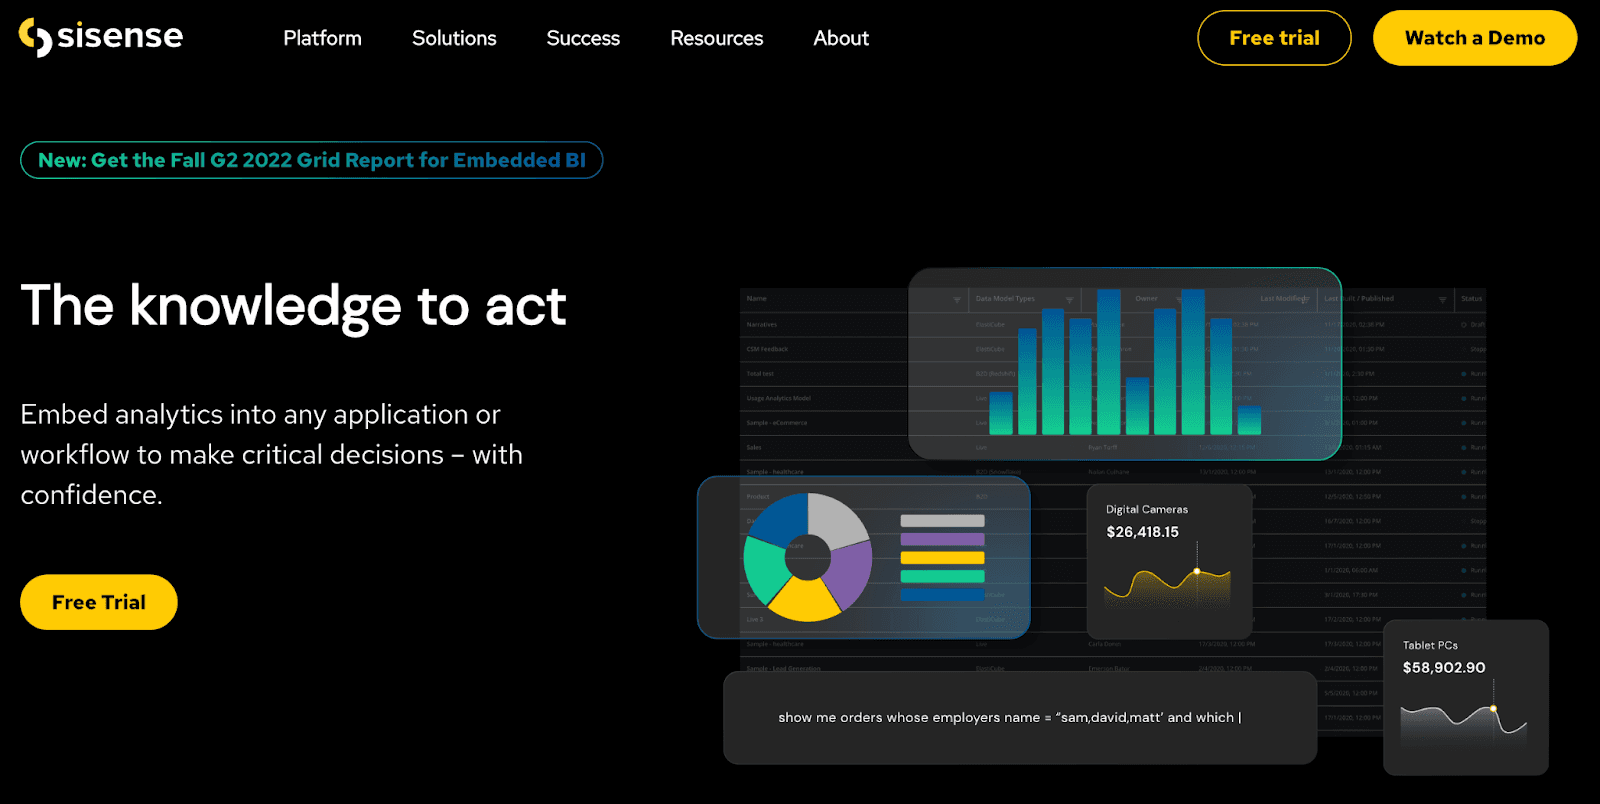
Sisense is a low-code business analytics and dashboard tool that helps visualize data via dynamic dashboards. It also allows you to infuse business dashboards into day-to-day processes and workflows to make better data-driven decisions on the go.
Who Is It For?
Sisnese caters to all types of organizations regardless of size or industry. Skullcandy, Philips, ZoomInfo are some of its top customers.
Besides, the platform offers custom pricing, making it a feasible solution for beginners and small businesses just starting their dashboarding journey.
Features
-
Easily create dynamic dashboards using its drag-and-drop interface and data exploration capabilities
-
Has an extensive gallery of pre-built templates, data visualization elements, and widgets to quickly create stunning dashboards - no coding required
-
Easily export dashboards in multiple formats or share dashboard links from the web app or via emails
-
Build app-like functionalities using Sisense's robust APIs and SDK capabilities
Pros and Cons
Pros
✅ Offers flexibility and scalability as your company grows
✅ Excellent number of integrations
✅ Allows you to embed analytics into any application
Cons
❌ It doesn't allow granular formatting like changing font styles
❌ Has a steep learning curve due to its low-code interface
#12. Phocas
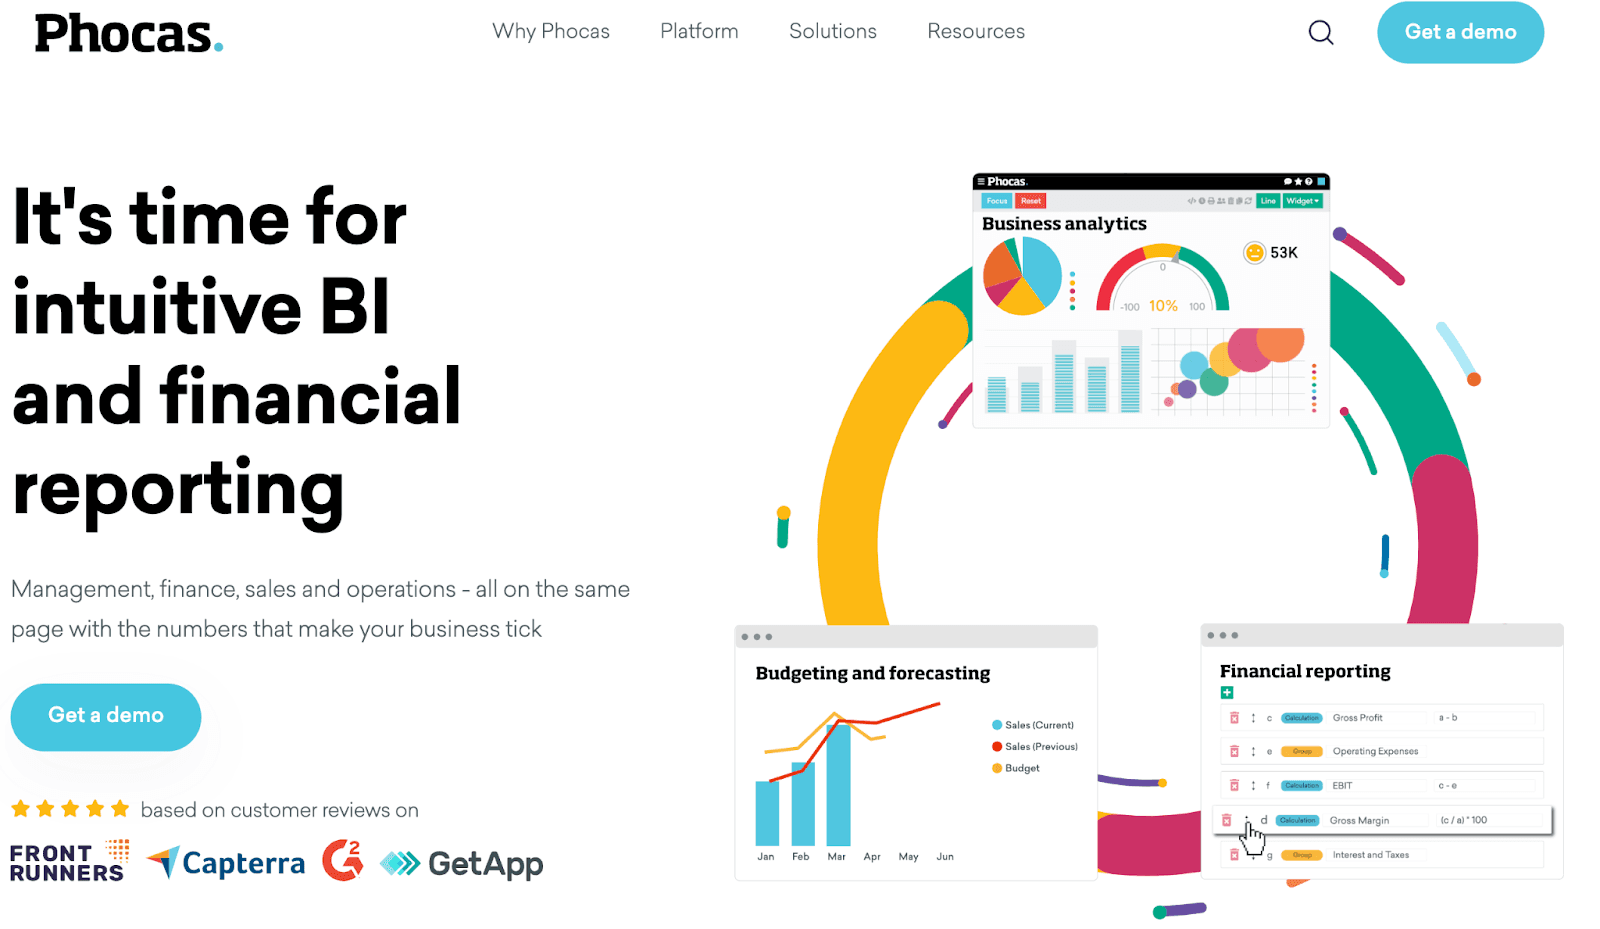
Phocas is an all-in-one business planning and analytics platform that helps you centralize data collected from multiple data sources and present them via easy-to-read dashboards.
Who Is It For?
Phocas serves businesses of all sizes and industries. It's typically used to monitor and visualize management and financial data, helping companies make better financial decisions.
Features
-
Over 200+ integrations to third-party data sources, including Infor, Netsuite, SAP, and more
-
Use drag-and-drop database designer to quickly bring in new data sources, create data mashups, and configure Phocas to suit business needs
-
Choose from a variety of charts and graphs, including pie charts, bubble charts, gauges, and waterfall charts, to tailor and customize dashboards as you desire
-
Easily collaborate with others by creating favorites, saving queries, and "@" mentioning team members
Pros and Cons
Pros
✅ Spectacular data visualization features
✅ Allows you to integrate with existing CRMs
✅ The dashboards are intuitive, well laid out, and with multiple integrations
Cons
❌ A bit pricey for small to mid-sized organizations
Have All Your Dashboards In Your Pocket with Datapad
Aren't these tools great? But each one has some cons, which might stress you into thinking twice before making a choice.
Anyways, are you still confused about which dashboard tool to choose?
We will try to make this easier.
Go for Datapad. 🥳
Datapad has everything to offer that a prolific dashboard tool has for you and the decision-makers of your company. The only difference is other platforms charge for their services, while our tool (Datapad) is free for you to use.
Besides, you have everything jam-packed in a mobile app:
-
Tons of pre-built visual elements and widgets
-
Pixel-perfect dashboards compatible with all small-screen devices
-
In-app team collaboration and chat feature
-
Real-time alerts and push notifications
-
Multiple ways to aggregate data and excellent third-party integrations
And many more…
Why don't you try Datapad and feel its brilliance yourself?
Scan the QR below to Install Datapad Today!