
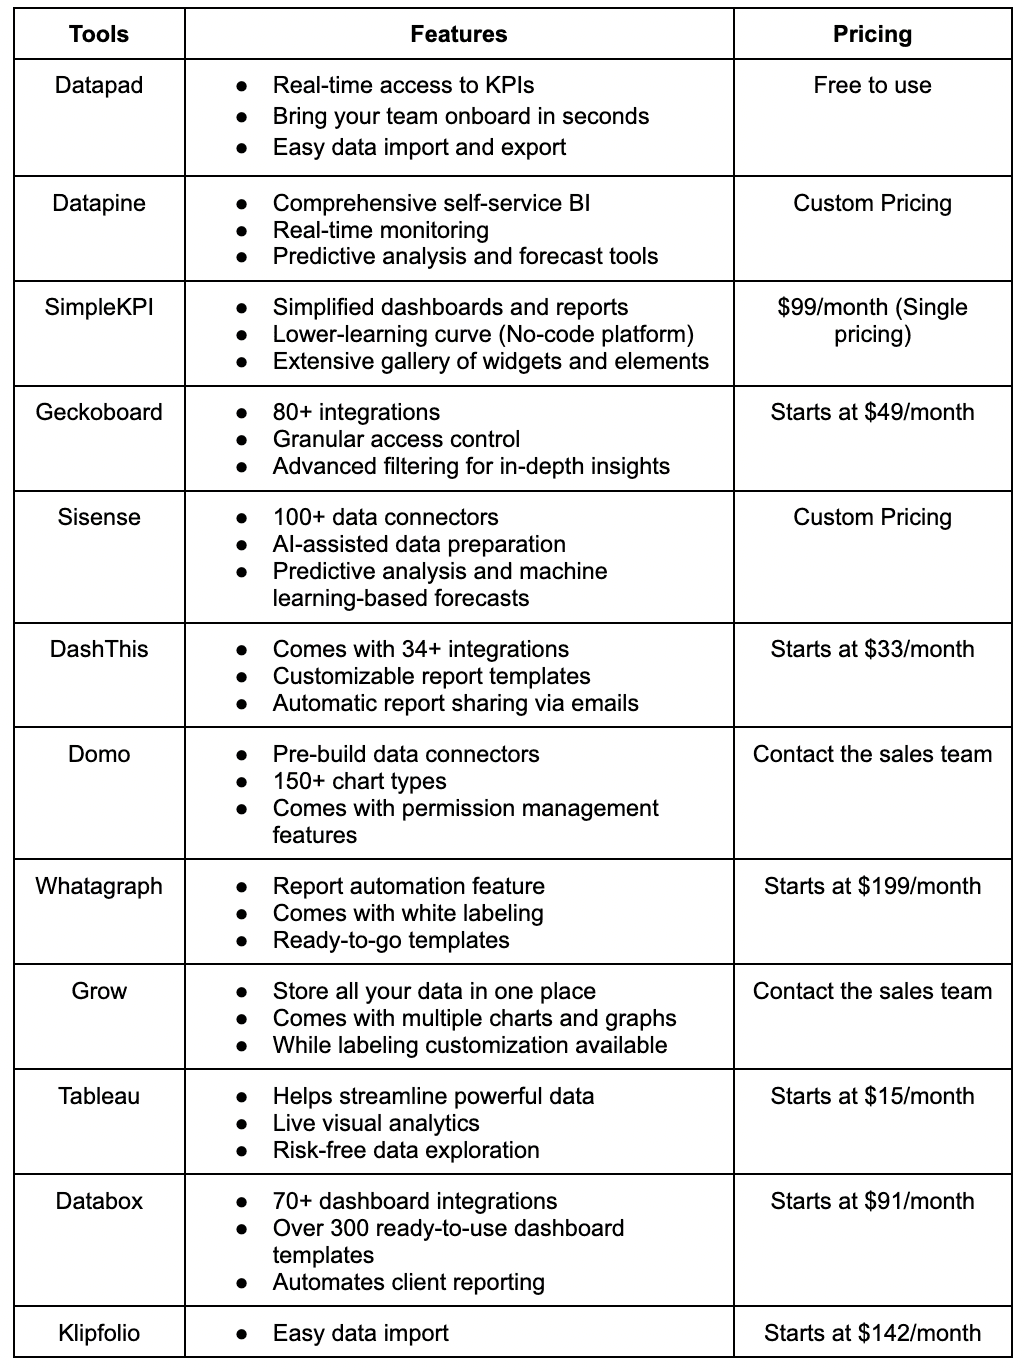
Some of the best KPI tools for staying on top of your business are Datapad, Datapine, SimpleKPI, Geckoboard, Sisense, DashThis, Domo, Whatagraph, Grow, Tableau, Databox and Klipfolio.
In this guide, you’ll find a detailed review of all the above-mentioned KPI tools, their features, pricing, and decide which one’s the best for your business.
What Are the Best KPI Tools to Stay on Top of Your Business?
Here's a quick glimpse of the tools we will walk you through and their dedicated features and pricing. Let's find you the best deal.
#1. Datapad
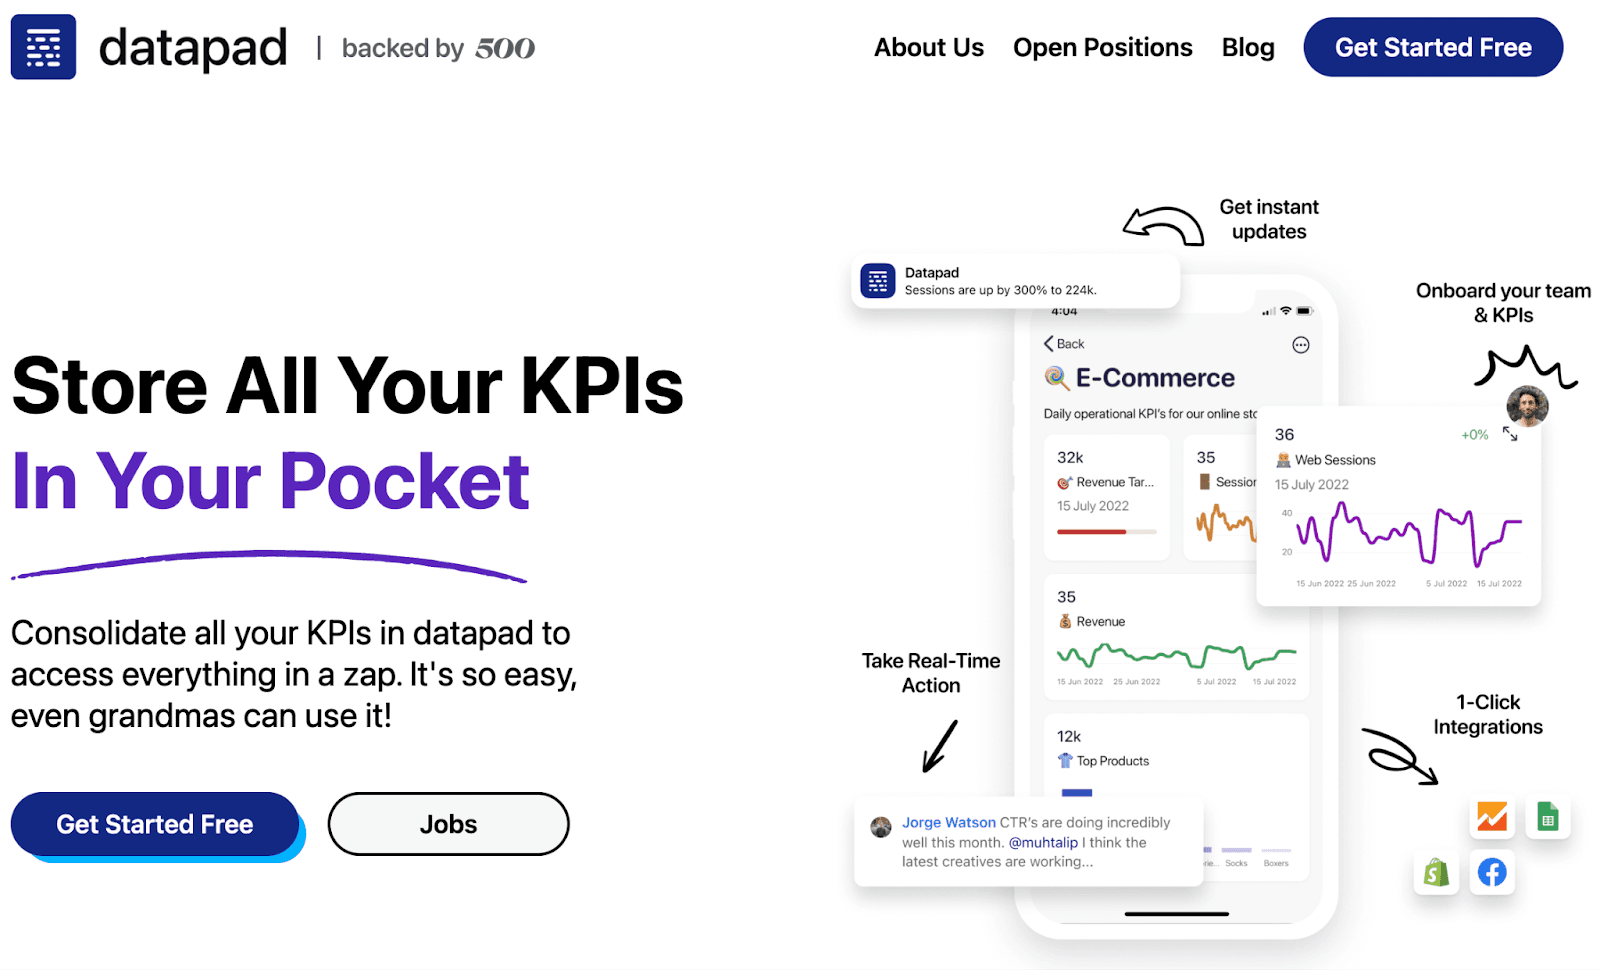
Datapad is an all-in-one KPI tracking and a dashboarding tool built for anyone who loves working on their mobile phones. We say that because Datapad is seamlessly optimized for mobile devices - no lags & no delays.
Datapad has aced the compatibility test with all known mobile devices and comes along with a user-friendly interface.
Due to its lower-learning curve, it serves your purposes readily, without requiring you or your team to learn any technical jargon.
Besides being an easy-to-use tool, Datapad has a lot more to offer.
Key Features
#1. Automatic or Manual Data Upload
Data being the foremost ingredient for your dashboard is also the #1 priority for teams. Therefore, importing tons of data to your dashboard should be an error-free process.
Unfortunately, importing tens and thousands of data from multiple data sources isn't what every KPI tool can perform flawlessly. Some tools lack key integrations, while others lack automation.
But Datapad has the upper hand in both cases.
It allows you to import data automatically via one-click integrations and manually.
If you want to import data quickly, you can use our one-click integrations with popular data sources like Google Sheets, Facebook, Google Analytics, and many more to import data and create stunning dashboards in a few minutes.
Here's how you can easily set your data import process on auto-pilot:
-
Simply press the '+' sign you see at the bottom of the screen
-
Go to Use a Data Source option
-
And you will see all the data sources to import your data from

To do the process manually, simply click on 'Enter Manually,' and then you're in control of your data.

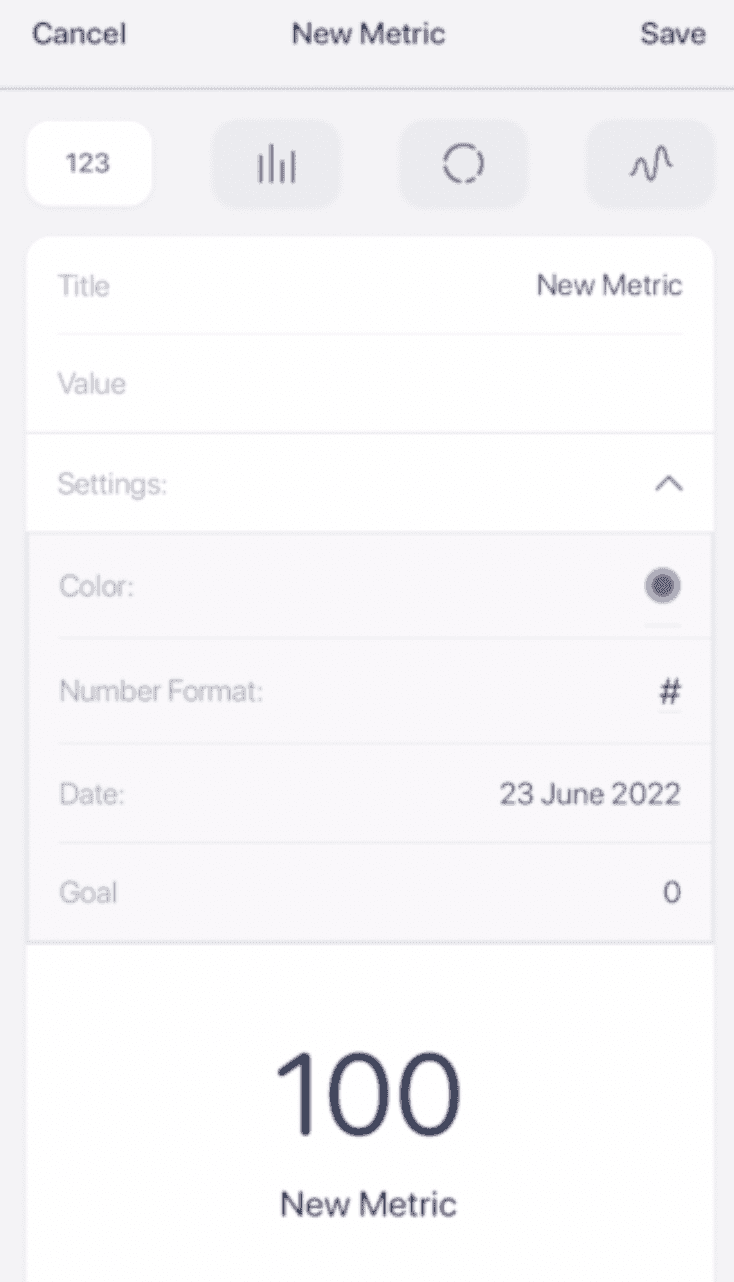
#2. Limitless Customizations
Despite being an affordable solution to your problems, our tool doesn't compromise any key feature expected from an excellent KPI tool.
Datapad allows you to customize every section of your KPI dashboard. From text to colors and graphs to KPI cards, you can move, edit, or replace every section of your dashboard to your comfort.
#3. Real-Time Access to Key Performance Indicators in Your Pocket
Our app, being mobile-friendly, helps you track KPIs on the go.
Suppose you're on a hike, and suddenly your team starts bombarding messages as a crucial KPI is showing volatile behavior or underperforming.
Confused? Stressed? But what can you do in the middle of nowhere?
Datapad fits right into these critical situations. All you need is a stable internet connection and our Datapad mobile app (available for iOS and Android) to view, edit, and comment on your KPIs in real-time.
With Datapad mobile-friendly tool, you can:
-
Assign tasks to team leads and monitor progress in real-time
-
Track your KPIs from anywhere
-
Get notified when there's a change in your KPIs
-
Communicate with teams by commenting under KPIs
-
Take quick data-driven decisions and prevent mishaps
What’s more, our app is designed for shear brilliance - no lags, glitches, and bugs. Plus, it's compatible with all small screens and devices, so you and your team are always on the same page.
Pricing
Being in its beta phase, Datapad is a free-to-use mobile app. You can start using it for free from here
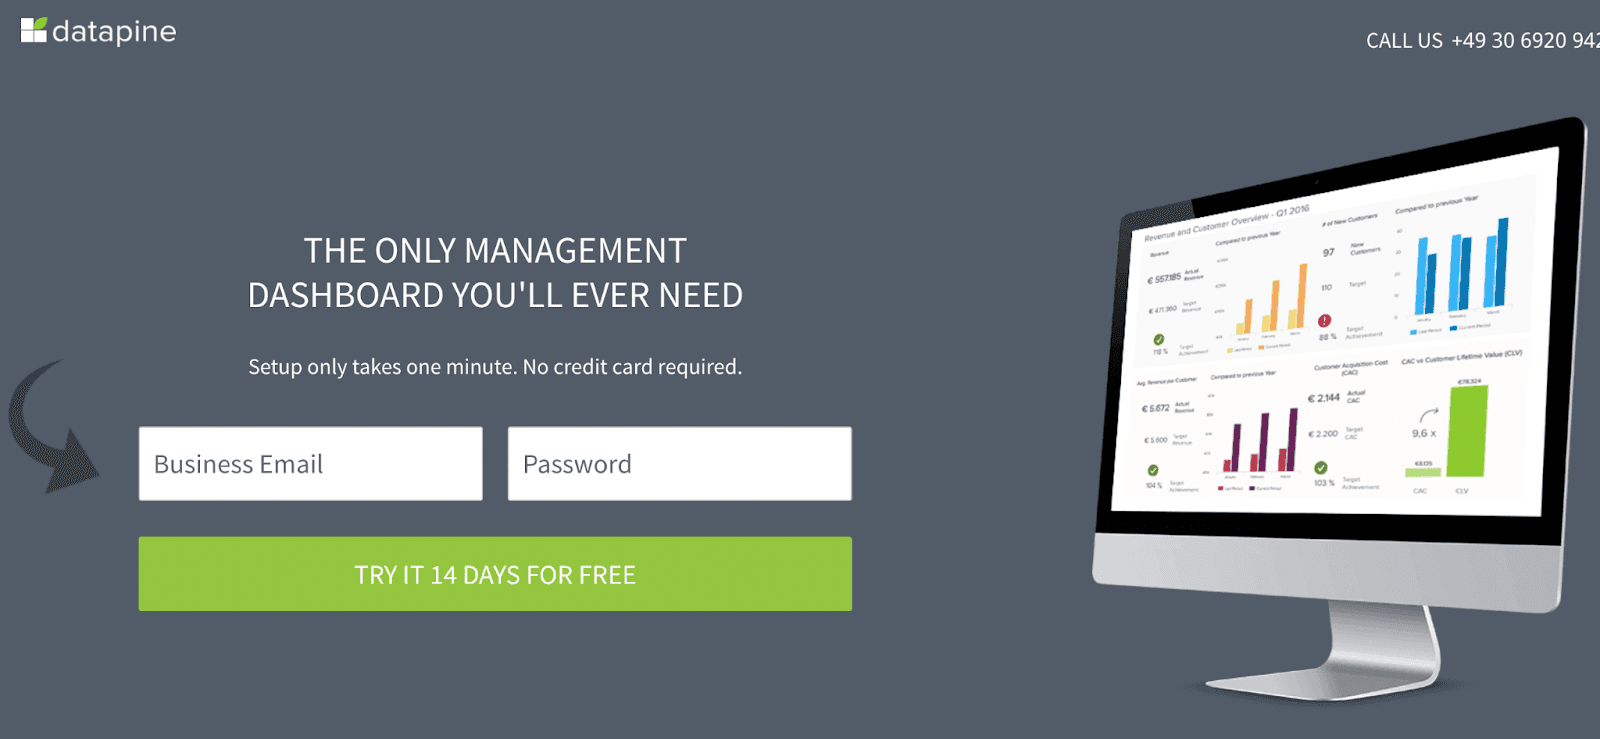
#2. Datapine
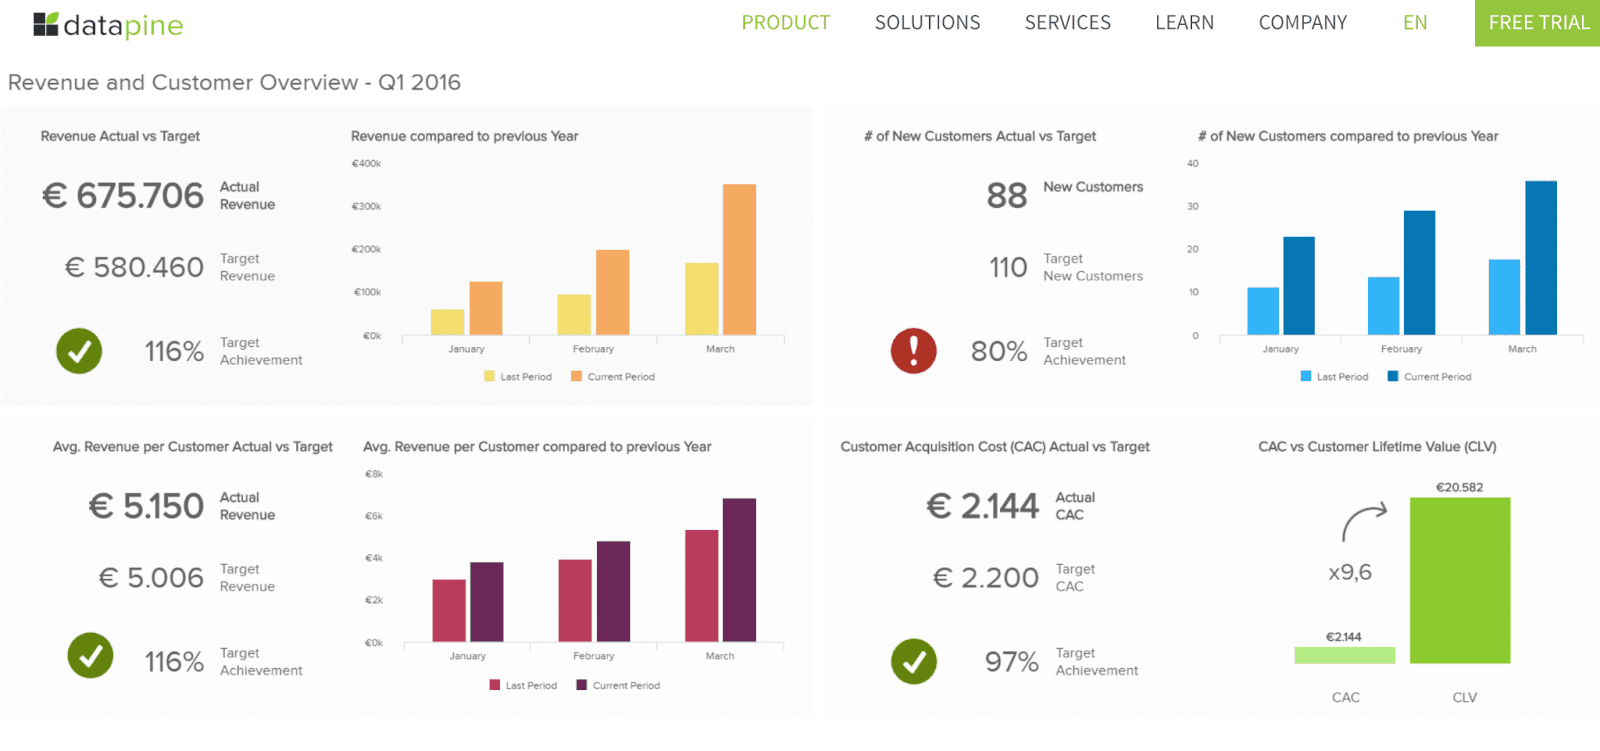
Datapine is a BI and dashboarding platform that empowers businesses to easily store, visualize, and share their data via interactive dashboards.
Its robust analytics enables data-driven leaders and organizations to make excellent decisions anywhere and anytime.
Who Is It For?
Datapine is for everyone, from managers to scientists and non-technical users to advanced coders. It has both basic and advanced features to support any use case.
Features
-
50+ native data integrations to almost any database, flat file, ERP/CRM, web analytics, social media, and many more
-
Has a comprehensive self-service BI facilitating drag-and-drop interface for basic or advanced level visualizations - no coding required
-
80+ pre-built business dashboard templates and over 25 different charts and tables to quickly build a dashboard
-
Has built-in predictive analytics tools and forecast features to pre-determine the possible developments in the future
-
Enjoy real-time data monitoring and get alerted via notification when a KPI crosses a set threshold
-
Easily build cross-database queries; switch to SQL mode to write custom queries (designed for tech advanced analytics)
Pricing
Datapine offers a 14-day free trial, after which it's chargeable. However, Datapine has not provided any pricing for this product or service on its official website. You can contact Datapine to obtain the current pricing.
#3. SimpleKPI
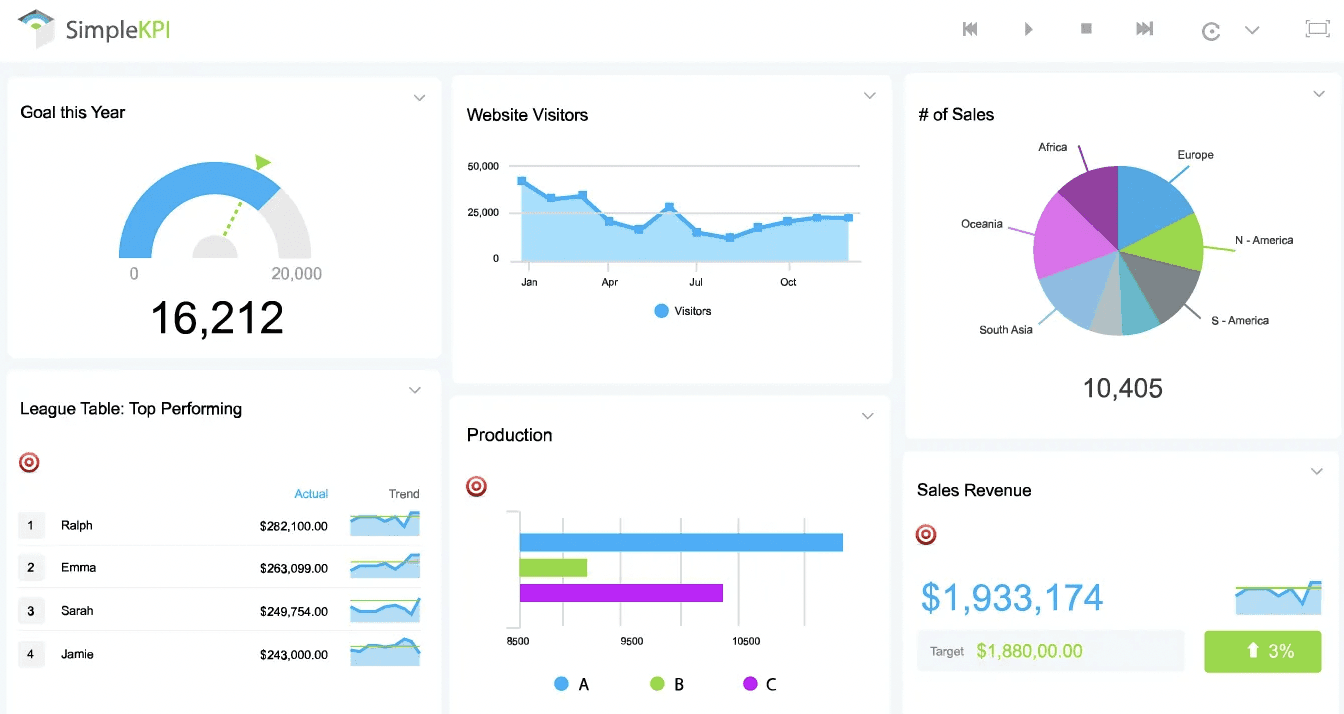
SimpleKPI is an online KPI software solution that allows businesses to create, manage, and monitor all KPIs with the help of beautifully simplified dashboards.
The software is easy to set up, simple to use, and affordable for all types of businesses.
Who Is It For?
Over 1000 companies of all sizes trust SimpleKPIs services. It’s best for businesses who quickly want to onboard their teams and start monitoring KPIs hassle-free.
It also has a lower-learning curve, making it popular among non-technical firms and teams.
Features
-
Easy to use management tool with real-time monitoring of KPIs, individuals, and teams with stunning data visualization
-
Offers highly customizable dashboards with an extensive gallery of charts, tables, and widgets for quick and easy visualization
-
Get comprehensive reports on overall performance; easily export reports in multiple formats such as PDF, Word, or Excel
-
Use the drill-down and up feature to discover insights at all levels and avoid guesswork to make better data-driven decisions
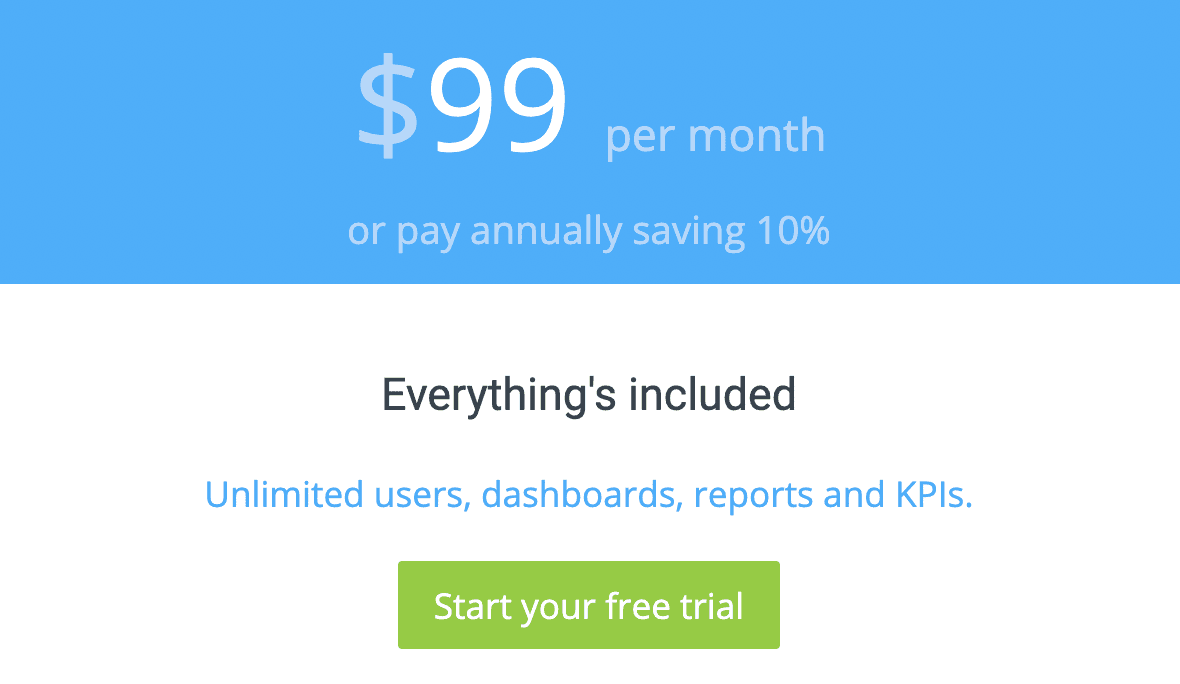
Pricing
SimpleKPI offers a free 14-day risk-free trial. Apart from this, the platform has fixed pricing at $99/month, or you can save 10% on the overall price if billed annually.
#4. Geckoboard

Geckoboard is a KPI dashboarding tool that helps you design professional business dashboards within minutes. Its robust APIs and stunning data visualization are bliss for 1000s of data-driven organizations.
Who Is It For?
Geckoboard is best suited for lean startups, teams, and individuals.
Features
-
Has pre-built integrations to 80+ data sources to connect and import data easily; pull in additional data via spreadsheets, Zapier, and custom APIs - no coding required
-
Use advanced filtering option to select custom ranges for visualization and combine multiple business metrics to create custom formulas and discover hidden insights
-
Instantly access KPIs by adding Geckoboard to your mobile home screens (compatible with iOS and Android)
-
Schedule and send dashboard snapshots via emails or Slack; generate smart links to share live dashboards instantly
-
Take control of when, how, and who can access your dashboards by enabling granular user-management
-
Use the share-to-TV feature to present your dashboard hassle-free on giant TV screens around conferences and meetings
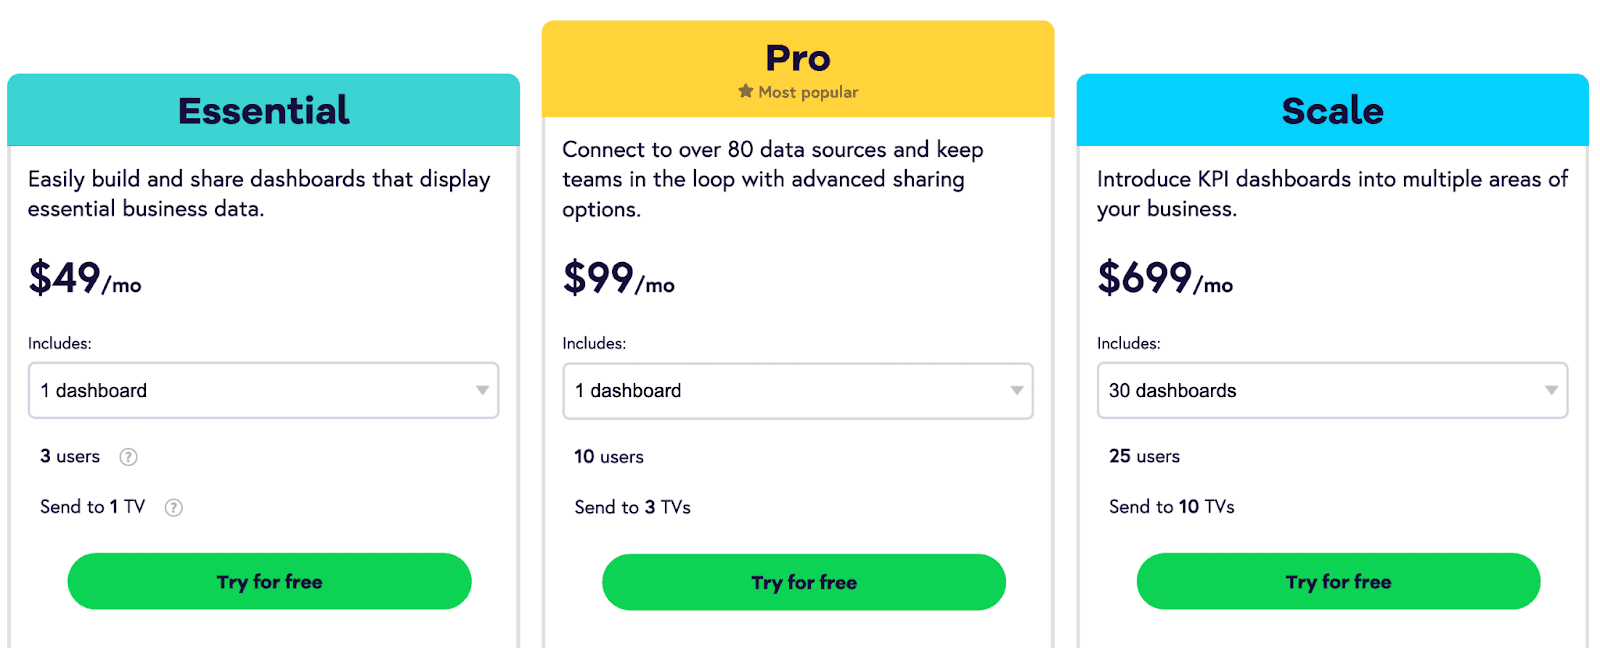
Pricing
Apart from the free plan that allows you to create a single spreadsheet-powered dashboard, Geckobaord offers three premium plans.
-
Essential: $49/month
-
Pro: $99/month
-
Scale: $699/month
#5. Sisense
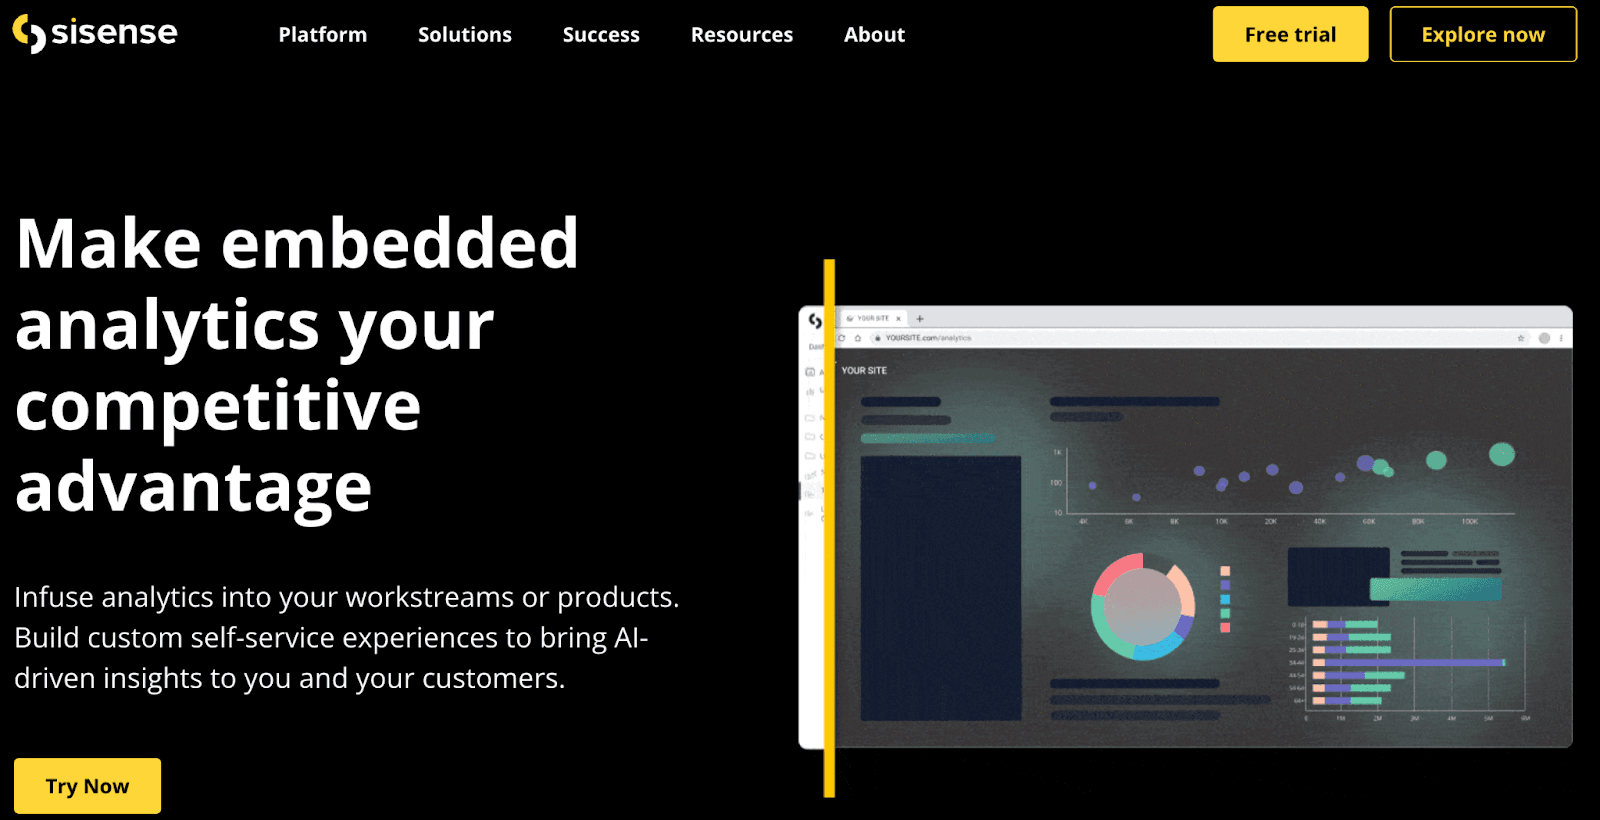
Sisense is the leading BI and cloud analytics platform that allows businesses to infuse analytics at every step of their business operations. Its custom self-service experience and AI-driven approach makes it easy to use in both data modeling and dashboard design aspects.
Who Is It For?
Sisense is an excellent tool for organizations that need simple and quick data analysis. The tool best suits the healthcare, retail, manufacturing, tech, financial services, pharma, and life sciences industries.
Features
-
Over 100+ data connectors to ensure you get the most out of your data; flexible data engine that empowers data accessibility via live connection, elastic cache, or hybrid approach
-
Has embedded advanced data pipeline to quickly ingest, prepare, transform, visualize and augment complex data using cloud data warehouse
-
Use its AI-assisted data preparation to automatically prepare, unify, and model data for analysis
-
Easy-to-use drag and drop customizations, in-built smart calculations, and charting options to create custom dashboards and stunning data visualization
-
Leverage predictive analysis and AI-driven exploration paths to discover hidden insights and swing across KPIs independently
-
Easily embed dashboards and analytics with iFrame HTML page or pre-built SDKs
Pricing
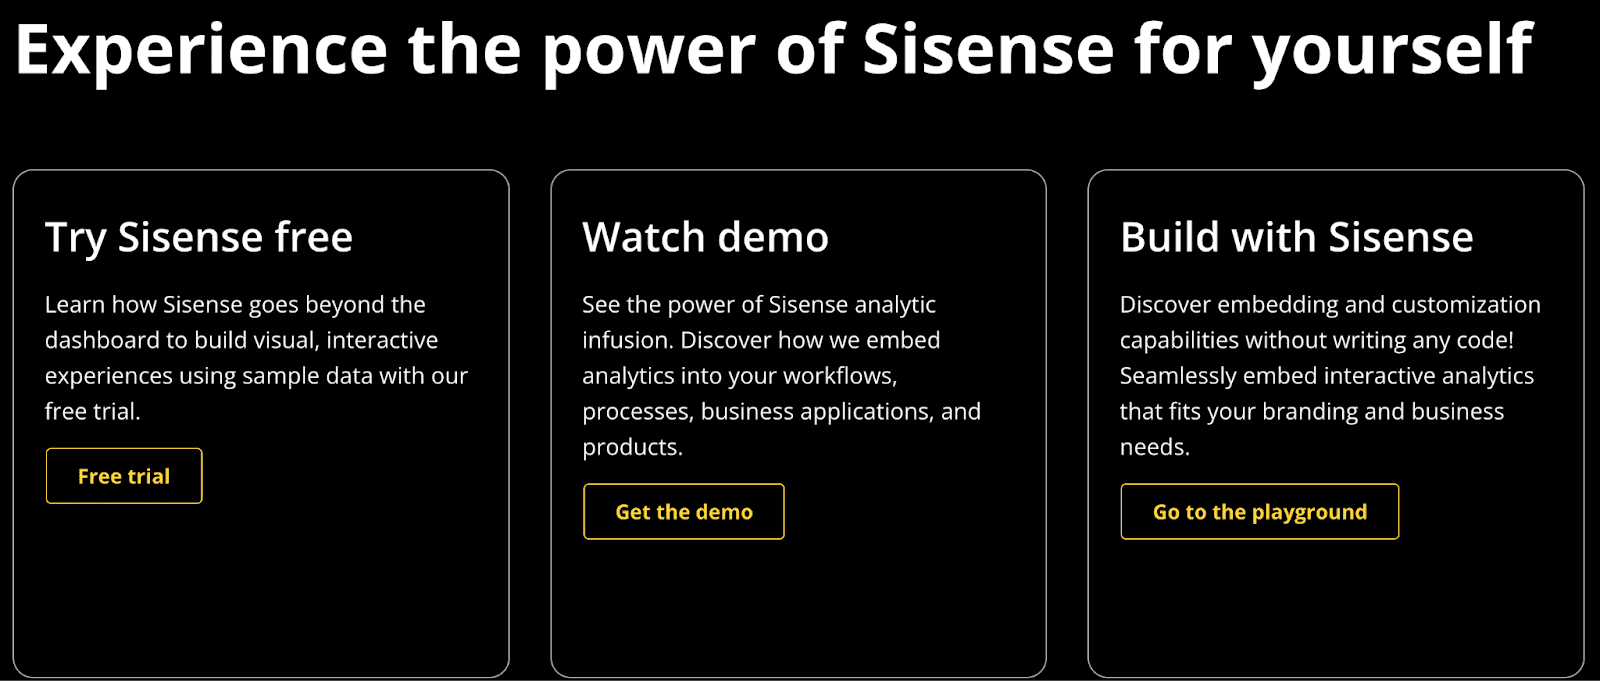
Sisense offers a fully functional free trial for new users. Besides this, it has a custom pricing model. You can connect with Sisense's sales rep to get yourself the best deal.
#6. DashThis
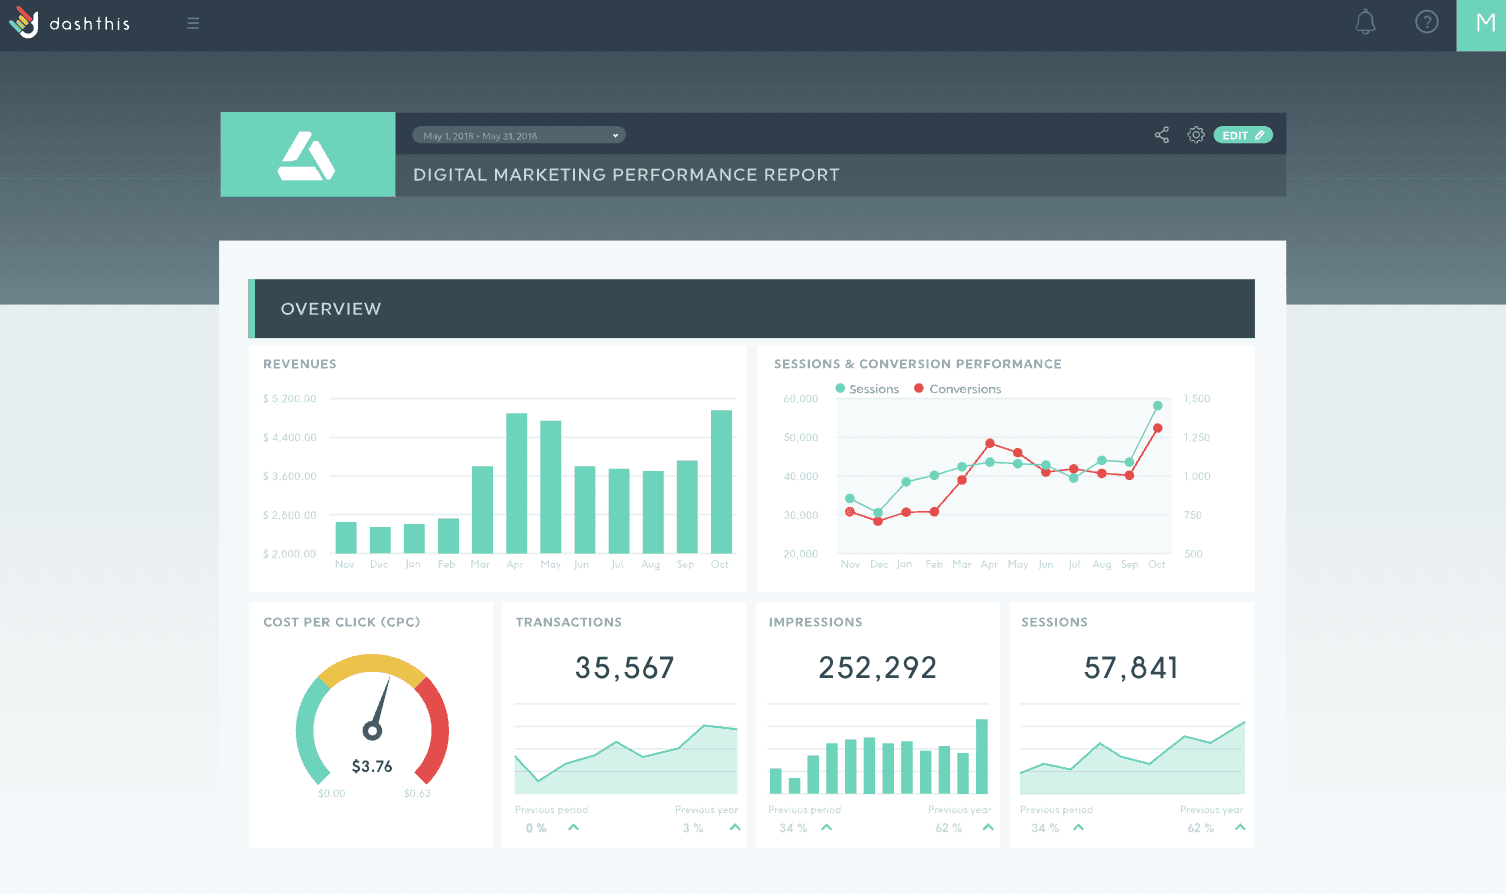
DashThis is an automated marketing reporting tool that can save hours of work and create beautifully customized reports in a blink of an eye.
Trusted by the likes of the University of Oxford and KTM for generating online marketing reports, DashThis is one of the widely used reporting solutions among digital marketers and agencies.
Who Is It For?
DashThis is a perfect tool for a freelancer because it's a mountainous task to manage a large array of data in the beginning. However, the tool is also a right fit if you run a marketing agency.
Features
-
More than 34 integrations like Facebook, Google Ads, and Twitter lets you gather all your KPIs into a single customizable report
-
Wide range of preset customizable report templates and cloning options save time and speed up reporting
-
Lets you share work easily by automating the distribution with automatic email dispatches or via direct URL
-
Variety of color themes and customizable widgets gives a more personalized and artistic look to reports
-
100% data security and dashboard password protection ensure complete privacy of data
Pricing
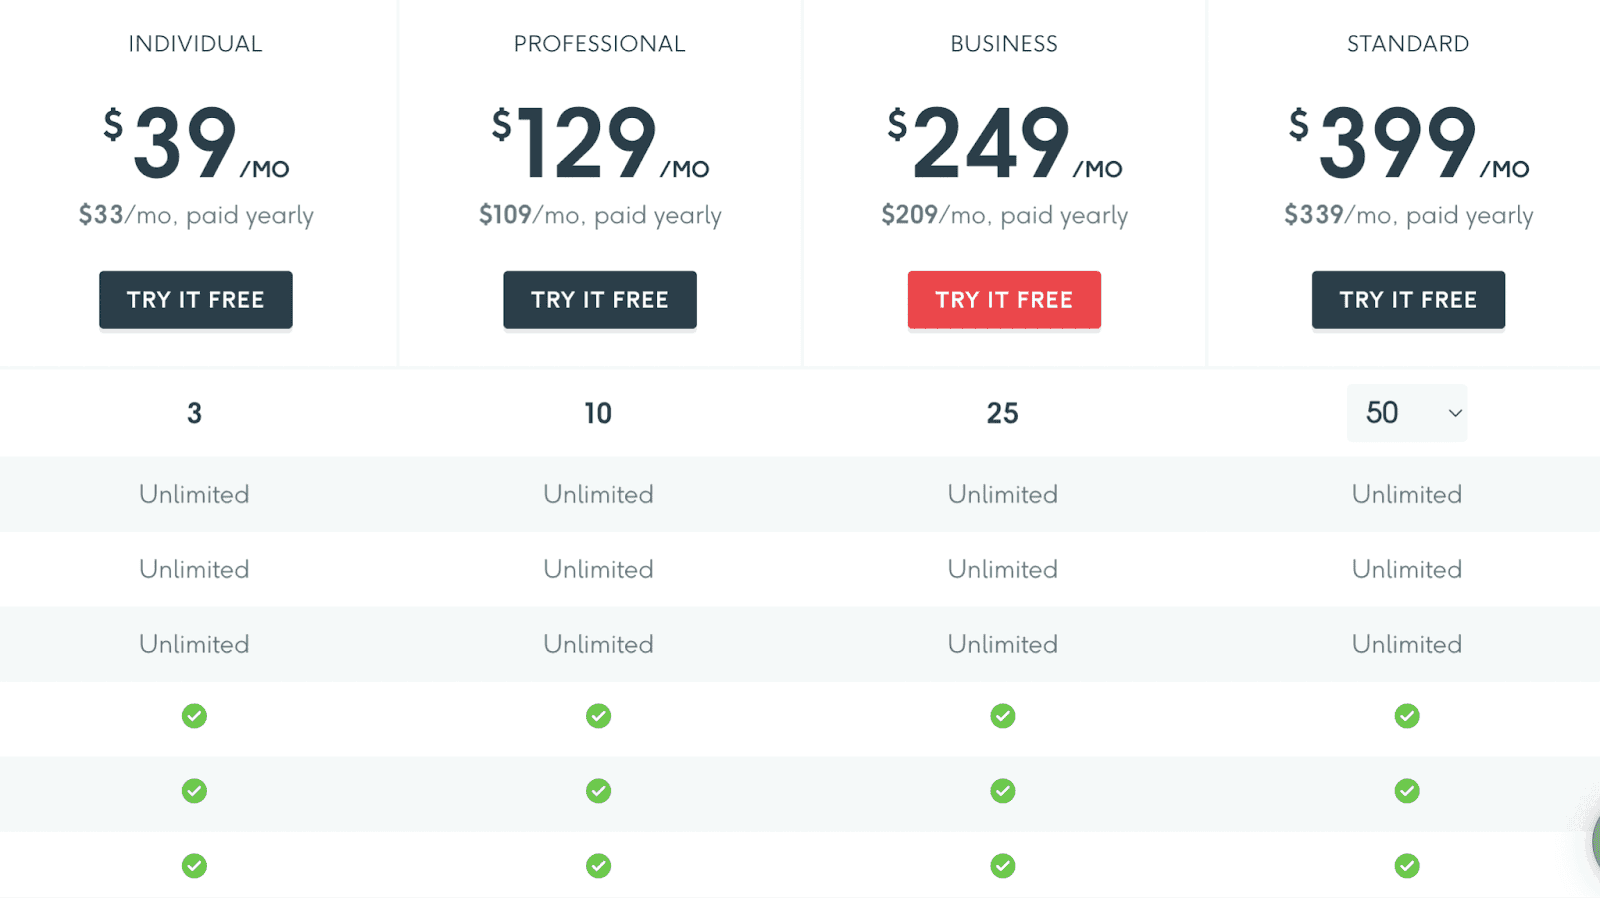
DashThis offers a 15-day free trial where you can build a maximum of 10 dashboards. However, if you want more dashboards and premium features, DashThis offers 4 different plans:
-
Individual: $39/month
-
Professional: $129/month
-
Business: $249/month
-
Standard: $399/month
#7. Domo
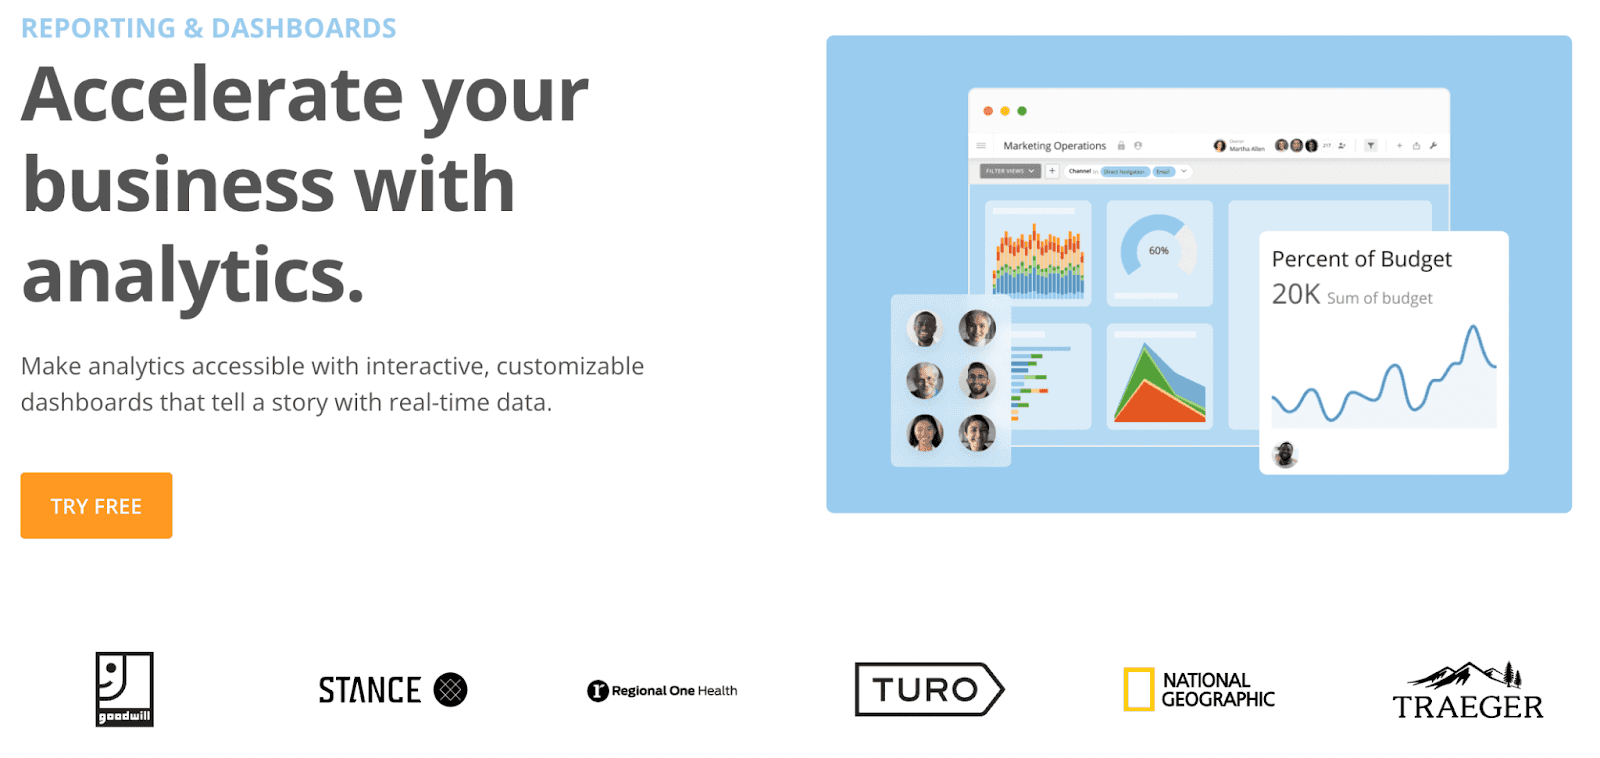
Domo is a powerful no-code KPI tracking tool that connects and transforms your data into dashboards to streamline your workflow. It empowers everyone in the organization to derive data insights that improve their productivity and decision-making ability.
Who Is It For?
Domo extends the power of data not only to data experts but also to a novice. That’s why it’s been widely used across many industries to level up decision-making by transforming the data into valuable assets.
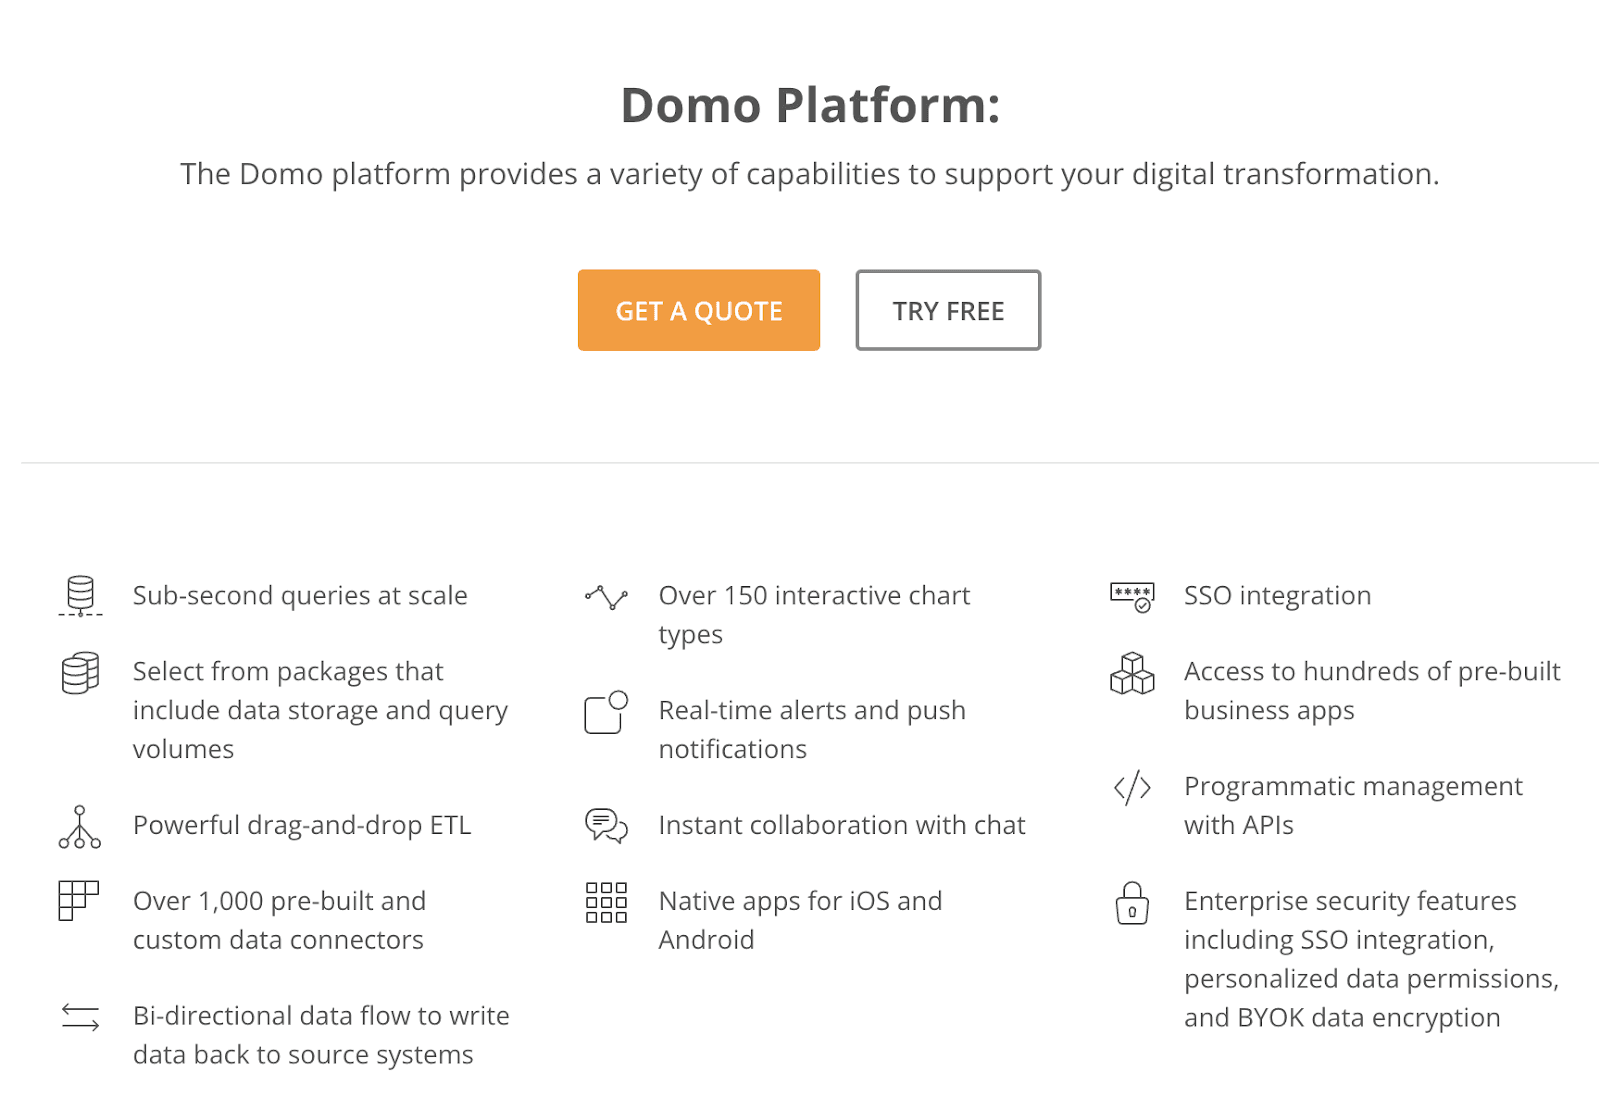
Features
-
Has a large array of pre-built data connectors that activates data integrations in no time
-
Domo’s proprietary visualization engine supports more than 150 chart types for effective data visualization
-
Interactive charts and dashboards let you analyze every granule of the data to provide deeper insights
-
Ensures full data governance at scale with unlimited personalized data permissions
Pricing
Domo offers customized pricing plans that address specific requirements for your digital transformation. You need to contact the sales and marketing team for a personalized quote to get the details. In addition, it also provides a free trial to give you a demo of all the features Domo has.
#8. Whatagraph
Whatagraph is an automated reporting tool for marketing agencies that collect, show, and share your marketing data with clients and managers in no time.
It provides a unique way to transform your data from multiple channels into insightful reports that help achieve business objectives.
Who Is It For?
Whatagraph is a great tool with versatile features for every marketer and marketing agency to remain on top of their work. The platform's a complex reporting software for large enterprises.
Features
-
Make result-based decisions by collecting and monitoring the performance of multi-channel campaigns on one platform
-
The report automation feature allows you to send marketing reports at a selected frequency
-
Allows data import from multiple resources to report by connecting it to Google sheets and Public API
-
White labeling features enable you to tailor marketing reports as per the client's brand colors
-
Enables you to build error-free performance reports with its changeable ready-to-go templates
Pricing
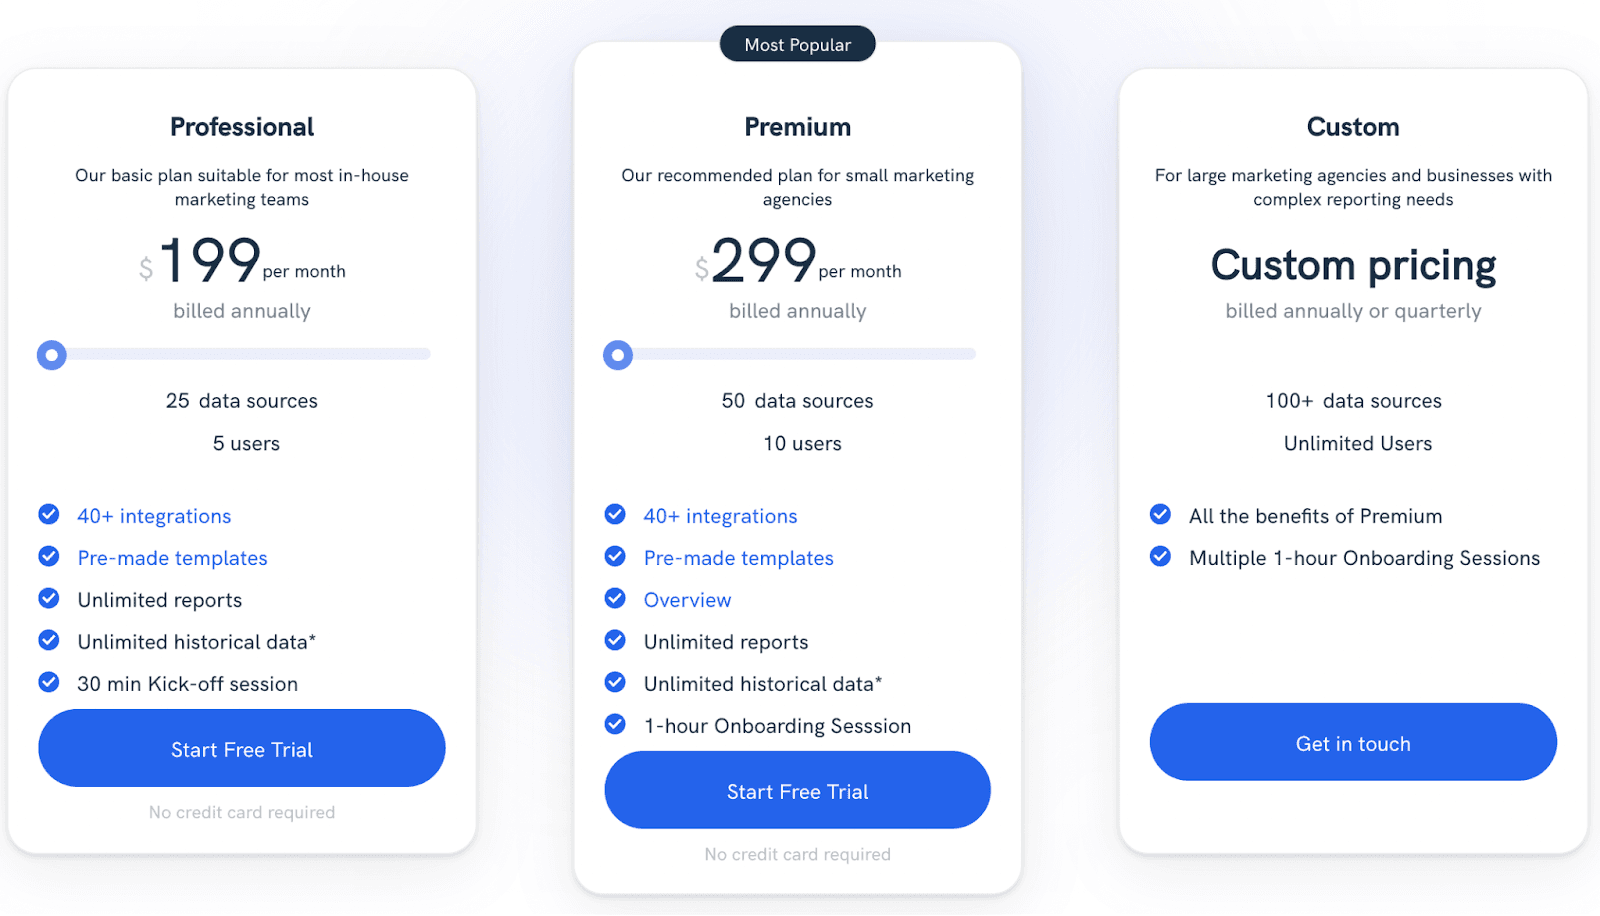
No matter if an apparel store's business owner or own a marketing agency, you can choose from one of these plans tailored to your needs:
-
Professional: $199/month
-
Premium: $299/month
-
Custom: Contact Whatagraph for customized plans
#9. Grow

Grow is a no-code business intelligence dashboard software that connects data, explores it, and provides valuable insights to make strategic decisions. Hundreds of 5-star reviews by some recognized organizations make Grow the ultimate KPI tool for your business.
Who Is It For?
It doesn't matter what business you're in; Grow provides simple yet powerful solutions so that you can leverage insights to optimize your growth.
Features
-
Helps in making better business decisions by transforming the imported data from commonly used platforms and databases to stunning dashboards
-
Data storage in a single place provides an opportunity to draw transformative insights from your data
-
Provides easier data navigation via charts and graphs to drive better business decisions
-
Enables you to make informed decisions by sharing insights with your team
-
Offers white label customization options to send personalized reports to clients
Pricing
To get started with Grow, you need to submit your details on the website and ask for a free trial.

#10. Tableau
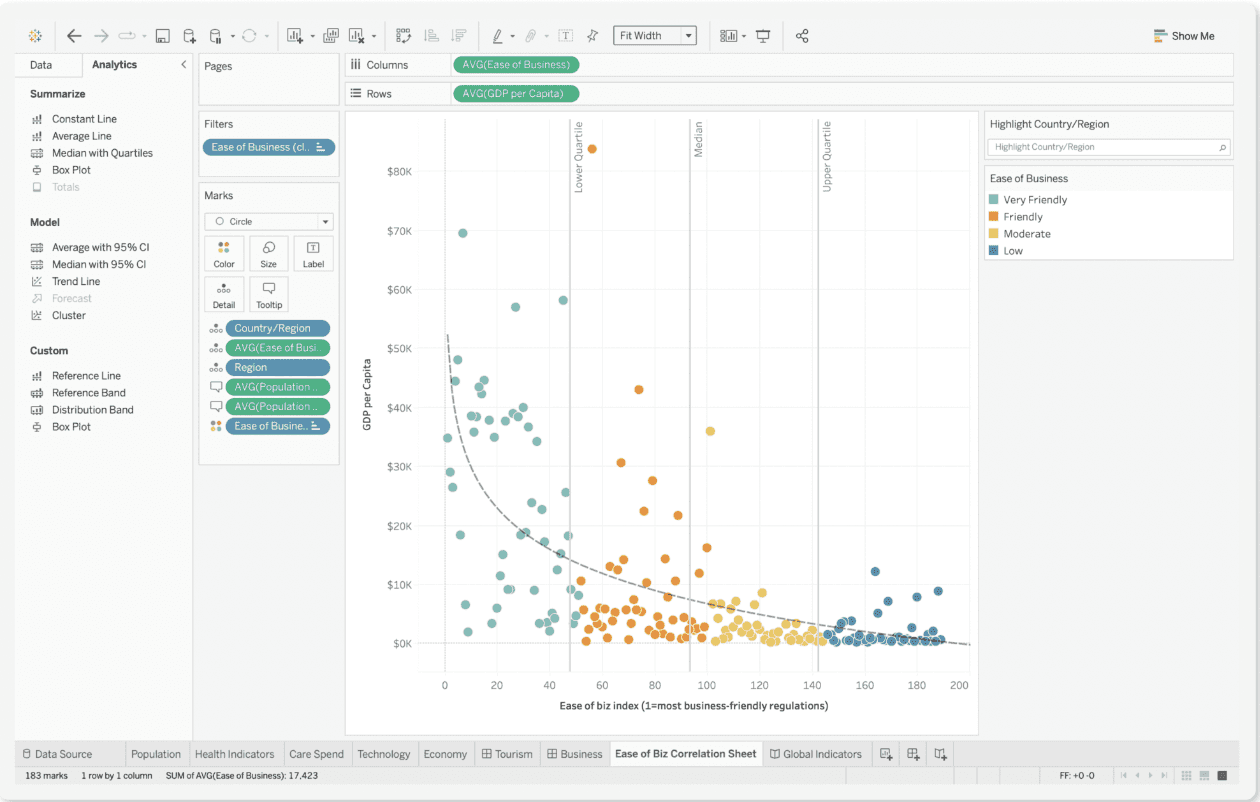
Tableau is a leading analytics platform that helps organizations and people become more data-driven to improve their decision-making ability.
It empowers people and organizations with powerful visual analytics that drive faster and more accurate business decisions.
Who Is It For?
Whether you work in IT, marketing, or HR, Tableau helps build data-driven strategies for your business. Organizations around the globe use Tableau to deepen business insights quickly.
Features
-
Tableau Clouds, a fully hosted self-service platform, enables you to make confident business decisions from anywhere by streamlining the power of data
-
Tableau Desktop allows you to make impactful business decisions with live visual analytics
-
Tableau Server enables risk-free data exploration in a trusted environment
-
Tableau Prep Builder lets you analyze data fast by reducing the time spent on data interpretation to 60%
-
Tableau Data Management boosts confident data analysis by promoting the right data in a governed environment
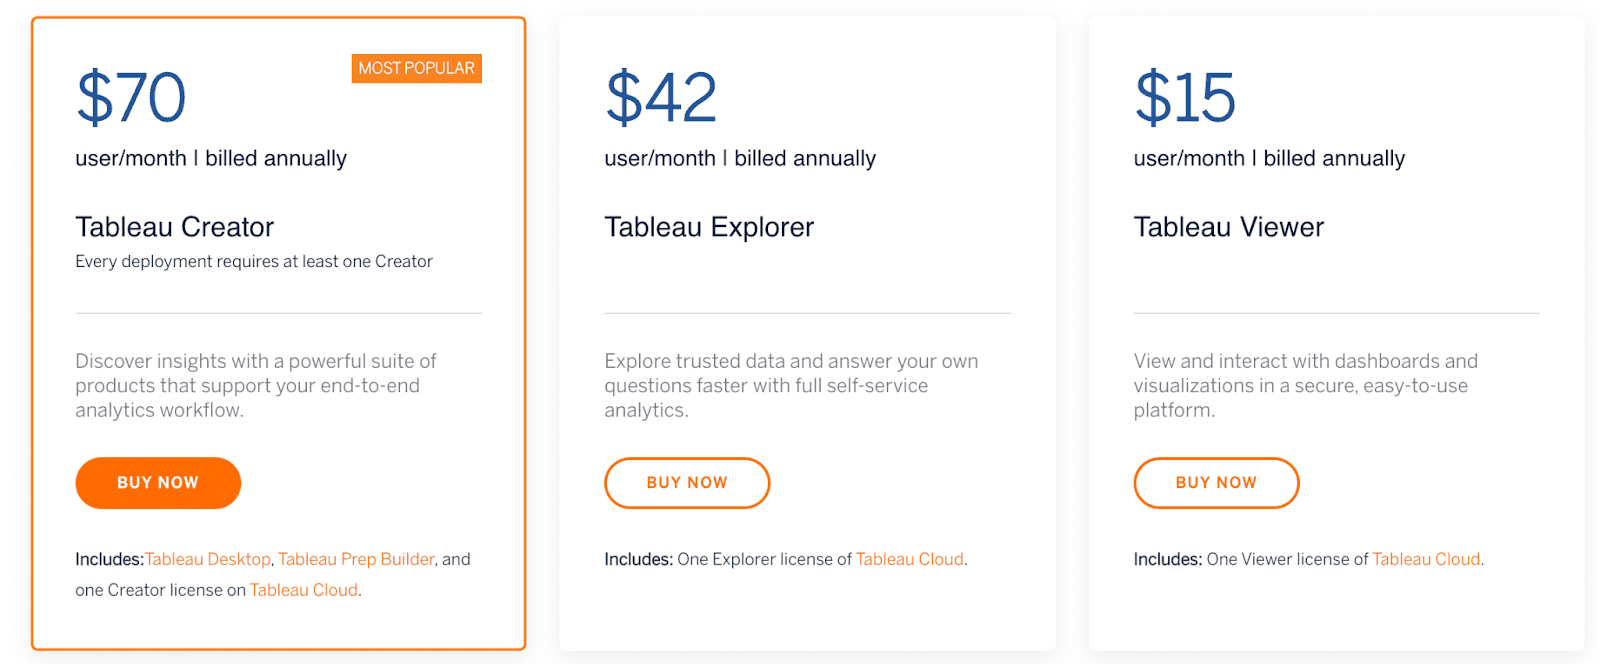
Pricing
Much like its features, Tableau provides various pricing plans for people and organizations with different data needs:
-
Tableau Viewer: $15/month
-
Tableau Explorer: $42/month
-
Tableau Creator: $70/month
#11. Databox
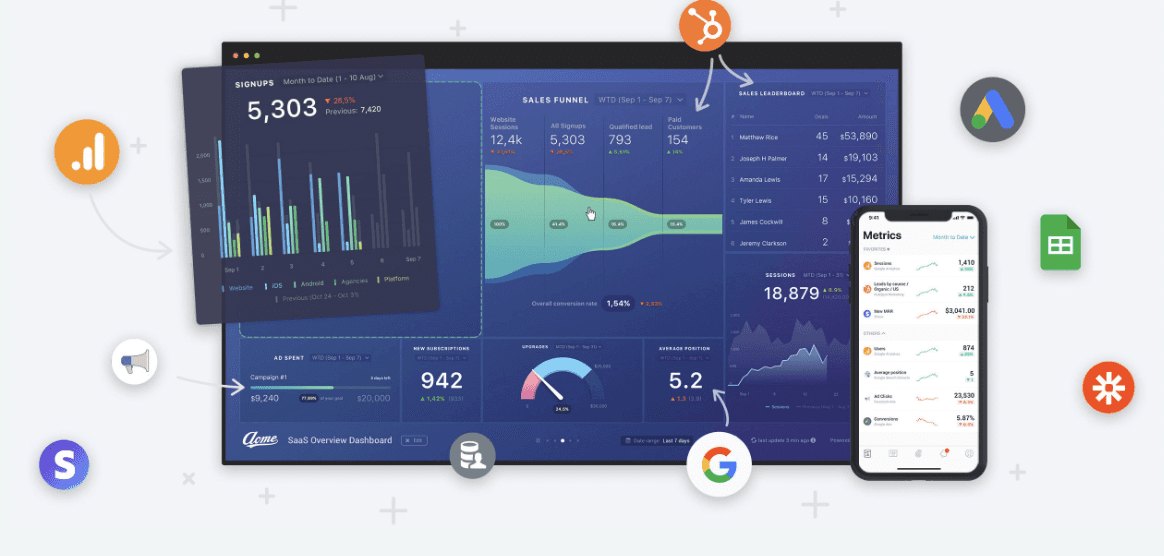
Databox is a business analytics platform that makes cross-channel performance tracking insanely easy. With this, you don’t have to log into different tools anymore.
You and your team can use Databox to simply connect your data from various tools to track thousands of KPIs and achieve all your business goals in no time.
Who Is It For?
Whether you’re a marketing agency or a solopreneur, when it comes to filtering data for making informed business decisions, Databox provides an extra pair of hands.
Features
-
Improves performance with 70+ dashboard integrations that lets you track thousand of KPIs from a single place in minutes
-
Easy access to dashboard building with more than 300 ready-to-use dashboard templates
-
Enables you to track the performance of your team by Smart KPI scorecards and goal alerts via mobile apps and TV dashboards
-
KPI alerts sent via email and push notifications enable proactive tracking of the company's performance
-
The Agency feature allows you to focus more on strategies and execution by automating client reporting
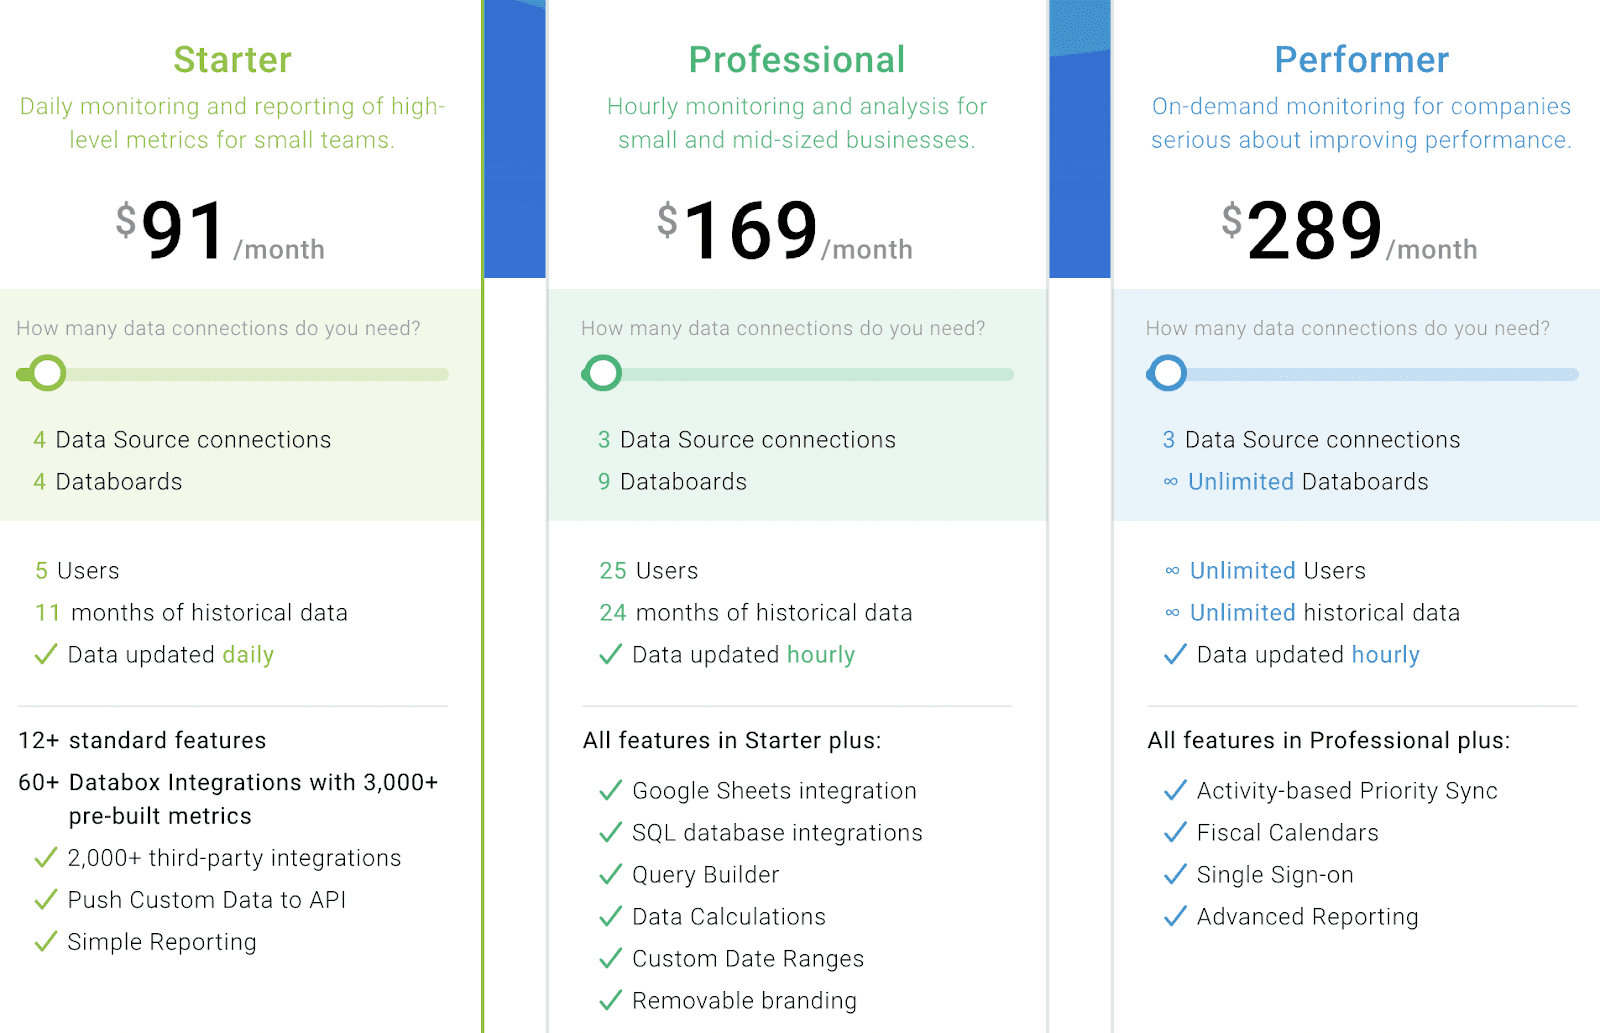
Pricing
Databox offers both free and paid plans. You can create a free forever plan and start tracking your KPIs with more than 60 integrations (limited to 3 data source connections).
However, if you want more, you can choose from its 3 paid plans:
-
Starter: $91/month
-
Professional: $169/month
-
Performer: $289/month
#12. Klipfolio
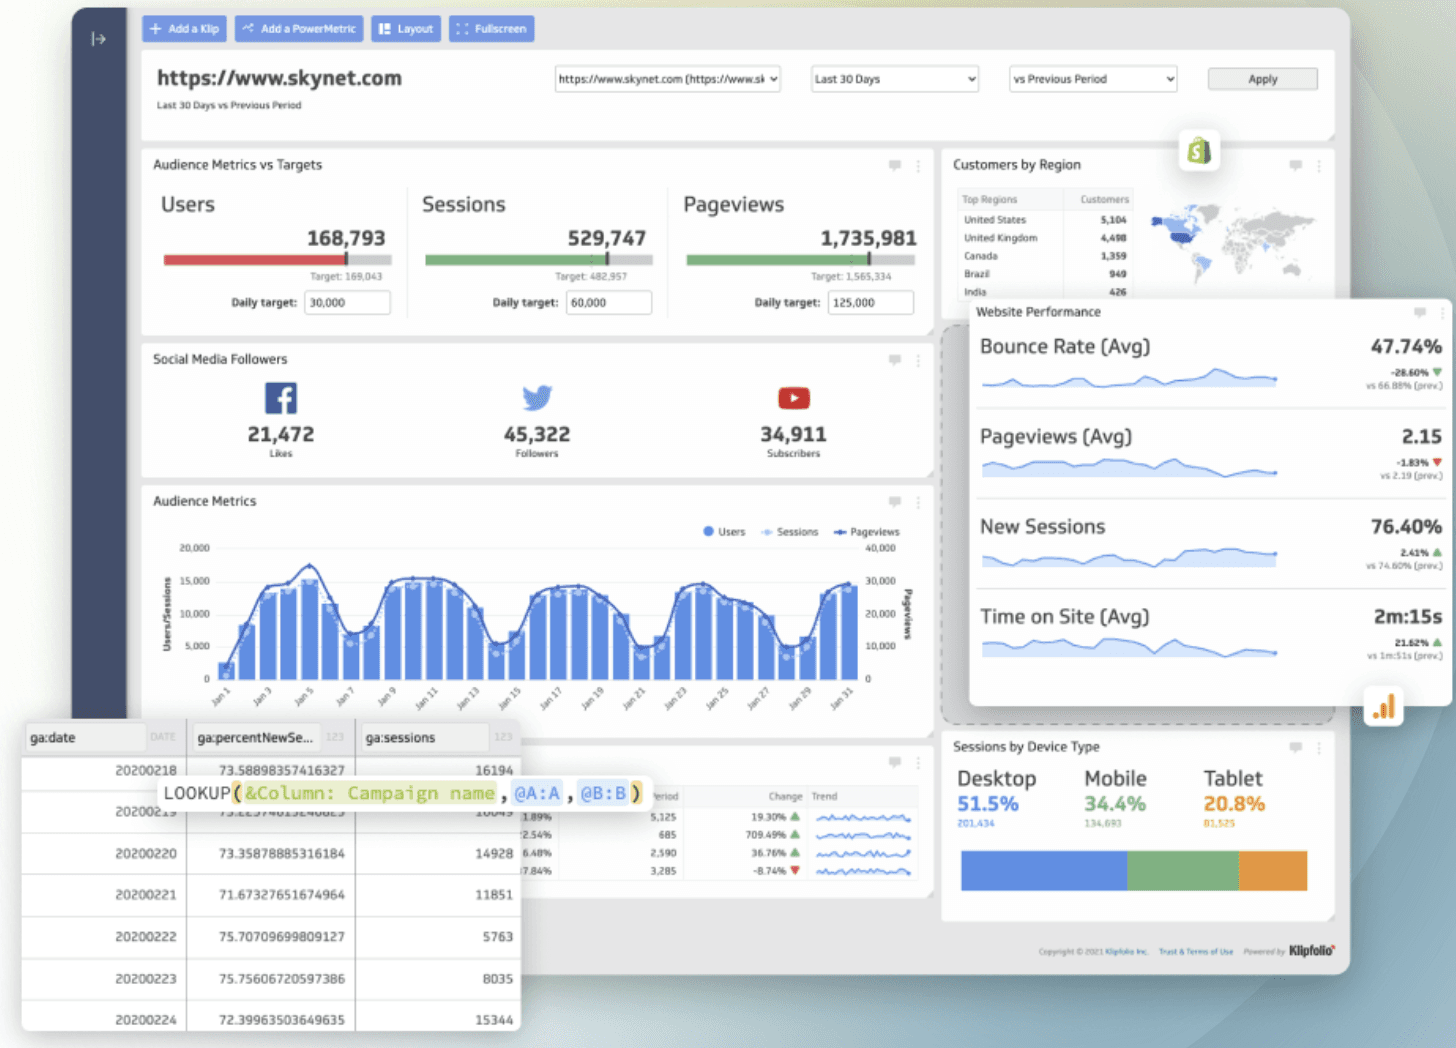
Klipfolio enables KPI tracking with its powerful business analytics tool that empowers you and your team to achieve the set strategic goals. It has helped more than 50,000 leaders provide data insights to drive their success.
Who Is It For?
Klipfolio is used across many major industries and departments as data insights are paramount to driving powerful business decisions. For example, airlines, e-commerce, marketing, and the list goes on.
Features
-
The power metrics feature lets you easily analyze data from different sources and import it easily
-
Customizable dashboards let your team build customized reports to share and track data
-
Provides different data connectors that let you connect your data in a secure manner
-
Allows real-time display of reports via PDFs; you can also schedule emails and send across the reports
-
The data modeler feature helps you modify complex file formats into simple tabular data forms
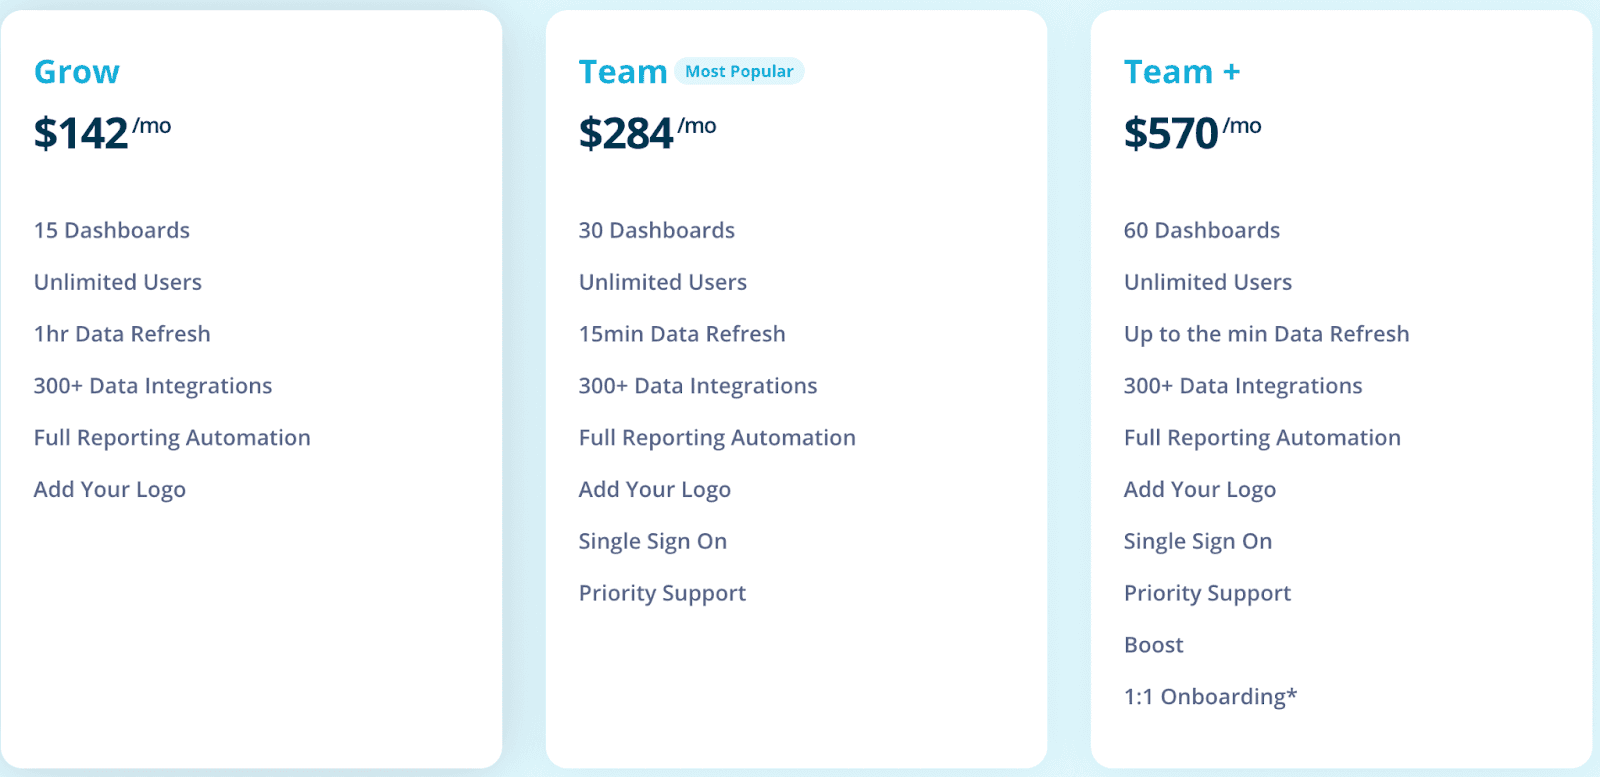
Pricing
When in doubt, you can go for Klipfolio's free trial, which provides unlimited access to the platform for 14 days. Other than that, it has three plans to choose from:
-
Grow: $99/month
-
Team: $199/month
-
Team+: $299/month
Frequently Asked Questions (FAQs)
Q1.What are KPI tools?
KPI tools are desktop or mobile-based software that let you build dashboards, import data from multiple data sources, and track KPIs to get crucial business-related information.
Q2. What are the 5 key business indicators you must track?
-
Total Revenue: Overall income generated by selling your product/service monthly or yearly
-
Net Profit Margin: Measures the effectiveness of your business in generating profit
-
Customer Acquisition Cost (CAC): The amount you spend on acquiring a new customer
-
Customer Lifetime Value (CLV): Estimates how much a customer will contribute to your business
-
Net Promoter Score (NPS): A survey that tells you the overall customer satisfaction
Q3. What are the 5 best KPI tools in 2022?
-
Datapad: Track KPIs on your mobile from anywhere in the world
-
Geckoboard: Cast KPI dashboards on a TV screen to track them better
-
Databox: Create stunning dashboards and import data automatically
-
DashThis: Automate while labeling report process and send across to your clients
-
Klipfolio: Build complete customized dashboards via pre-built templates