![KPI Tracking: What Is It and How Can You Do It The Right Way? [2023]](/_next/image?url=https%3A%2F%2Fframerusercontent.com%2Fimages%2FiFqJOECob8Rbw1usLha6O7NKVA.jpg&w=3840&q=75)
KPI Tracking act as a powerhouse for millions of data-driven leaders and organizations. If you are wondering, what are the best tools and methods to measure your performance indicators, we are here to give you the best method.
There are many methods to track KPIs; you can track them via Google Sheets, Google Analytics, or by using kpi tracker to build dashboards.
From the three methods mentioned above, tracking KPI by building dashboards is the most effective way. But not every dashboarding software is easy to use.
Here are the problems you might face with the vast majority of KPI dashboard software:
-
The learning curve is significantly high, and you might need at least a month to understand what’s what
-
The software has great features, but you’d end up paying a fortune to use it monthly
-
Team onboarding can be tough, or you’d have to pay a higher price for the same
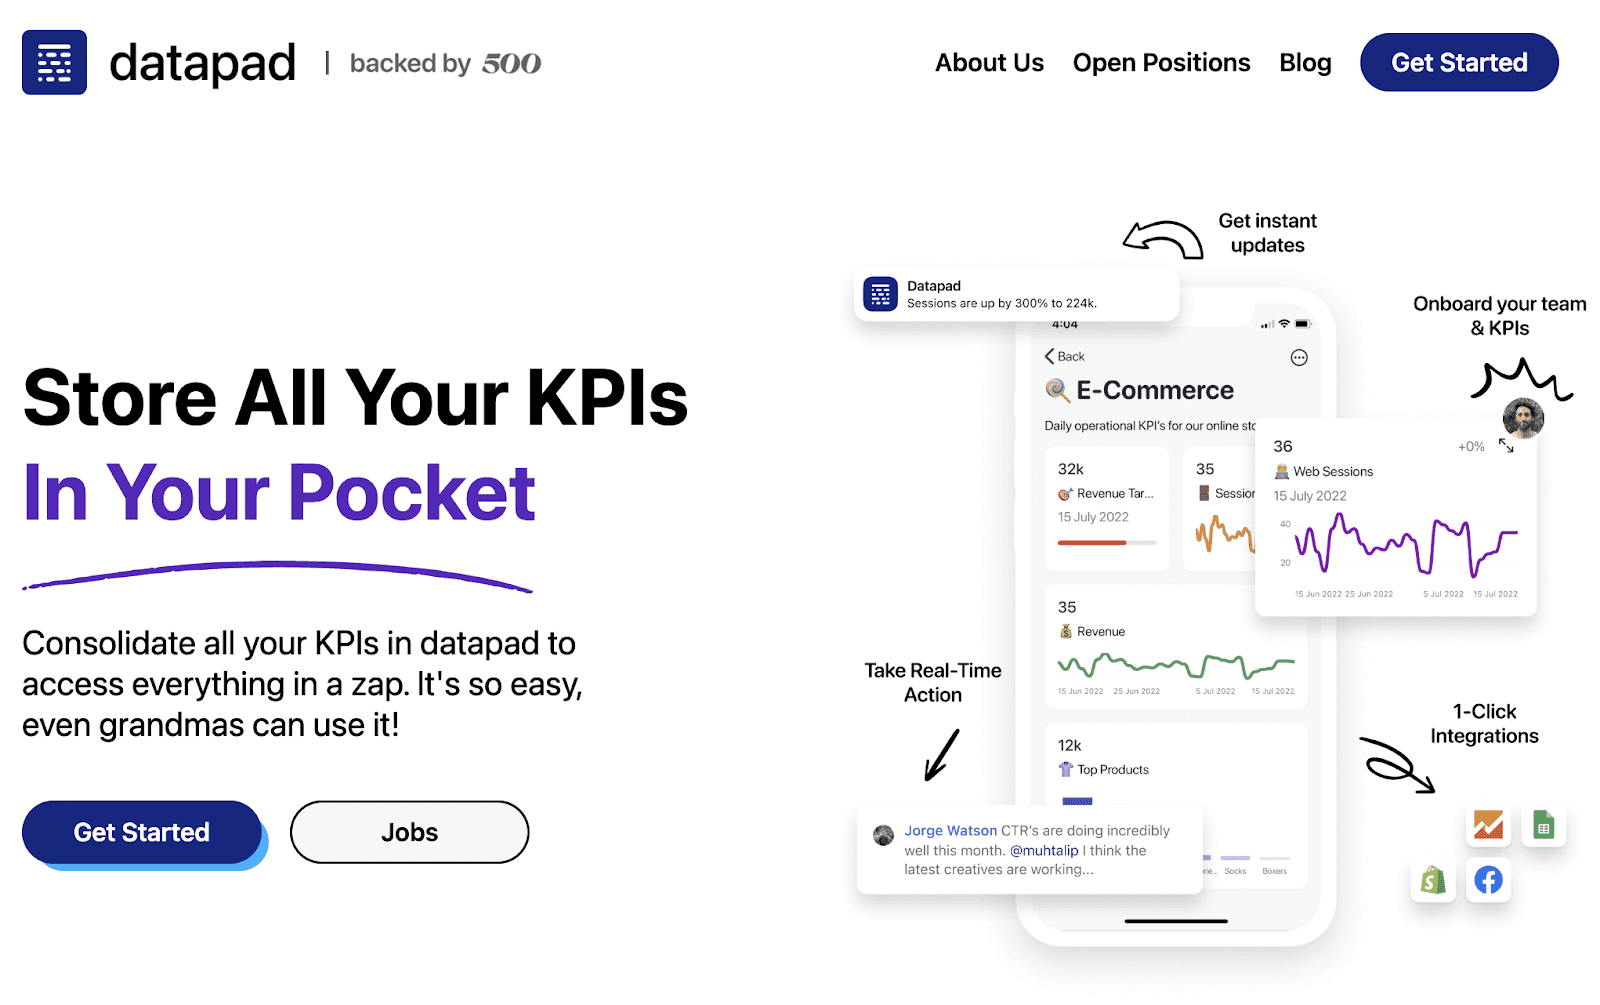
Datapad resolves all these issues as it’s a free-to-use mobile app that lets you build dashboards and track KPIs from anywhere in the world.
Disclaimer: Datapad is a free-to-use, mobile-friendly kpi tracker that lets you create KPI dashboards on your mobile phones and track KPIs on the go. You can bring your team onboard, customize each KPI as per your liking, import data via one-click integrations or manually, and do much more. Fill out the form and see how you can track KPIs with Datapad.
What is KPI Tracking? Why Should You Track KPIs? What Are the Benefits of KPI Tracking? What Are the Key KPIs Every Business Should Be Tracking? How to Set Up A KPI Tracking Dashboard in 5 Steps? Wrapping Up
Successful business leaders must ensure all of their departments in the company succeed financially and operationally. To achieve that, they measure some key elements that demonstrate the effectiveness of a company in achieving its business objectives.
However, there's no specific rule for what KPIs you should track and for how long. These decisions are tied to your company's objectives and goals.
For example, KPIs like annual revenue, net profit, or employee tenure reflect the company's long-term growth. Therefore, you might be willing to track them yearly, just so it becomes easy to compare with historical data and predict future trends.
On the other hand, some KPIs like customer retention rate or conversion rate are preferably tracked every month.
That's because these KPIs yield better insights when compared every month. Thereby allowing you to adjust your strategies in real-time without derailing from your long-term goals.
But, one question that sticks around is why tracking KPIs is important; can't we just keep going and keep increasing our revenue without the need to track KPIs?
Related: What is KPI?: Beginners Guide You Have Been Looking For
Why KPI Monitoring is Important?
Though there are several reasons why monitoring KPIs is important, here are some of the most important ones:
#1. Measures Progress Over Time
KPIs consist of quantifiable data, and tracking them helps you make the right business strategies and improve operating practices.
By tracking KPIs correctly, you know exactly how much business you have done monthly, the recurring revenue, how customers respond to changes you make, and many more things that are crucial to keeping the business running.
#2. Improves Performance Efficiency
Tracking KPIs lets you analyze different patterns over time which can help draw valuable insights so that the overall performance of that segment goes up.
For example, if your revenue goes down from $100,000 to $80,000, tracking multiple KPIs like abandonment rate (if you own an ecommerce business), subscription losses, and net promoter score can tell you exactly why your revenue went down.
This way, you can optimize your website for a specific KPI and increase performance efficiency over time.
#3. Making Informed Decisions
With the right KPIs, you have the right information at your fingertips. That helps solve problems and make informed decisions when you are stuck in a lump.
#4. Personal Growth
Not all goals you set will be met. However, with the KPI tracking, you will always be encouraged to learn why certain things did not work as you intended. This creates a learning environment for team members and fosters personal growth.
What Are the Benefits of KPI Tracking?
The benefits of KPIs go way beyond only tracking and monitoring revenue figures. Here's how your organization can benefit from tracking KPIs:
#1. Increases Employee Engagement
Companies usually struggle with employee engagement, which can directly influence your business and overall growth.
KPIs swoop in here by providing a helpful mechanism to measure performance directly linked to employee engagement. This results in an engaged workforce that sees higher customer engagement and profitability.
On top of that, KPIs can also be linked to incentives like giving monthly bonuses to someone who secures the most sales. This way, you can encourage and empower the employees to hit the target more often.
#2. Improves Decision Quality
KPIs help in making informed decisions. For example, suppose there's a dip in your web traffic. Instead of jumping to random conclusions like perhaps the content is poor, or you should do the SEO right, you can look at the traffic source metrics and make better decisions to solve the problem.
#3. Analyzes Patterns Over Time
KPIs detect patterns over time which can be beneficial in solving key problems holding your growth.
For example, suppose your social media engagement remains low during a certain season.
In that case, KPIs will let you analyze the pattern so that you can design a social media campaign for that particular season or stay away from social media for that specific month(s).
What Are the Key KPIs Every Business Should Be Tracking?
#1. Total Revenue
Total revenue is the overall income generated by the sales of goods and services by a company over a specific period of time.
Here’s the formula to measure it:Total revenue = Number of units sold X Cost per unit
It’s a very simple way to determine how a company brings in money from its core operations before any expenses.
That makes it one of the key KPIs to be tracked as it evaluates the company's broader growth.
#2. Net Profit Margin
Net Profit Margin measures the effectiveness of your business in generating profit on each dollar of revenue your business brings in.
The result of the Net Profit Margin is calculated as:Net Profit Margin = Net Profit / Total Revenue X 100
The Net Profit Margin is essential for a company in:
-
Measuring the profitability of a business
-
Making long and short-term financial decisions
-
Keeping you ahead of your competitors in price battles
A higher Net Profit Margin signifies a growing business; if the margin decreases, consider it a red flag and act upon it ASAP.
#3. Customer Acquisition Cost (CAC)
It becomes essentially important in a business to know how much you spend to acquire a new customer.
CAC is a fundamental metric that monitors the aggregate cost incurred by a business in acquiring a new customer.
It's a popular barometer to measure the health of the growth among new-age startups and internet-based companies.
CAC is measured by a simple formula:CAC = (Sales cost + Marketing cost) / New customers
CAC is an important KPI that lets you know which segments are most profitable and efficient. It’s often regarded as one of the most important metrics used by investors to evaluate the scalability of a business.
#4. Customer Lifetime Value(CLV)
CLV estimates how much a customer will contribute to your business for the duration of your relationship with that individual.
You can measure CLV using the formula:CLV = (Customer Value X Average Customer Lifespan)
Where Customer Value = Average purchase value X Number of purchases
We know it sounds like putting a monetary value on your customers. However, it’s much more than that.
One of the biggest advantages is it improves customer retention and avoids customer attrition. In addition, measuring CLV allows you to make a more informed marketing decision that saves extra costs and increases overall profitability.
#5. Gross Margin
Gross Margin is net sales minus the cost of sold goods. It tells how much money a company retains after incurring direct costs used in manufacturing the product, excluding taxes and payrolls.
Gross margin = Net sales - COGS (cost of goods sold)
Where Net sales is the total money that came from sales for a particular period.
Gross margin isn't a key indicator in determining a company's profitability. However, companies use gross margin to evaluate the relationship between their cost of production and revenue.
It also helps companies to evaluate their management. A high gross margin indicates effective management in generating revenues based on direct production costs.
#6. Customer Loyalty and Retention
A study by Harvard Business School revealed that increasing customer retention by 5% increases the profit by 25 - 95%. That makes customer retention one of the most important, if not the most important KPI to track.
To calculate customer retention rate, you can use the formula:CRR= ((E - N ) / S) / 100
Where S is the number of customers at the beginning, E is the number of customers at the end, and N is the time period of acquisition.
Loyal customers are more profitable. Thus, tracking CRR helps increase sales by reducing the extra cost of customer acquisition.
In addition, old customers are likely to give more feedback on various products and services offered, allowing the company to improve faster.
#7. Net Promoter Score
A net promoter score indicates a customer's willingness to refer a product and service to their fellows. It's based on the results of a survey that asks customers to rate how likely they would recommend a brand to someone on a scale of 0-10.
Net Promoter Score (NPS) = Percentage of Detractor - Percentage of Promoter
NPS is one of the most important metrics which gives insights into customer satisfaction and brand loyalty. Moreover, tracking NPS leaves you primed to identify customers' pain points, resulting in higher revenue growth.
#8. Qualified Leads Per Month
Simply betting on leads won't tell the whole story about whether they will convert or not.
That’s why measuring the quality of leads is an important thing to consider.
Qualified leads is the ultimate KPI that tells how many leads are contributing to the sales so that you can improve your lead generation strategy.
You can use this formula to work it out:Qualifies Lead = Total Sales / Total leads
With an effective lead qualification method, you should achieve higher conversion rates and significantly lower your acquisition costs.
#9. Lead-to-Client Conversion Ratio
Lead-to-client conversion rate is a critical metric that tells how a company converts qualified leads into customers.
Calculating lead-to-client conversion rate is a bit tricky. Every company has its own unique definition of conversion, and thus it's necessary to define the conversion before calculating the metric.
Mathematically it can be expressed as a ratio:Lead-to-client conversion rate = (Qualified leads that resulted in sales / qualified leads)
Sales representatives mainly use this metric to evaluate the success of converting potential customers to actual customers. Moreover, it also tells about the effectiveness of various marketing channels of the campaign.
#10. Monthly Website Traffic
As the name suggests, monthly website traffic indicates the source of traffic on the website over a period of time which can be:
-
Organic Traffic: Those who land on your website by searching for it (organic search)
-
Inorganic Traffic: Those who land on your website by clicking ads
If you want to calculate the monthly website traffic growth from January to February sessions, here's how to do it:
Monthly website traffic = (Feb sessions - Jan sessions) / Jan sessions
This will give you the change in website traffic from January to February.
You can double down on the marketing channel that's working well by monitoring traffic growth. Moving ahead, calculating monthly website traffic can also help you refine your business strategy and expand your product line based on the analytics.
#11. Quick Ratio
The Quick ratio shows the ratio of gains in revenue to your revenue loss. It’s the coefficient of growth for an organization, as it incorporates all the essential elements into one number to understand the company’s growth.
You can calculate the quick ratio with a simple formula:Quick Ratio = New MRR + Expansion MRR / Churned MRR
Where MRR is the monthly recurring revenue
Tracking the quick ratio of your company allows you to understand your company in a better way. It also gives a glimpse into how the different sectors of your business like marketing, sales, and customer management are doing.
#12. Return Over Investment (ROI)
Whether you’re an investor or a shareholder, you want your every bet to bring a high return on investment. It expresses the profitability of a company. In plain terms, ROI tells you how efficient every dollar you spend is in generating profit for the company.
ROI = (Revenue - Investment cost) / Investment cost
Although the formula seems very simple, it's versatile and provides a basic idea of the profit/loss monthly. It also provides quantifiable results that let you measure the company's performance in different departments.
#13. Monthly Recurring Revenue
For subscription-based models like SaaS, banks, and telecommunication companies, monthly recurring revenue is one of the most important KPIs to monitor.
MRR is defined as the anticipated total revenue generated from all the active subscriptions in a month. That includes recurring charges from coupons, discounts, and add-ons.
Calculating MRR is quite simple and straightforward. You can do that by using the formula:MRR = Number of subscribers in a monthly plan X Average revenue per user
Example: If you have 5 subscribers on a $1000 monthly plan, then your MRR is $5000.
Tracking MRR helps you keep track of the monthly trends and provides valuable insights into the financial performance over time. It's also exceptionally useful in forecasting sales projections and planning for long and short-term business growth.
How Many KPIs to Track?
There is no magic number for how many KPIs you should be tracking. Instead of focusing on the number, you should make KPI reporting as transparent as possible.
Well, How do you make KPI reporting transparent and easy to understand?
You shouldn't be tracking everything. It makes no sense to do KPI monitoring if they don't correlate with how well your business is doing. If you are still looking for a number, in Datapad, we usually track 5-10 key metrics, and we also see that other companies are also doing the same thing
How to Set Up A KPI Tracking Dashboard in 5 Steps?
Let’s see how you can track KPIs via Datapad.
Step 1: Define Your Goals
Before you start tracking KPIs, you must first define the business goal(s) clearly and communicate the same to your team.
Setting monthly or quarterly strategic goals and milestones in terms of what you want to achieve for a specific KPI will help you keep track of your progress.
Start with shortlisting the KPIs you want to track. After you have the list ready, write down what you expect from each KPI besides it.
Step 2: Setup a Dashboard
Creating a dashboard on Datapad is a piece of cake. Just open the app, sign in to your account, and press the button ‘Create a Dashboard.’
You can then add the title, description (if needed), and a relevant emoji to add a touch of fun.
After filling out the fields, click on ‘Create.’

Step 3: Add Your KPIs Manually or Use a Data Source
With Datapad, you can import data manually as well as automatically.
To add KPIs manually, tap on ‘Add Metric’ and select Enter Manually.
-
Add a Title
-
Set a value to compare your KPI against if needed
-
Customize the color, date, and set goal
Later, choose the type of graph you want your KPI to have - A bar graph, Pie chart, Line diagram, or a simple table

Datapad has integrations with data sources like Google Analytics, Shopify, Facebook Ads, etc, which makes it easy for you to import and analyze data.
To add KPIs automatically:
-
Tap on the three dots you see on the right-hand side corner
-
Press the + sign that says Metrics
-
Go to ‘Use a Data Source.’
Select the data source you want to import the data from.

Step 4: Onboard Your Team
When your business starts growing and you have a lot of customers coming in, tracking KPIs alone can be exhaustive and tough. Having a team on your back is a good way to keep track of all the essential KPIs department-wise.
To add team members to your Datapad account:
-
Click on the left-hand side logo of the app
-
Go to Manage users
-
Click on the plus sign on the right-hand side corner
-
Enter the email address of your team member and tap invite users

But this isn't it, if you want to convey something important to a team member instantly, you can simply comment below the KPI, and your teammate will get a push notification about it.

Step 5: Monitor Your KPIs and Get Updated with Notifications
The best part about Datapad is its real-time notifications. If a KPI is going all haywire, you get an instant notification for the same. You can call your team up, discuss the situation, and fix it in no time.
Wrapping Up
KPI Tracking is a crucial procedure every business should undergo regularly. Without it, you won't be able to track where you performance indicators are heading.
Tracking KPIs through a kpi tracker such Datapad is an easy way to have all KPIs in your pocket and track them from anywhere in the world.
So join our beta program, try Datapad for free, and participate in an experience of KPI tracking like never before.
How to Make Google Sheets Dashboard in 3 Steps [2022]
How to Build a KPI Dashboard in Excel?
****KPIs vs. OKRs: What is the Difference and How to Use Both Correctly
Top 13 HR KPIs & Metrics You Should Track For Your Team
13 Most Important SEO KPIs Every Business Owner Should Track in 2022
13 Email Marketing KPIs Every Marketing Professional Should Track3 Software Development KPIs Every Dev Team Should Track15 KPIs for Logistics Every Logistic Manager Should Measure
15 Best KPIs for Operations that Are a Must for Every Business to Track
13 Best Product Manager KPIS You Should Be Tracking In 2022
15 Important Retail KPIs & Metrics to Track For Better Understanding of Your Business