![Best 12 Swydo Alternatives in 2024 [Free & Paid]](/_next/image?url=https%3A%2F%2Fframerusercontent.com%2Fimages%2FZ09EkUo2wRtFbRp5zQ7F8Ydlng.png&w=3840&q=75)
Some of the best Swydo alternatives for quick access to KPIs are Datapad, Mix Panel, GoodData, Amplitude, Metrics Watch, Adverity, Ninja Cat, Whatagraph, Slemma, Spider Strategies, InfoCaptor, and Looker.
In this guide, you will find a full comparison between these Swydo alternatives and know why they are better than Swydo in many aspects.
Why Might You Look for Swydo Alternatives?
Reason #1. Weak Customer Support
Any tool, no matter the market segment, needs to have flawless customer support. In most cases, when a customer buys a new tool, they often get stuck in some way using it and need an expert to sort the issues out.
Swydo seems to fail at providing even basic customer service to its customers.
Many people have complained about the long waits and inaccuracy in solving the issues.
Here’s one example:

Reason #2. Problem with Report Generation Feature
Swydo has an option of automating report generation of KPI dashboards so you can save time and send the reports across to your clients or teammates quickly.
But it sometimes becomes annoying as the dashboarding platform doesn’t allow you to edit the reports after creation.
What’s even worse is there’s no solution for it on any community or Youtube.
Apart from this, Swydo also lacks multiple edit options and doesn’t have a great organizational structure.

Reason #3. Lacks Flexibility
When you invest in any KPI tracking software, you want it to be completely customizable and flexible.
Why?
That’s because you want your KPI dashboards to suit your brand color and theme.
Apart from the customization flexibility, Swydo also lacks widget option flexibility.
Meaning that you can't change a certain widget according to what you want to actually display on the dashboard.
Here’s an example of how customers often struggle with Swydo widgets:

What are the Best Free Alternatives to Swydo?
-
Datapad: Track KPIs from your mobile phones via customizable and integrative dashboards
-
Mix Panel: Analyze data in real-time via interactive dashboards
-
GoodData: Helps in tracking KPIs and doubling down on what’s working
-
Amplitude: Build a completely customizable dashboard with flexible widgets

How Does Datapad Compare to Swydo?
Unlike Datapad, Sywdo doesn't have a mobile app making it time-consuming to track KPIs.
Swydo dashboards are not mobile-optimized, so there’s no way you can track KPIs from your mobile phones with Swydo.
Apart from this, Swydo doesn't have any integration option with Google Sheets; most startups and scaleups, when tracking KPIs, need it.
But Swydo has features like a white labeling option and report automation that Datapad lacks because it's a brand new platform.
Some of the best Swydo alternatives for quick access to KPIs are Datapad, Mix Panel, GoodData, Amplitude, Metrics Watch, Adverity, Ninja Cat, Whatagraph, Slemma, Spider Strategies, InfoCaptor, and Looker.
In this guide, you will find a full comparison between these Swydo alternatives and know why they are better than Swydo in many aspects.
Disclaimer: The information below is accurate as of 28th August 2022.
Why Might You Look for Swydo Alternatives?
Reason #1. Weak Customer Support
Any tool, no matter the market segment, needs to have flawless customer support. In most cases, when a customer buys a new tool, they often get stuck in some way using it and need an expert to sort the issues out.
Swydo seems to fail at providing even basic customer service to its customers.
Many people have complained about the long waits and inaccuracy in solving the issues.
Here’s one example:
Reason #2. Problem with Report Generation Feature
Swydo has an option of automating report generation of KPI dashboards so you can save time and send the reports across to your clients or teammates quickly.
But it sometimes becomes annoying as the dashboarding platform doesn’t allow you to edit the reports after creation.
What’s even worse is there’s no solution for it on any community or Youtube.
Apart from this, Swydo also lacks multiple edit options and doesn’t have a great organizational structure.
Reason #3. Lacks Flexibility
When you invest in any KPI tracking software, you want it to be completely customizable and flexible.
Why?
That’s because you want your KPI dashboards to suit your brand color and theme.
Apart from the customization flexibility, Swydo also lacks widget option flexibility.
Meaning that you can't change a certain widget according to what you want to actually display on the dashboard.
Here’s an example of how customers often struggle with Swydo widgets:
What are the Best Free Alternatives to Swydo?
-
Datapad: Track KPIs from your mobile phones via customizable and integrative dashboards
-
Mix Panel: Analyze data in real-time via interactive dashboards
-
GoodData: Helps in tracking KPIs and doubling down on what’s working
-
Amplitude: Build a completely customizable dashboard with flexible widgets
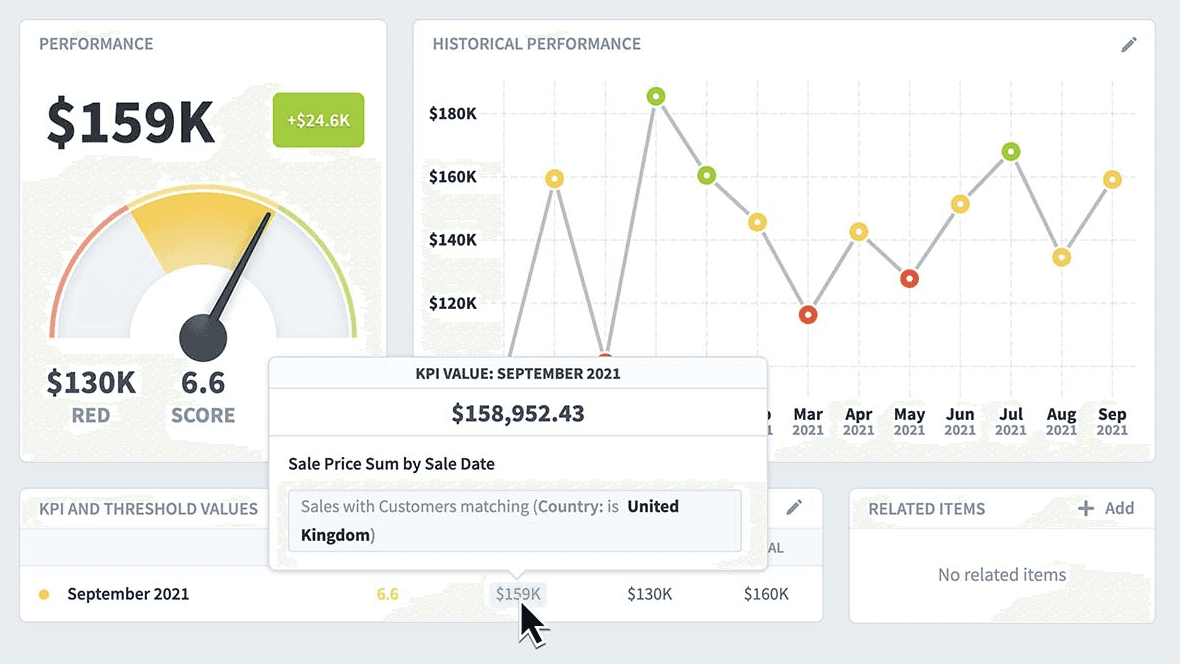
#1. Datapad

Datapad helps you track all essential metrics from stunning dashboards.
The beauty of Datapad lies in its simplicity and ease of use. With our tool, anyone in your team with zero technical knowledge can start building reports in mere seconds.
As a go-to solution for Agencies, Datapad makes it easy to onboard new customers with 1-click templates and share performance reports with read-only links.
Datapad also makes it easy to collaborate as a team with the ability to drop comments on KPI cards.
The AI insights tool lets anyone detect anomalies in their data and provides actionable to-do items to increase performance.
Key Feature #1. Templates

Creating reports for your business is no easy task. You have to determine a lot, from which metrics to choose to design the right charts.
If you are an agency and want to create the same reports for multiple clients, then this hassle becomes even more burdensome.
Guess what? Datapad lets you do all this with just a few clicks.
With Datapad's templating features, you can:
-
Choose from a gallery of pre-designed templates and apply them with 1-click
-
Build a custom dashboard and re-use it as a template by changing it's sources
-
Share all connected data sources in the workspace with your teammates
Key Feature #2. Team Collaboration

Tracking KPIs isn't a one-person job when you have a lot of them; you need a team. But not all KPI dashboard tools let you bring your team on board.
Guess what? Datapad lets you do it quickly and easily.
Moreover, you can assign individual team members tasks to handle, goals to achieve, and metrics to measure.
With Datapad's team collaboration feature, you can:
-
Get notified whenever there’s an update for any metrics and KPIs you track
-
Communicate around your metrics and KPIs with your team members
-
Get push notifications on your phone to stay updated with all your KPIs
Key Feature #3. Automated Reports & Scorecards
Wouldn't it be great if you could check your business KPIs first thing in the morning, straight from your inbox?
With our dashboard software, you can subscribe to any dashboard and receive daily email updates.
All you have to do is build a dashboard, click the subscribe button, and set your email preferences.
The best part is you can share reports with anyone, even emails outside of your organization or workspace.
Step 1: Subscribe to a dashboard

Step 2: Check your inbox

With Datapad’s report and scorecard automation, you can:
-
Subscribe to any dashboard
-
Receive daily highlights around all KPIs
-
Send reports to users in and outside of your organization
-
Customize the date range, calculation, and styling of KPIs
Pricing
Datapad has a free tier that includes 1 dashboard. If you want more, you can upgrade to the $30 Standard Plan, which includes 3 dashboards and scales with your usage. Datapad also offers a Business Plan tailored for agencies and includes dedicated customer support.
We are now offering an earlybird discount to all users, so it's a great time to sign up and give Datapad a spin.
How Does Datapad Compare to Swydo?
Unlike Datapad, Sywdo doesn't have a mobile app making it time-consuming to track KPIs.
Swydo dashboards are not mobile-optimized, so there’s no way you can track KPIs from your mobile phones with Swydo.
Apart from this, Swydo doesn't have any integration option with Google Sheets; most startups and scaleups, when tracking KPIs, need it.
But Swydo has features like a white labeling option and report automation that Datapad lacks because it's a brand new platform.
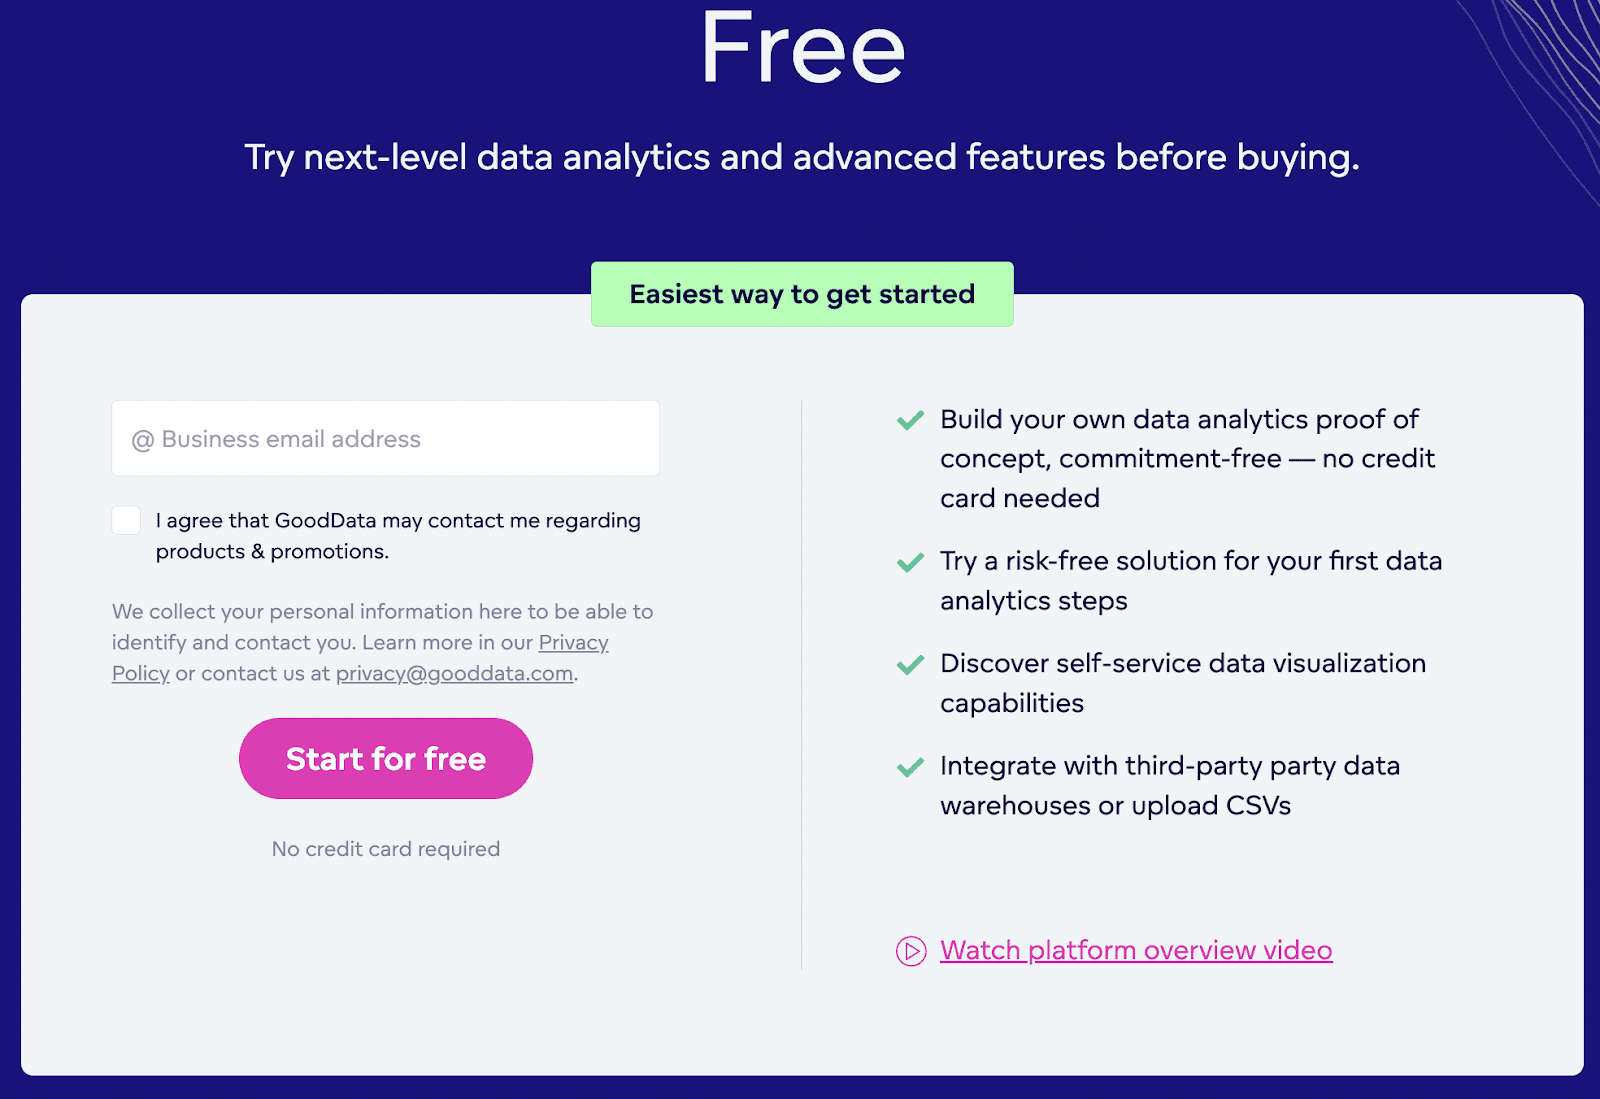
#2. GoodData

GoodData is a self-hosted modern analytics platform that delivers consistent and real-time analytics so that teams across departments can track critical KPIs.
It powers around 50% of fortune 500 companies by helping them understand their business better by showing crucial KPI-related actionable insights and meeting their customer needs.
Who Is It for?
Whether you're a leading SaaS company or an ecommerce business, GoodData has a profound impact on both. Besides, it has every feature that can help a software company track KPIs and double down on what's working.
Features
-
Lets you import data from various data warehouses and datasets like AWS, Snowflake, Vertica, and others
-
Headless BI provides consistent and real-time metrics so that you can avoid spending time explaining familiar tools to end users
-
Easy drag and drop features allow business teams to create their own charts, reports, and dashboards meant for data visualization
-
Lets you share reports and dashboards via access rights, scheduled emails, and file exports
-
Enables no/low code creation of interactive dashboards and visualizations by using drag and drop builder
Pricing
If you’re still worried about trying GoodData out, you can start with its free plan and eventually move to paid ones if you need more features.
#3. DashThis

DashThis is a marketing reporting and dashboarding tool that lets you create white-labeled reports and save time.
It's trusted by the likes of iProspect, the University of Oxford, and KTM making it a reliable and trustworthy reporting tool online.
Who Is It For?
DashThis is meant for marketing agencies who need to send marketing reports to their clients regularly. It's also a great tool for companies with large teams tracking KPIs, as you can build customized reports and share them with your team in no time.
Features
-
Connects with 34 of the most widely used digital marketing tools online to make report generation and sharing a piece of cake
-
Use data from multiple integrations in a single dashboard and keep all the KPIs under one roof
-
The CSV file import system of DashThis lets you import any data to the dashboard from excel and spreadsheets
-
Gives you access to unlimited data sources even with its free plan
-
Has a wide variety of pre-built report templates, so you don't have to create reports from scratch
Pricing
DashThis has a free plan that lets you create 10 dashboards and test the platform out for 15 days. If you want to continue using it, you can just upgrade to a paid plan.

What are the Best Paid Alternatives to Swydo?
-
Agency Analytics: Build for agencies to automate KPI reporting
-
Metrics Watch: Email-based KPI reporting tool build for digital marketing agencies
-
Adverity: Build stunning white labeled reports and share them with your clients
-
Ninja Cat: Transform boring data into interactive visual dashboards
-
Whatagraph: Track, monitor, and analyze KPIs with ease
-
Slemma: Build for ecommerce business owners
-
Spider Strategies: Build for enterprise to track KPIs
-
InfoCaptor: Specifically designed for WooCommerce-based ecommerce stores
-
Looker: Track KPIs and make data-driven decisions
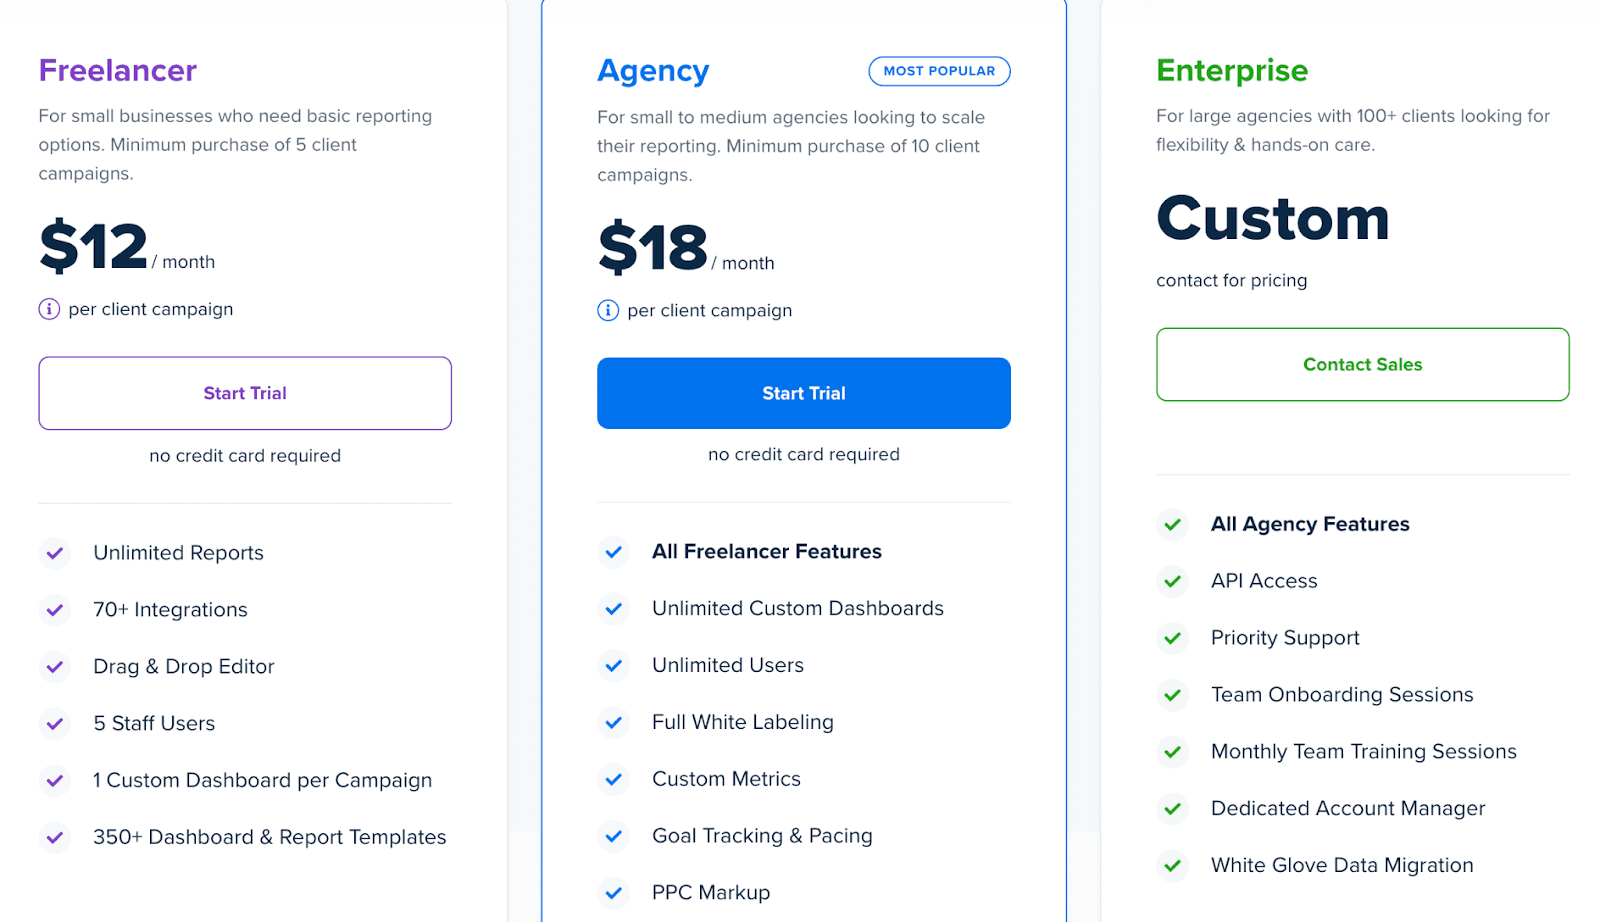
#4. AgencyAnalytics

AgencyAnalytics is an automated client reporting software that helps you create customized dashboards and reports, and send them across to your clients in minutes.
The tool lets you create white-labeled reports and integrates with 70+ data sources to build any possible dashboard or report you can think of.
Who Is It For?
AgencyAnalytics is built for small agencies and businesses that track very specific KPIs and need multiple data sources to import data. It has a great UI that makes it an easy tool to use for beginners.
Features
-
Comes with a drag and drop filter that lets you customize all your clients’ reports and white label them before sending them across
-
Build custom dashboards with several pre-built templates and data connectors to track KPIs for your and your client’s business
-
Has permission management feature that lets you control and limit dashboard access
-
Integrates with communication software like Zendesk and Intercom to talk to your clients about the reports you send them
-
Set clear goals for every KPI and assign them to your team to track and analyze regularly
Pricing
AgencyAnalytics offers three paid plans to choose from:
-
Freelancer: $12/month
-
Agency: $18/month
-
Enterprise: Custom pricing
#5. Metrics Watch

As a busy marketer, you don’t want to gather data across different platforms and create manual reports.
That’s not why you’re there.
Metrics Watch is a simple email-based reporting solution that lets you automatically compile data and send marketing reports daily, weekly, or monthly to your clients or team.
Who Is It for?
It doesn't matter if you're a digital marketing agency or an in-house marketing team; Metrics Watch is one of the most efficient platforms that saves you hours of work by delivering automated marketing reports to your clients.
Features
-
Lets you share the marketing reports directly to your client’s inbox via email without having the need to generate any links or PDFs
-
Integration with some of the commonly used marketing platforms like Google Ads, Mailchimp, and others to help you build a perfect KPI report
-
Has pre-built customized templates so that you can design your report easily and quickly
-
The preview feature allows you to analyze reports you’ve scheduled to send so that you can add further analysis to it if needed
-
White labeling capabilities to give a personalized touch to your marketing reports
Pricing
Metrics Watch offers four paid plans:
-
Starter: $29/month
-
Pro: $50/month
-
Premium: $100/month
-
Enterprise: Contact the sales team

#6. Adverity
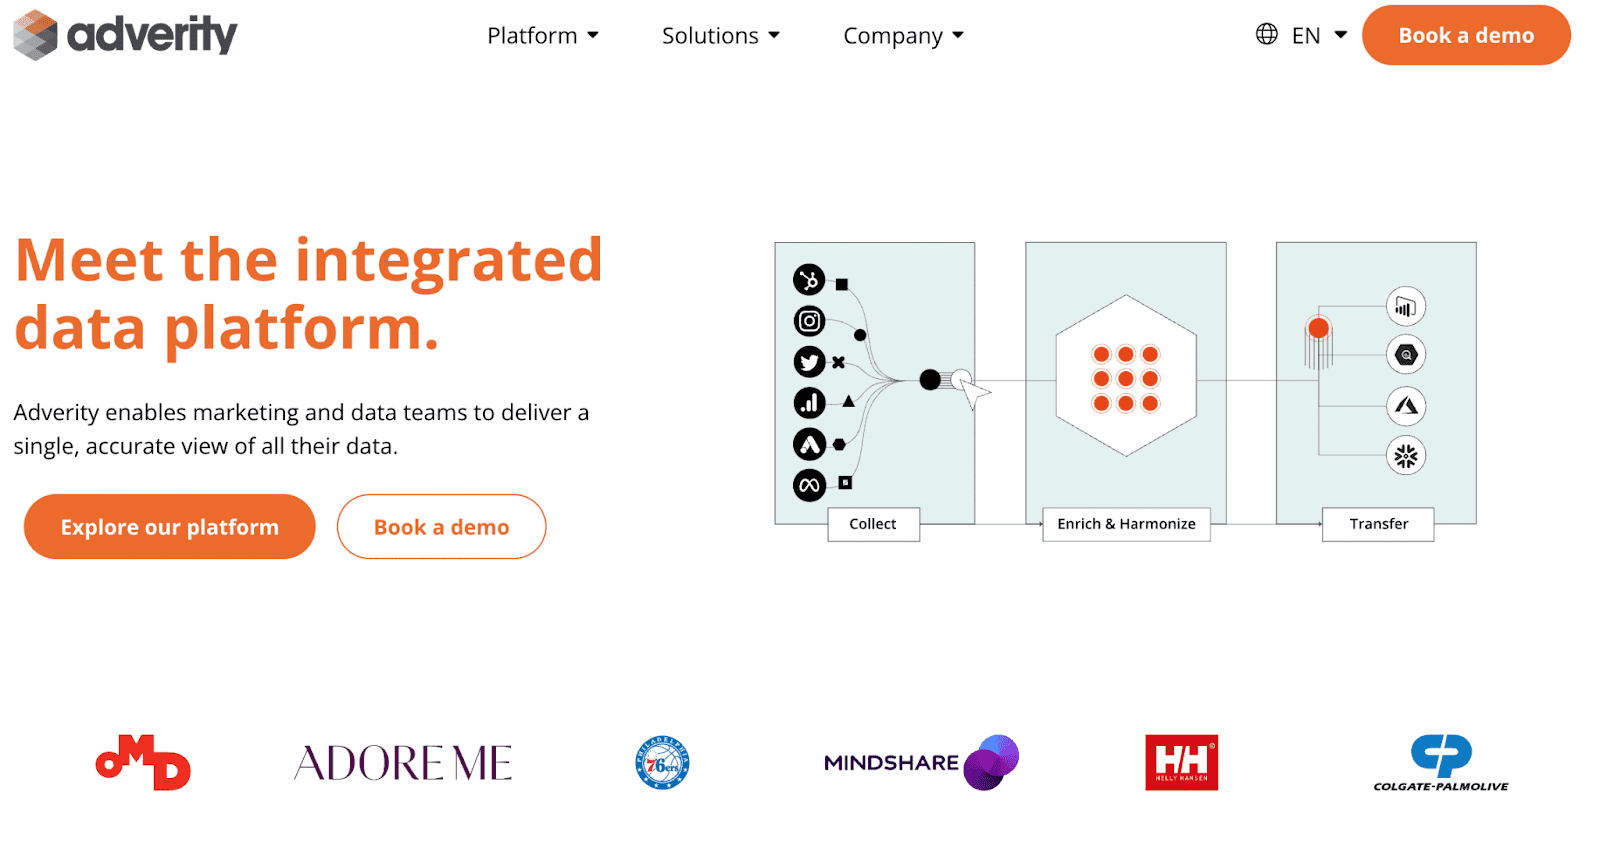
Adverity is a data integration platform that gathers and enriches data from different sources and sends it to marketing teams so that they can get a more accurate view of it.
With a 4.5 rating on Capterra, Adverity has resulted in improved efficiency in data management and operations across many organizations.
Who Is It For?
Adverity provides more precise data insights to a variety of industries like media, retail, telecom, and many more. Its features help companies generate white labeled reports and make strategic goals for the company.
Features
-
Over 600 data connectors that enable automatic data integration from common platforms
-
Can send integrated and harmonized data to various databases, visualization software, or your preferred BI tool
-
AI-powered proactive analytics help you to outrank your competitors and drive upsell by discovering hidden opportunities
-
A powerful transformational engine provides analytics-ready clean data for compelling data visualization
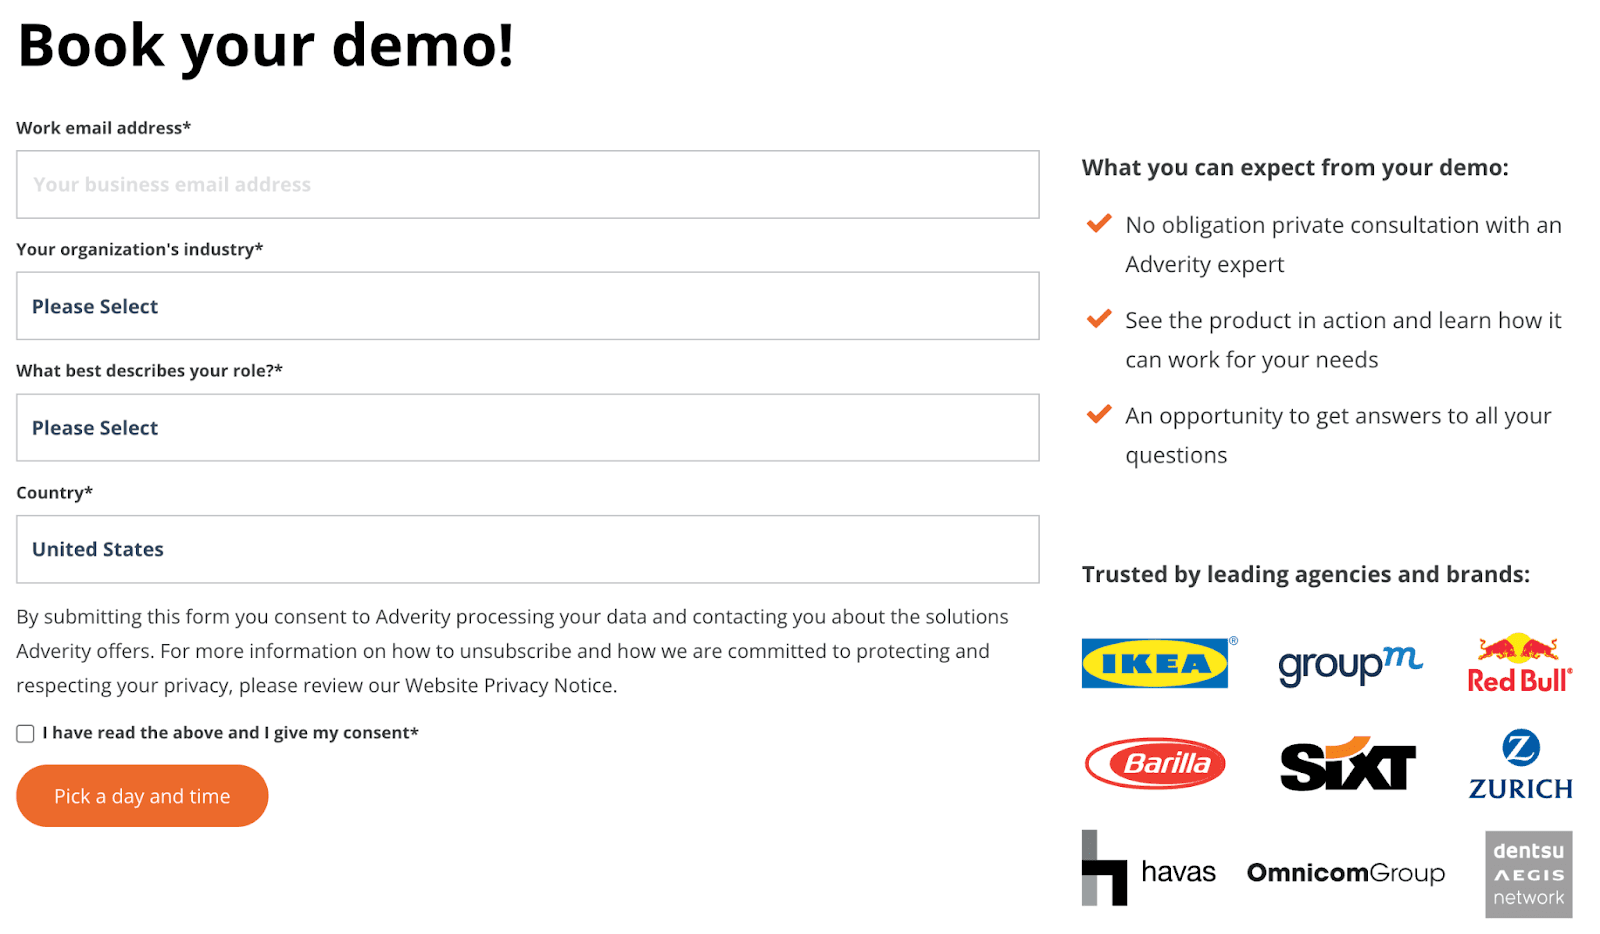
Pricing
Adverity provides flexible pricing plans uniquely customized to the needs of every customer. You can book a demo, test the waters, and contact their sales team for pricing if you like it.
#7. Ninja Cat
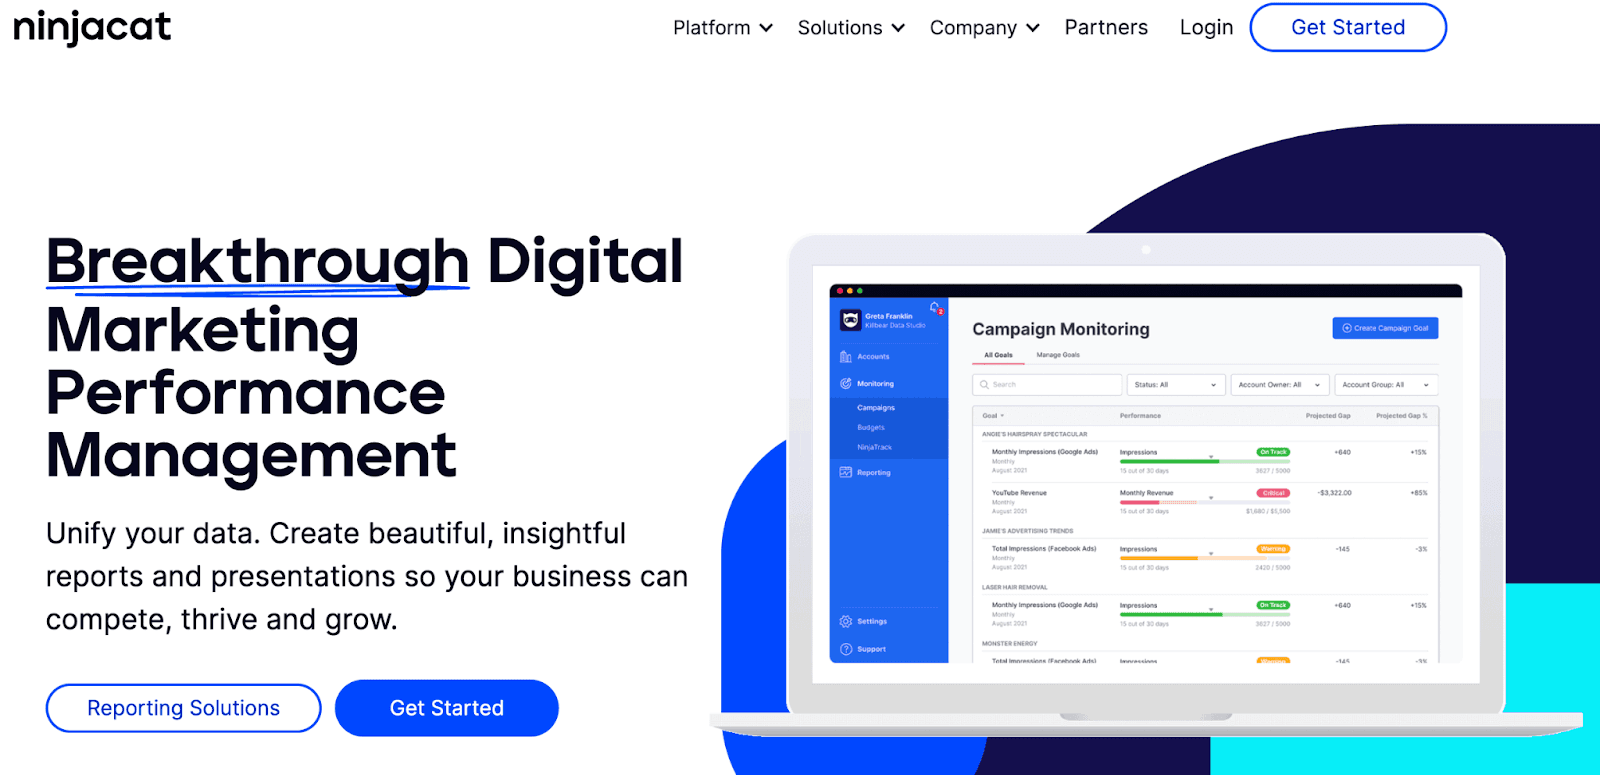
If you’re a digital marketing agency, organizing raw data into streamlined reports for every client can be clunky and time-consuming.
Ninja Cat is a digital marketing performance management platform that automatically transforms cold data into insightful reports so that you can accelerate your business and deliver better marketing campaigns.
Who Is It For?
Many marketing agencies and media houses rely on Ninja Cat for high-quality automated reporting that can drive increased ROIs in less time.
Aside from that, businesses in the industries such as automotive, health care, and property management also benefit from this tool.
Features
-
Automated marketing dashboards give you a real-time analysis of your marketing performance
-
More than 100 integration partners let you import and unify all the marketing data into one single platform
-
The campaign monitoring feature makes you proactively aware of KPIs and budget so you can keep track of your campaigns
-
Dashboard updates and custom notifications keep you alert and lower the chance of mistakes
-
Auto generation of marketing reports improves speed, accuracy, and better campaign results
Pricing
You can schedule a time to connect with the sales team. They will suggest the best plan according to your business needs.
#8. Whatagraph

Whatagraph is a cross-channel reporting tool that helps monitor and analyze the performance of multiple marketing campaigns.
Users can automatically import data from more than 40 sources to create beautiful and engaging reports and share them with clients and their teams.
Who Is It For?
Whatagraph is a great tool for marketing agencies and teams to progress and make result-based decisions. It’s also known for providing complex reporting solutions to large marketing enterprises.
Features
-
Lets you gather data from multiple accounts into a singular platform so that you have a clear overview of all the KPIs
-
Allows automated delivery of reports at a selected frequency so that your client doesn’t have to ask for it repeatedly
-
Google Sheets and Public API integrations let you add custom data to your report
-
Full suite of white labeling options so that you can create customized reports that show your brand
-
Has pre-made widgets and templates that help you create marketing reports in no time
Pricing
Whatagraph offers three pricing plans tailored to your needs:
-
Professional: $199/month
-
Premium: $299/month
-
Custom: Contact the sales team

#9. Slemma
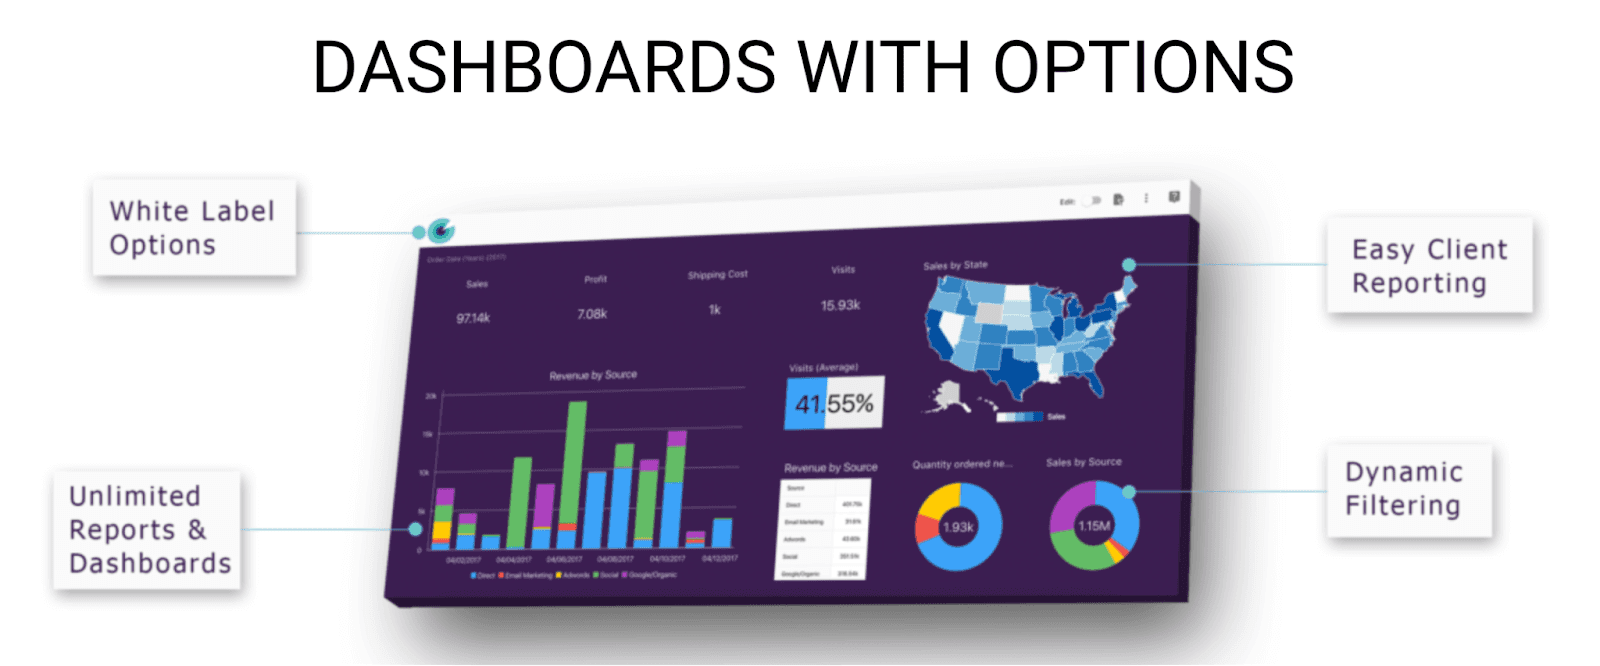
Slemma is a top-rated dashboarding solution that lets you build killer dashboards in minutes that help businesses track their growth.
Slemma makes report generation quick and seamless, making it easier for businesses to visualize third-party data in no time.
Who Is It For?
Whether you're an ecommerce business owner or run a social media agency, Slemma can be used by anyone, even if you don't have a background in data analytics.
Features
-
Offers a codeless connection to over 75 preferred apps so that you can have your data in a single place
-
Lets you build and provide your own customized reports from its library of pre-built templates
-
Powerful editing options allow users to explore the endless possibility with dashboards like build, edit, and filter
-
Set of white label options that let you create a report that is fully branded as your own
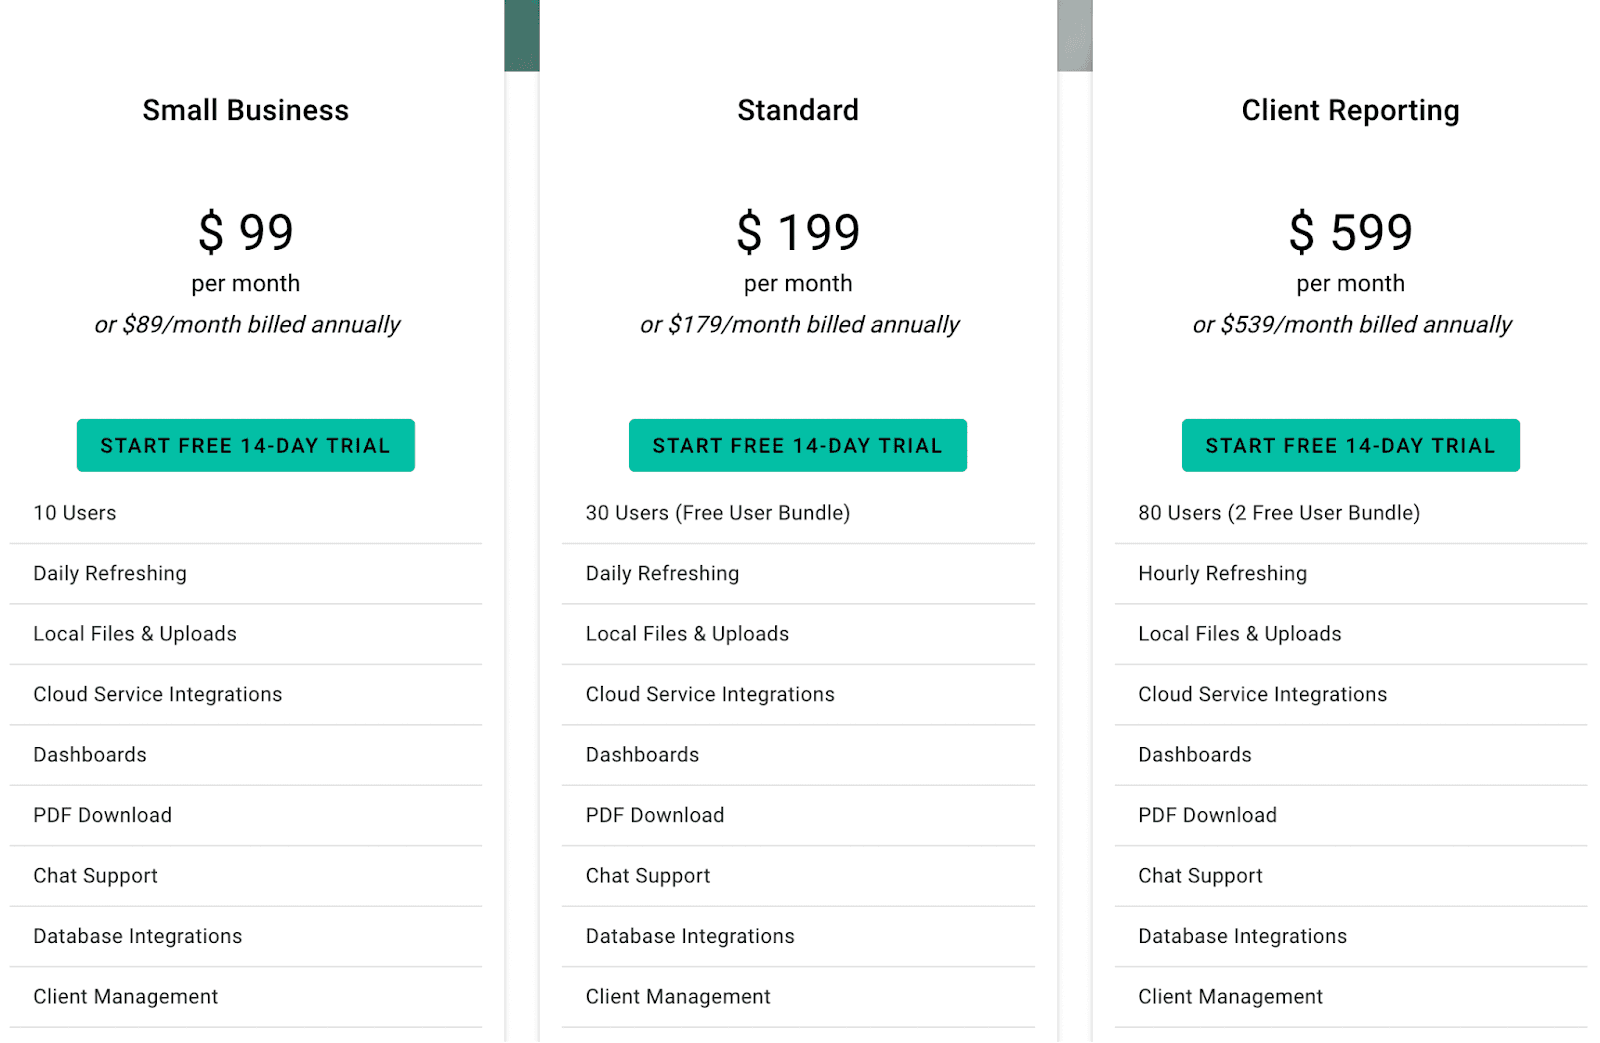
Pricing
Slemma offers three paid pricing plans:
-
Small business: $99/month
-
Standard: $199/month
-
Client reporting: $599/month
#10. Spider Strategies
Spider Strategies is a business intelligence software that helps businesses bridge the gap between strategy and execution.
Once you're clear with your strategic plans, Spider Strategies highlights the operational data to ramp up the growth of your organization.
Who Is It for?
Spider Strategies is used by a diverse range of organizations. From finance and non-profit to defense and retail, the platform helps keep you on track with your business so you can make better decisions.
Features
-
Has engaging infographic for data visualization so you can understand your performance and make fact-based choices
-
Enables you to quickly create data-driven KPIs that show goals and allow you to discover underlying data for BI analytics
-
Lets you build interactive dashboards that allow real-time data exploration needed to predict future business performances
-
Lets you export your reports to PDFs and Excel so you can easily share them with clients on a weekly and monthly basis
-
Ad hoc analysis breaks the datasets into further segments and explores the data to answer any queries related to it
Pricing
Spider Strategies offers four paid plans for organizations of all sizes:
-
Growth: $125/month
-
Team: $1000/month
-
Department: $2250/month
-
Enterprise: $5000/month

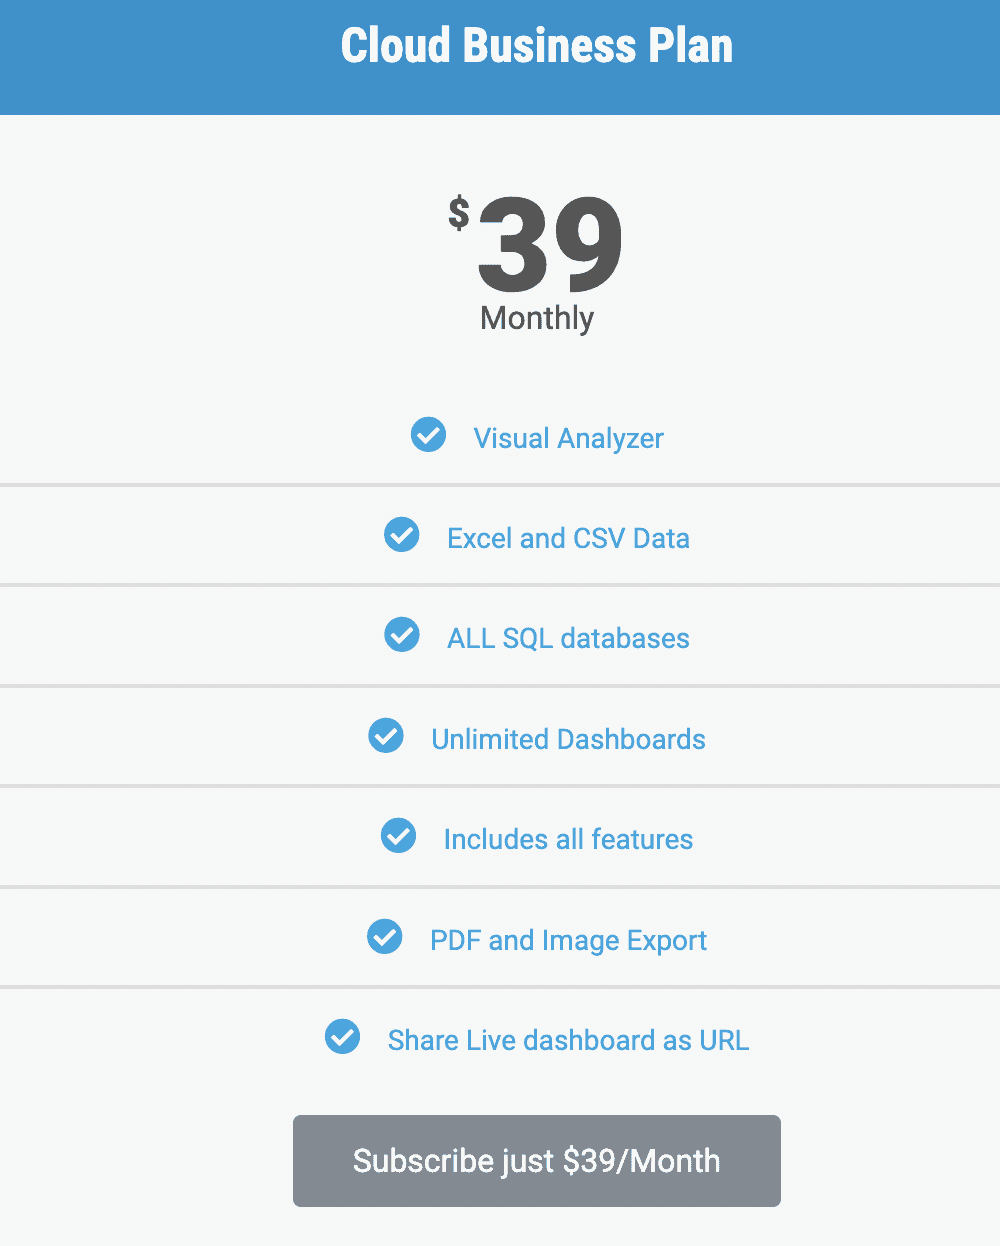
#11. InfoCaptor
InfoCaptor is a web-based application that pulls your data to build creative BI dashboards for any database.
Who Is It For?
InfoCaptor is specifically designed for WooCommerce store owners to track KPIs and build reports to share with your team.
The tool has pre-built templates via which you can make reports yourself. The platform also lets you order reports, and InfoCaptor experts will make them for you.
Features
-
Connects to a variety of databases such as MySQL, Oracle, and others, making sure you've every information to visualize
-
The Excel dashboard software solution allows you to build tables and charts with simple drag and drop elements visually
-
Google Analytics data warehouse solution brings all the relevant KPIs to one place, so you understand what's important
-
The tool lets you order reports for WooCommerce dashboards, which you can share with your team via PDF or CSV
Related: How to Build a KPI Dashboard in Excel?
Pricing
There's just one plan InfoCaptor offers, and that's their cloud-based plan for reporting and dashboard tool. You can pay $39/month and get started.
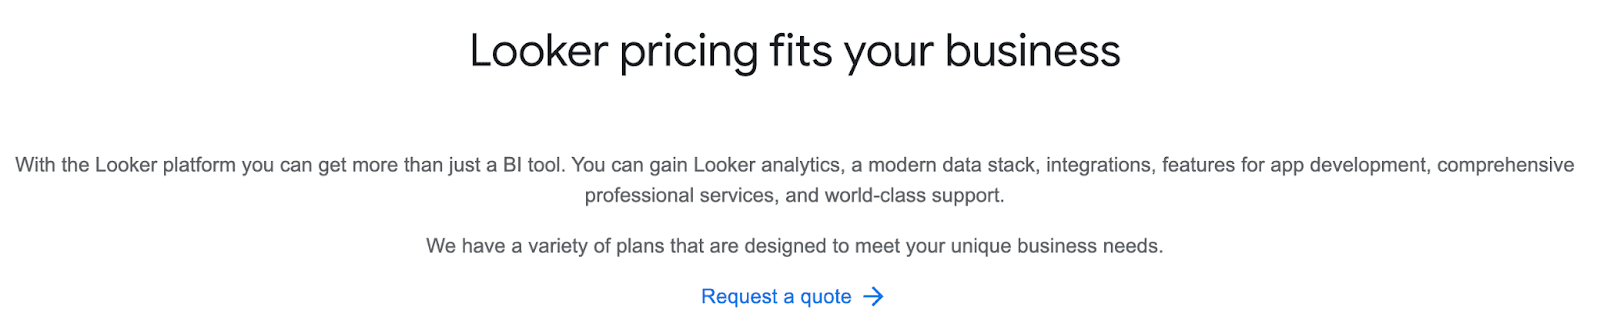
#12. Looker

Looker is a business intelligence/analytics tool that lets you store and manage business-related insights and reports in one place to share across functions.
It sits alongside Microsoft Power BI in terms of features and enterprise use cases.
Who Is It For?
Looker is meant for business or marketing teams of any size who want a hub to create and manage relevant business insights from various data sources.
Features
-
Interactive and easy to create dashboards with the simplest visualizations to help anyone understand granular data sets
-
Embedded Analytics and Flawless data delivery allow easy scheduling and distribution of reports, insights, and queries across multiple stakeholders
-
Seamless integration with existing tools and third-party APIs to assemble any scattered data
-
Simple data modeling and blending toolkits to support the needs of advanced users
Pricing
Looker doesn’t reveal its pricing on the website. You can fill out the form and request a quote from their sales team.
Keep All Your KPIs in Pocket for Free with Datapad
All the above-mentioned Swydo alternatives are tried and tested, you can try the one that you think suits your needs.
But if you want to kick things off quickly, you can do that with Datapad
Our mobile-first KPI tracking app lets you keep all your KPIs in your pocket. You can onboard your team, assign them KPIs, and talk to them in real time.
Datapad is a free-to-use app, so you can just sign up and kick things off immediately.
Read more:
9 Best Metabase Alternatives in 2022 [In Depth Guide]