
Do you know what the inventory to sales ratio of your business is? 🤔
If not, that’s because you and your team aren’t tracking all the essential KPIs for supply chain.
Supply chain consists of a series of processes involved in production and distribution of a product. So if you have no idea how your product’s being manufactured and distributed, your business will most likely fail with time.
So what do you do to avoid this? The answer’s quite simple - Track all the supply chain KPIs!
Tracking KPIs regularly can help you rectify problems and ensure that your store's supply-to-demand ratio is always even.
In this article, you will discover what supply chain KPIs are and know about the 15 best KPIs to track to increase your business’s supply chain efficiency.
What are Supply Chain KPIs?
Supply chain KPIs are barometers that help you track how effectively your logistics targets are met. These metrics give clear insights into inventory management, order fulfillment rates, inventory-to-sales ratio, and other helpful things.
On top of that, these parameters help you set informed future goals for several business activities based on the progress you make on the go.
Let's take an example of company A which has been selling sneakers for over 3 years.
Although the company makes fancy sneakers, it hasn’t been profitable yet.
But why is that so?
That’s because of the poor inventory management.
But how come the company didn’t know about that until now?
Had the company tracked its inventory turnover, it would have got a clear idea about the percentage of stocks sold over a specific time.
This way, the company would have replaced the outdated inventory stocks with the new ones at the right time, which gives a greater chance to fulfill the customer's needs and turn the tables.
As you can see from the example above, supply chain metrics reveal shortcomings allowing you to leverage your business to be more productive and ultimately more profitable.
Now that you're familiar with the basic idea of supply chain metrics let's look at the 15 best key performance indicators that help improve your supply chain practices.
What are the Top 15 KPIs for Supply Chain Management?
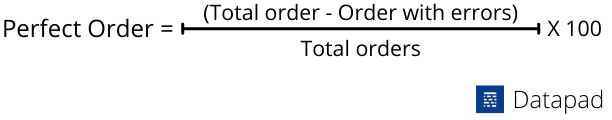
#1. Perfect Order
The perfect order rate measures the effectiveness of a supply chain.
Briefly, it's defined as the number of orders delivered to customers without any incidents, where incidents mean damaged goods, wrong delivery, or late shipments.
It’s one of the most critical supply chain KPIs that gives you insights about issues such as inventory losses, damages and delays, and inaccuracies in your business.
Moreover, it also lets you track your delivery operations, manage costs, and has a direct impact on customer satisfaction.
You can measure the perfect order rate by using a simple mathematical formula:
#2. Cash-to-Cash Cycle Time
Cash-to-cash cycle time reveals a lot about the efficiency of your supply chain practices. It represents the amount of time taken to transform your raw materials to bonafide cash flow.
In other words, it reveals how much time your business takes between paying suppliers for raw materials and receiving payment from customers for selling the product.
There are three main components of calculating this metric:
-
Days of inventory (DOI)
-
Days of payables (DOP)
-
Days sales outstanding (DSO)
You can simply put all these into a simple formula and get cash-to-cash cycle time:
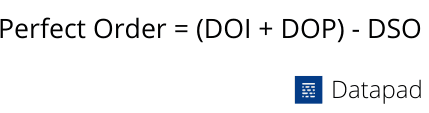
Note: A lower value of this KPI indicates an increased efficiency of your supply chain management process.
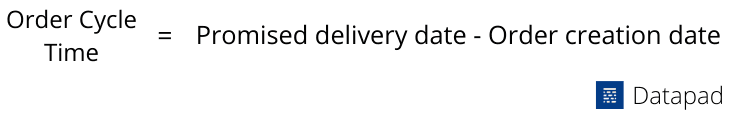
#3. Customer Order Cycle Time
Customer order cycle time is the time taken between receiving a purchase order from the customer and the moment it gets delivered to the customer.
It’s one of the most important metrics used by companies to distinguish themselves from their competition and provide a positive customer experience.
Clearly, this supply chain KPI says a great deal about the responsiveness of your supply chain practices. Moreover, examining this metric also tells a lot about other vital elements like inventory management, invoicing, and payments.
Here’s the formula to calculate the customer order time:
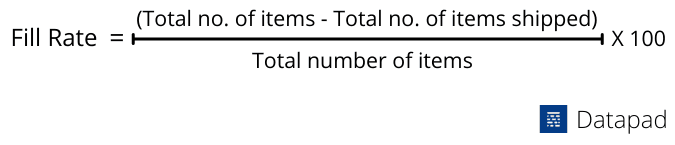
#4. Fill Rate
Customers expect on-time delivery, and as a result, it's important for businesses to monitor the order-filling process. That's why fill rate is such a crucial supply chain KPI that businesses should track.
Fill rate is defined as the percentage of orders you’re able to meet without any backorders or stockouts on the first shipment. It provides a comprehensive view of your supply chain performance.
Tracking fill rate helps businesses measure the demand for different SKUs in the inventory. Not only that, but it also gives a clear insight into the delivery operations, which is essential in meeting customer demands.
You can simply calculate the fill rate using this formula:
#5. Inventory Days of Supply
Also called the Inventory Period, it represents the average time your inventory takes before it needs restocking.
Currently, it has become one of the most important KPIs a business must track.
Do you know why?
That's because if a big chunk of your capital sits ideally in your inventory, it's of no good use to your business.
That's why it's necessary to track your inventory so that it gets replenished just before any extraordinary situation arises and not unnecessarily.
To know about your inventory status, you can use this simple formula:
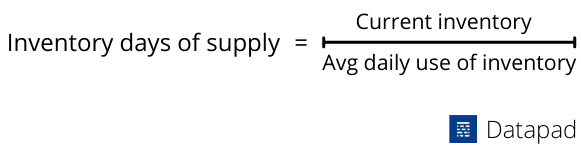
A lower value of inventory days of supply KPI reduces the risk of outdated inventory, which in turn helps businesses to have a more balanced inventory policy.
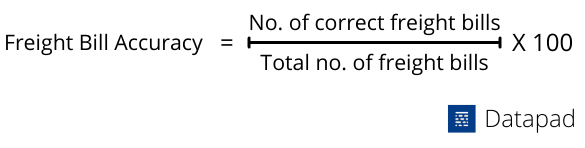
#6. Freight Bill Accuracy
Freight bill accuracy is determined as the percentage of error-free freight bills out of total freight bills.
It's an integral part of smooth supply chain operation, and any issue with this particular KPI would prove detrimental to your business.
Tracking this particular metric helps you find the blind spots in shipping and billing operations which points your business to a path of growth.
Other than that, it also helps businesses meet customer demands in an accurate manner.
Here’s how you can calculate freight bill accuracy:
#7. Days Sales Outstanding [DSO]
Days sales outstanding is a measurement of the estimated amount of time a company takes to collect revenue from the customers once the sale’s been completed.
In simple terms, it tells how swift is the process of revenue generation of a company.
Not just that, it also showcases a business's financial health. The lower the number, the better.
When the day's sales outstanding value is low, it means that a company is taking less time to collect payments from its customers, which encourages the cash flow and maximizes profitability.
On the flip side, a higher DSO can stunt the cash flow of a company which can severely impact the business operations. And that’s why businesses need to track this KPI.
You can calculate the DSO with a simple formula:
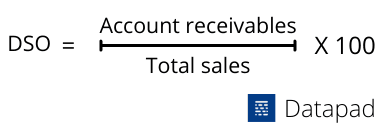
Note: Days sales outstanding is usually calculated every month.
#8. Inventory Turnover
Inventory turnover gives an idea about how many times your entire inventory stocks have dried up during a certain time frame.
It's a KPI that makes sure a company doesn't keep more products in their inventory than required. In other words, calculating inventory turnover will streamline your supply chain process.
Tracking this KPI can help you measure the efficiency of the production process, marketing, and sales operations, and order fulfillment capabilities.
It also covers all the critical business aspects needed to boost your brand authority-that makes it overriding to calculate this particular logistics KPI.
You just need two elements to track Inventory turnover ratio - Cost of goods sold and average inventory.
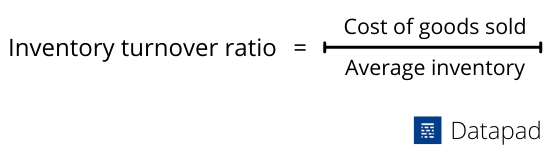
A significantly higher inventory turnover value substantiates efficient inventory management, meaning more profitability.
#9. Gross Margin Return on Investment [GMROI]
Essentially, maintaining a positive ROI on a consistent basis reveals the profitability of a business. That’s why every business eyes for maximum return on its investments for each activity it undertakes.
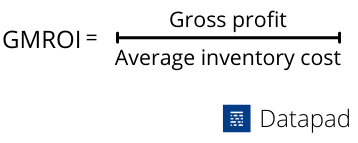
In supply chain management, gross margin ROI reveals the gross profit gained from the investment you do for your inventory. This helps you to identify the bottlenecks in your inventory management practices.
What's more, you can use this information to invest in inventory items that are the best performers and improve your business's overall operations.
Here’s how you can calculate the gross ROI:
#10. Inventory Velocity
Spending extra on inventory stocks can drain your resources in no time. That’s why it’s necessary to optimize your inventory levels time-to-time.
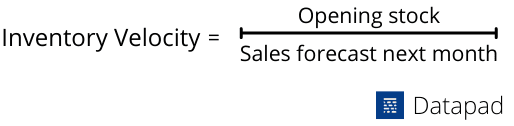
Inventory velocity is a decisive supply chain key performance indicator that estimates the percentage of inventory to be consumed within a certain time frame.
This KPI proves to be pivotal in providing clear insights about warehousing operations. Moreover, tracking this metric also tells you about the performance of SKUs.
What's more, it helps you minimize the risk of surplus and outdated inventory issues, which in turn gives you a greater chance of meeting the customer's expectations.
You can calculate inventory velocity as shown below:
#11. Warehousing Costs
While warehouse costs vary based on the number of storage spaces and cost distribution, it’s necessary to monitor them to reduce unwanted expenses.
Warehouse operations include several direct and indirect costs like:
-
Labor costs
-
Rent of the place
-
Raw material costs
-
Utility bills
-
Warehouse management costs
This KPI gives a holistic view of how your warehouse operations are performing and how you can keep the costs on the lower side.
This way, you can avoid unnecessary costs and manage the operations in a more efficient way.
To calculate warehousing costs, all you have to do is add every element that adds up to your warehouse cost.
#12. Supply Chain Costs vs. Sales
Tracking business expenditure is the first step to understanding where you’re spending more and where there’s a scope for potential saving. And so, it’s important for businesses to cut costs where it actually makes sense.
The supply chain, as a portion of sales, represents the total cost of the supply chain as a percentage of the total sales for a particular time period. Basically, it tracks how much you're spending relative to a whole.
Sometimes the extra costs involved in delivering your products might decrease profitability.
Tracking this KPI, you can optimize the supply chain by reducing the additional costs incorporated into your cost of sold goods.
In other words, you can check the health of your spending analysis by comparing your costs with the sales and boost your net profit percentage.
#13. Inventory to Sales Ratio
Efficient management of inventory is essential to firms, especially when they've to deal with large stocks. For this, they need to keep their stocks balanced so that there's never too much or too little.
The inventory to sales ratio measures the amount of inventory for sale compared to the actual sales that are being made.
This helps businesses adjust their stock order to cope with the unpredictable changes arising due to fluctuations in the market.
Here’s how you can calculate inventory to sales ratio:
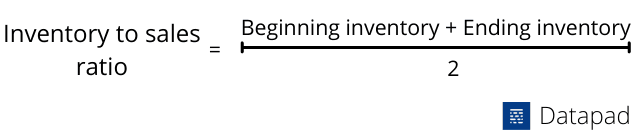
A lower value indicates excellent business performance meaning higher sales and lower inventory.
#14. Pick and Pack Cycle Time
With customer expectations skyrocketing in recent times, it has become indispensable for companies to adopt practices that give them a fair, competitive advantage over others.
Pick and pack cycle time is one such metric that differentiates a top performer from an average one. It captures the time taken by companies to put the product from warehouses to prepare it for shipping.
It says a lot about the efficiency of your supply chain practices and their weak spots.
You can use this information to meet existing customer demands and acquire new ones too. In addition, you can also take targeted actions to implement a robust logistics process.
#15. Reason for Product Return
Let’s face it; it’s always annoying to be on the opposite side of a return order. Meaning if you’re the owner of a business getting multiple returns from numerous customers, it might annoy you.
It's not just annoying, but a significant increase in return orders might lead to declining revenue and ultimately break your business apart.
But the pain doesn’t stop here.
If customers are returning your products due to some technical difficulty or bad quality, the review sites will be a nightmare for you.
Getting 1 and 2 star reviews on big websites like Amazon, eBay, Etsy, etc. will be hard to recover from.
To track the major reasons behind product return, first, ask every customer who has ever returned your product about the reason for return and make a note of it.
For example, the reason for return could be - Defective product, sending out the wrong product color, a different product from the image shown, and many more.
Try finding out the major reasons for your product return and act on it immediately. That’s because the return rate of a product could make or break your business.
How to Track Your Supply Chain KPIs Easily with Datapad?
Tracking Supply Chain KPIs with Datapad is a quick and easy process. Even if you don’t have much experience tracking KPIs, you could get used to our tool in no time. That’s because you don’t need to know the nitty-gritty details about KPIs when tracking them.
Tracking supply chain KPIs with Datapad is a three-step process:
-
Create a supply chain KPI dashboard
-
Import the supply chain-related data from all the data sources
-
Add KPIs to the dashboard, bring your team onboard, and start tracking them on the go
Let’s look at these steps one by one.
Step 1: Create a Dashboard
Log into our mobile app from your iOS or Android device and tap on ‘Create a dashboard’ option.
Name the dashboard ‘Supply Chain KPIs,’ add an emoji (optional), and type the description of the dashboard (optional).
<GIF Supply chain kpis dashboard>
Once you’re done, click on create, and that’s it.
Step 2: Import All the Supply Chain Related Raw Data
To track a certain KPI, you first need to collect data from multiple data sources about it - both quantitative and qualitative.
For example, if you want to track a procurement KPI like order fill rate for your business, in that case, you will need:
-
Total number of products you sell in your store
-
All the products you’ve shipped to date
And then, you need to put in the formula of fill rate (see the formula under #4. Fill Rate header in the article).
You can store data anywhere - Google Sheets, Excel, Shopify, or any other data source; Datapad lets you import data via its one-click integration in seconds.
Or, if you’re just getting started and got a handful of orders, you can type the data manually, name the KPI, and set goals.
Here’s one example of how to integrate Datapad with Google Sheets via the one-click integration.

Step 3: Create and Add KPIs on the Datapad Dashboard
Now that you have all the data related to your supply chain KPIs, it’s time to add KPIs to the Supply Chain Dashboard we created in step 1.
Let's assume that you've stored the raw data for supply chain KPIs in Google Sheets.
Go ahead and select the data you want to track from the Google Sheets (2 or more rows or columns) or any other data source and import it into Datapad.
If you want to enter a KPI manually, here’s a GIF on how to do it.

Apart from this, Datapad offers a boat-load of other features:
-
Team Collaboration: Bring your team onboard and let them track KPIs along with you
-
KPI Search: Search for a specific KPI in the Datapad app by simply typing the keyword and save time
-
Communication: Talk to your team about the KPIs you track on your dashboard in real-time via the comment section that Datapad offers below every KPI card
-
Push Notifications: Get notifications and alters when a specific KPI goes above or below a set benchmark
-
Customization Options: Change the color, size, and font of KPIs as per your brand’s color scheme and make KPI tracking a fun thing
-
Set Goals: Datapad lets you set realistic goals for individual KPIs and assign them to your teammates to track KPIs better
Bottom Line: Sign up for our free-to-use mobile app, and track the right KPIs that will make your supply chain more efficient.
Read more:
Top 13 HR KPIs & Metrics You Should Track For Your Team
13 Most Important SEO KPIs Every Business Owner Should Track in 2022
13 Email Marketing KPIs Every Marketing Professional Should Track
13 Software Development KPIs Every Dev Team Should Track
15 KPIs for Logistics Every Logistic Manager Should Measure
15 Best KPIs for Operations that Are a Must for Every Business to Track
13 Best Product Manager KPIS You Should Be Tracking In 2022
15 Important Retail KPIs & Metrics to Track For Better Understanding of Your Business
10 Startups KPIs You Need to Track [We Asked to the Experts]