
The ever-growing demand for apps and software has led software developers who excel in Python, SQL, and Java to come into the limelight.
Even the trajectory shows a growth of 21% in software development operations by 2028.
But with great news comes great responsibilities.
The rise in demand simply means you need to upscale your development process in terms of size and quality.
And to do this, you need a handful of software development KPIs that will help you build reliable and profitable software.
In this article, you will learn what software development KPIs are, why they are so important for your team, and the most prominent KPIs you need to measure to build remarkable software for customers and corporate houses.
What Are Software Development KPIs?
Key Performance Indicators (KPIs) are quantifiable measurements used to gauge the performance of your business towards set goals.
In context to software development, these metrics indicate how well your development efforts align with the business objectives.
If you're here, you might have the know-how of certain software development KPIs. But you would be surprised to know how wrongly most businesses use KPIs.
For example, measuring lines of code, time taken to code, and the number of deploys are not uncommon between businesses.
And to be honest, these KPIs are nothing but plainly misleading.
Such indicators do not align perfectly with your business objectives.
Software development KPIs must be much more nuanced to measure development projects' success effectively.
Moving forward, we have enlisted the 13 best software development KPIs you must track to stay on top of your projects. But before diving into the matter, let us ask you what makes these KPIs important to measure.
Is it the agility, flexibility, or management that makes software development KPIs the right blend of business interest and software quality?
Benefits of Choosing the Right Software Development KPIs
Quality performance requires constant monitoring. Besides, there's nothing wrong with tracking everything that goes along with your development operations.
For example, estimating the time taken for software development is an excellent KPI to measure. You may ask why?
The insights generated via this metric will help you:
-
Optimize the time spent on the development process
-
Plan your tasks and goals accordingly
Likewise, other software development KPIs serve a purpose – detecting errors, solving problems, or helping in decision-making. Keeping it short, these KPIs allow you to:
-
Monitor the company's health
-
Gauge progresses against goals and objectives
-
Analyze and iterate development patterns over time
-
Solve problems and grab opportunities via predictive data
13 Best Software KPIs Every Development Manager Must Track
KPI #1. Cycle Time
Cycle time is among the DevOps Research and Assessment team (DORA) metrics. DevOps teams widely use DORA metrics to measure their performance and determine whether they are "low performers" or "elite performers."
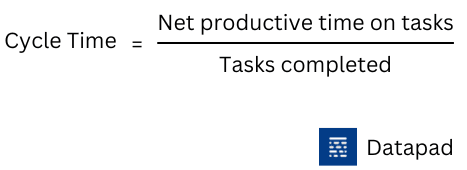
Cycle time measures the time spent by the dev team members to complete a specific task.
Development teams use this KPI to measure the team's productivity and analyze the development process's efficiency.
Why Is It Important?
Cycle time matters because the lower it is, the surplus code your team is shipping. Plus, measuring this metric can benefit you in two ways.
Firstly, you get to know how long it takes to complete a task and use data to objectively quantify your team's performance. You can also predict the cycle time for future similar development projects.
Secondly, you can spot any process blockages, like something causing inconsistencies or obstruction.
Here's a simple formula to calculate cycle time:
KPI #2. Development Velocity
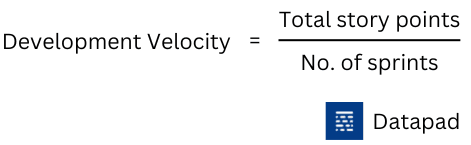
Development velocity refers to the amount of work your team can complete during a sprint.
For those unaware, a sprint is a set period of time during which specific tasks are to be completed.
It's basically a part of the Scrum methodology used by agile companies to manage employee productivity.
So, during sprints, most teams use story points to estimate the amount of effort it will take to complete a task. The measure is on a scale of 1 to 10, with 1 being the quickest task and 10 being the most complicated.
Why Is It Important?
Development velocity lets you and your team analyze your efforts and foresee your performance on other recurring tasks. You can also compare past and current sprint velocities to measure team productivity.
Suppose we say, out of three consecutive sprints, your velocity stood at 100,120, and 140, respectively. This data can help you understand three important things:
-
Workload your team can handle
-
Increase in productivity over sprints
-
Average time taken to complete projects
Development velocity also conveys a lot about how realistic your business goals are.
Here's a quick formula to measure this software KPI:
KPI #3. Change Failure Rate
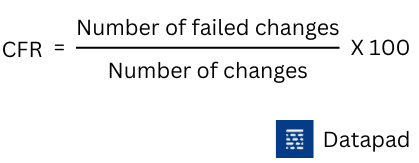
The change failure rate (CFR) is an extremely useful metric for measuring quality. It’s the percentage of deployments that cause a failure in production.
Why Is It Important?
Code quality is subjective in nature, making it hard to measure and analyze. But however complex its measurement is, it's an important metric to track.
The change failure rate is a handy metric that development teams use to test the quality of source codes.
A lower CFR means that your code has fewer bugs and is of higher quality. In contrast, a higher CFR means the other way around.
A higher CFR also means that your dev team must again put in the time, resources, and brain to revamp the code and make it error-free. Doing this complicates the overall development process and adds blockage to the free flow of tasks and operations.
Here's a straightforward formula to calculate CFR:
KPI #4. Deployment Frequency
Deployment frequency is among the four DORA metrics and, comprehensively, a core Agile delivery metric.
This metric refers to the pace at which your development team deploys code into staging, testing, or production departments.
Why Is It Important?
Deployment Frequency is an essential metric to measure because it directly aligns with the objective of Agile software delivery, i.e., fast and continuous code delivery.
Moreover, as we said, this is a comprehensive metric; it's interlinked with a few other DORA metrics such as cycle time, change failure rate, mean time to recover, and more.
For example, if DevOps requires 1000 lines of code, is it better to deploy the whole code at once or segment it into fractions or batches, like 5 batches of 200 lines of code?
The best way to accomplish the goal would be to deploy 5 batches of code.
You may ask why?
Small fractions of code, say 200 lines, would take less time to be deployed. Plus, by doing this, you reduce cycle time and allow your production team to get started without waiting for the whole code at once.
Besides, since the deployments are small, you're entirely in control of them. Even if a code breaks or malfunctions, you know precisely which chunk to look upon.
For the most part, this metric is essential for:
-
Organizations looking to increase their agile development maturity
-
Organizations with a history of infrequent or deployed deployments
KPI #5. Pull Request [PR] Size
A pull request, also known as a merge request, is when a developer begins the process of merging new code changes with the main project after reviewing them.
PR size is the number of pull requests reviewed and merged with the ongoing project trajectory over a period.
Why Is It Important?
Pull request is a way for developers to tell that they are done with writing the code and that it is ready to be reviewed and merged.
However, an ideal pull request might take up to 4 days. Hence, an increase in PR size accounts for the delay in cycle time.
You must ensure that your PR size stays low to get things going smoothly. You can do that by reviewing certain chunks of code in regular intervals instead of waiting for the right moment (which, philosophically, never comes).
Typically, a PR size of less than 250 code changes is considered to be elite by DevOps.
KPI #6. Defect Detection Ratio [DDR]
We believe in the supremacy of technology, but we also believe that every technical product faces defects. It can be detected during the testing phase, or it might slip to your end user.
The defect detection ratio, also calculated as a percentage, is the ratio of defects found prior to release vs. the number of defects found post-release.
Why Is It Important?
The DDR helps you gauge the effectiveness of your testing team.
For example, you can track the percentage of defects that surpass your development and testing phase and land with your customers. Eventually, this indicates poor user experience, hampering your overall software quality and integrity.
Moreover, by measuring this software KPI, you can:
-
Measure the effectiveness of the process adopted for testing
-
Expose the weakest link in the process, and take corrective measures
-
Evaluate the performance of the testing team
In general, a higher DDR indicates the impressive performance of your testing team and vice versa.
Here's how you can calculate defect detection percentage:
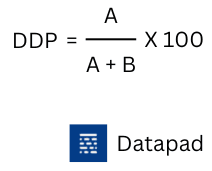
Here,
A is the number of defects at the moment of software version release
B is the number of defects that escaped testing and are detected by end-users
Suppose a case where 100 defects were detected in the testing phase and 20 defects were found by customers after release. Here, the defect detection percentage will be:
[100 / (100+20)] X 100 = 83.33.
Your DDP stands at 83.33%.
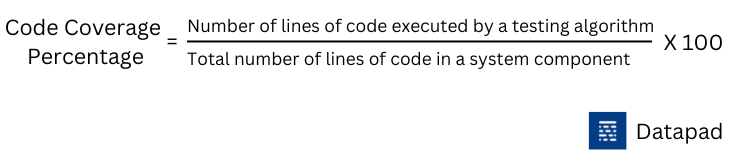
KPI #7. Code Coverage Percentage
Code coverage percentage is yet another essential metric for DevOps.
The CCP is used to measure the quality of code deployed for testing or production purposes.
Also known as test coverage, this metric determines how your source code executes when tested.
Why Is It Important?
The CCP allows software development managers to identify the quality of code. The metric mainly shows how many code lines are successfully executed and how many of them need compilation or optimization.
The higher the CCP, the more reliable and efficient your code is, and vice versa.
Note: Coding, being a next-level language for humans, often accounts for some human errors. Therefore, one shouldn't aim for a 100% CCP; the more, the better.
A lower CCP indicates that the source code provided is often encountering bugs and errors during testing. You can use this data to improve and raise the bar of your team's coding unit.
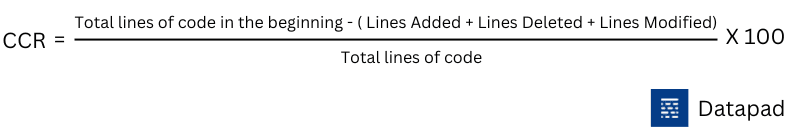
KPI #8. Code Churn
Code churn, often termed code stability, is the measure of the number of times code changes or requires iterations over a period.
Why Is It Important?
Code stability is a lethargic yet essential metric to measure.
It's used during DevOps to measure the number of times a code is being rewritten or iterated due to introducing a new feature or upgraded software version.
While code churn isn't something bad or unusual, a higher code churn often results in high maintenance and thus caters to high risk.
An experiment by GitPrime's data science team found that the average code churn levels run between 13-30% (70-87% code efficiency).
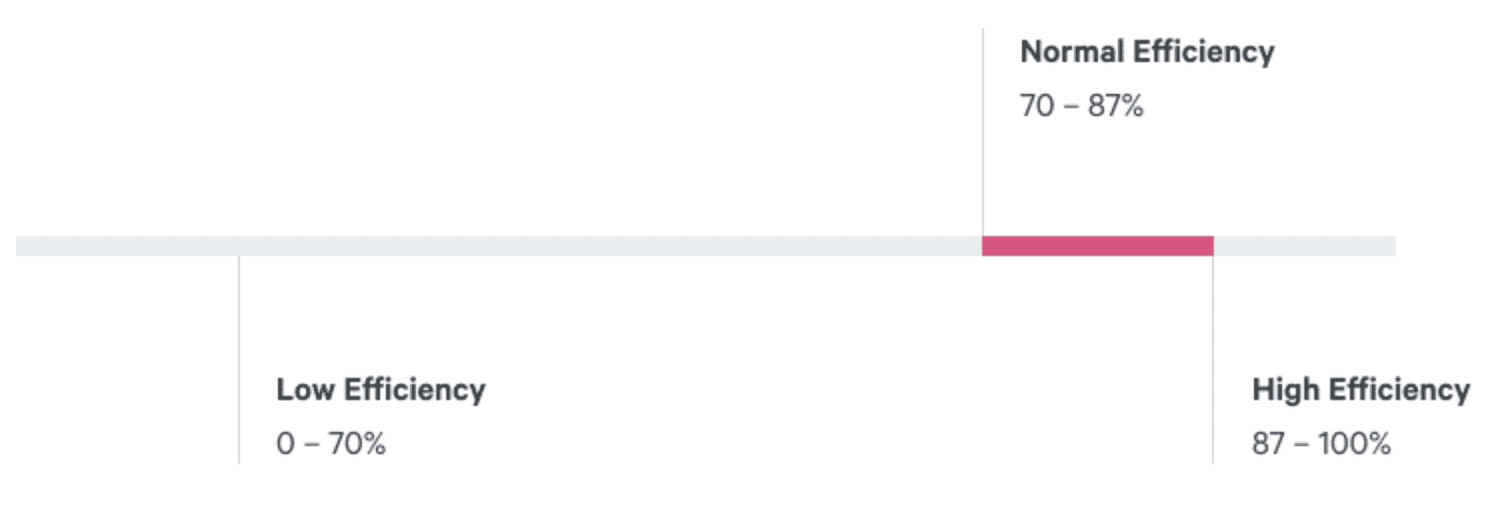
However, DevOps can comfortably operate at 25% code churn, which depicts 75% efficiency of the code.
Here's a simple formula to calculate the code churn rate:
KPI #9. Code Simplicity
A simple code executed successfully is of more value than a complex code which requires rigorous testing and iterations.
Code simplicity, as the name suggests, measures the number of independent paths your code has.
Why Is It Important?
Undoubtedly, simpler code is easier to test and maintain for your testing team. It reduces the overall time consumed in testing and iterating the code for perfection.
Understand it like this: the fewer independent paths your code has, the higher the code's simplicity and the less time it takes for support, review, testing, and debugging.
KPI #10. Cumulative Flow
Software development processes are complicated as hell. They have a cluster of “Ongoing" and "To be Done" tasks that need to be streamlined.
Cumulative Flow demonstrates the status quo of your software tasks or tickets via visual diagrams.
Generally represented as a table, cumulative flow uses different colors to represent different stages like 'Approved,' 'In Progress,' 'Backlog,' and more.
Moreover, these colors are arranged in bands so that the width of the band correlates to cycle time.
Why Is It Important?
Cumulative flow revolves around three essential engineering metrics of the workflow: Throughput, cycle time, and work in progress.
Thereby allowing teams to identify bottlenecks and work towards stability of the workflow. Cumulative flow becomes important when dealing with long-term or complex processes requiring a streamlined development process and effective collaboration between departments.
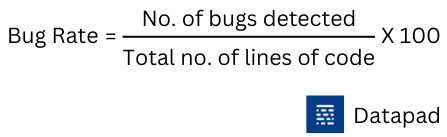
KPI #11. Bug Rates
Bug rates refer to the frequency of bugs being discovered during testing.
Simply put, it is the process of logging and monitoring the bugs or errors encountered during software testing.
Why Is It Important?
According to a National Institute of Standard Technology study, software bugs cost the U.S economy $59.9 billion annually. That makes it pretty clear why it's an important metric to measure.
This metric is similar to the defect rate but not essentially common to that.
Majorly, bugs are measured from two aspects: the total number of bugs and the severity of the bugs.
While you can always count the number of bugs and fix the maximum number, the severity of bugs should remain minimum.
Here's a simple formula to measure bug rate:
If the bug rate is more than the acceptable benchmark or the severity of the bugs is higher than the medium level, it's time to make adjustments to your code.
KPI #12. Mean Time Between Failures [MTBF] and Mean Time to Repair [MTTR]
Mean Time Between Failures (MTBF) and Mean Time To Repair (MTTR) are two distinct metrics used to gauge a unified objective - the reliability of your software.
MTBF measures the average time between two failures in the software, and MTTR is simply the time it takes to repair those faults.
Why Is It Important?
Failures are part of software development; even professionals bow down to them. So, it's evident that you can't develop a software without tasting failures.
But you can minimize the damage caused by those failures by proactively measuring the number of occurring failures and optimizing the time it takes to repair those faults.
Here's how you can calculate MTBF and MTTR:

Pro Tip: Calculating the metrics simultaneously can help you measure your software development teams' overall productivity and efficiency.
KPI #13. Net Promoter Score
The end users of every software are customers, be it B2C or B2B. And what matters most is the customer satisfaction
Net Promoter Score (NPS) is a widely used metric that measures the level of satisfaction users get after using your product or service.
Through NPS, you get a score between 0 to 10, where 0 reflects the worst experience of your software, while a rating above 8 resonates with an excellent user experience.
To ease the measurement process, the people who vote between 0 to 4 are termed Detractors, 5 to 6 are termed neutral, and above 6 are known as promoters.
Why Is It Important?
If the number of promoters exceeds the number of detractors, your software is performing impressively well. And if it's the other way, you need to make changes in the final software to make it better for users.
Here's a simple formula to calculate NPS:

Pro Tip: Before launching your software to the market, share an NPS from within your organization and ask employees and executives to test the software on their own and give feedback via NPS.
How To Create a Software KPI Dashboard In Datapad?
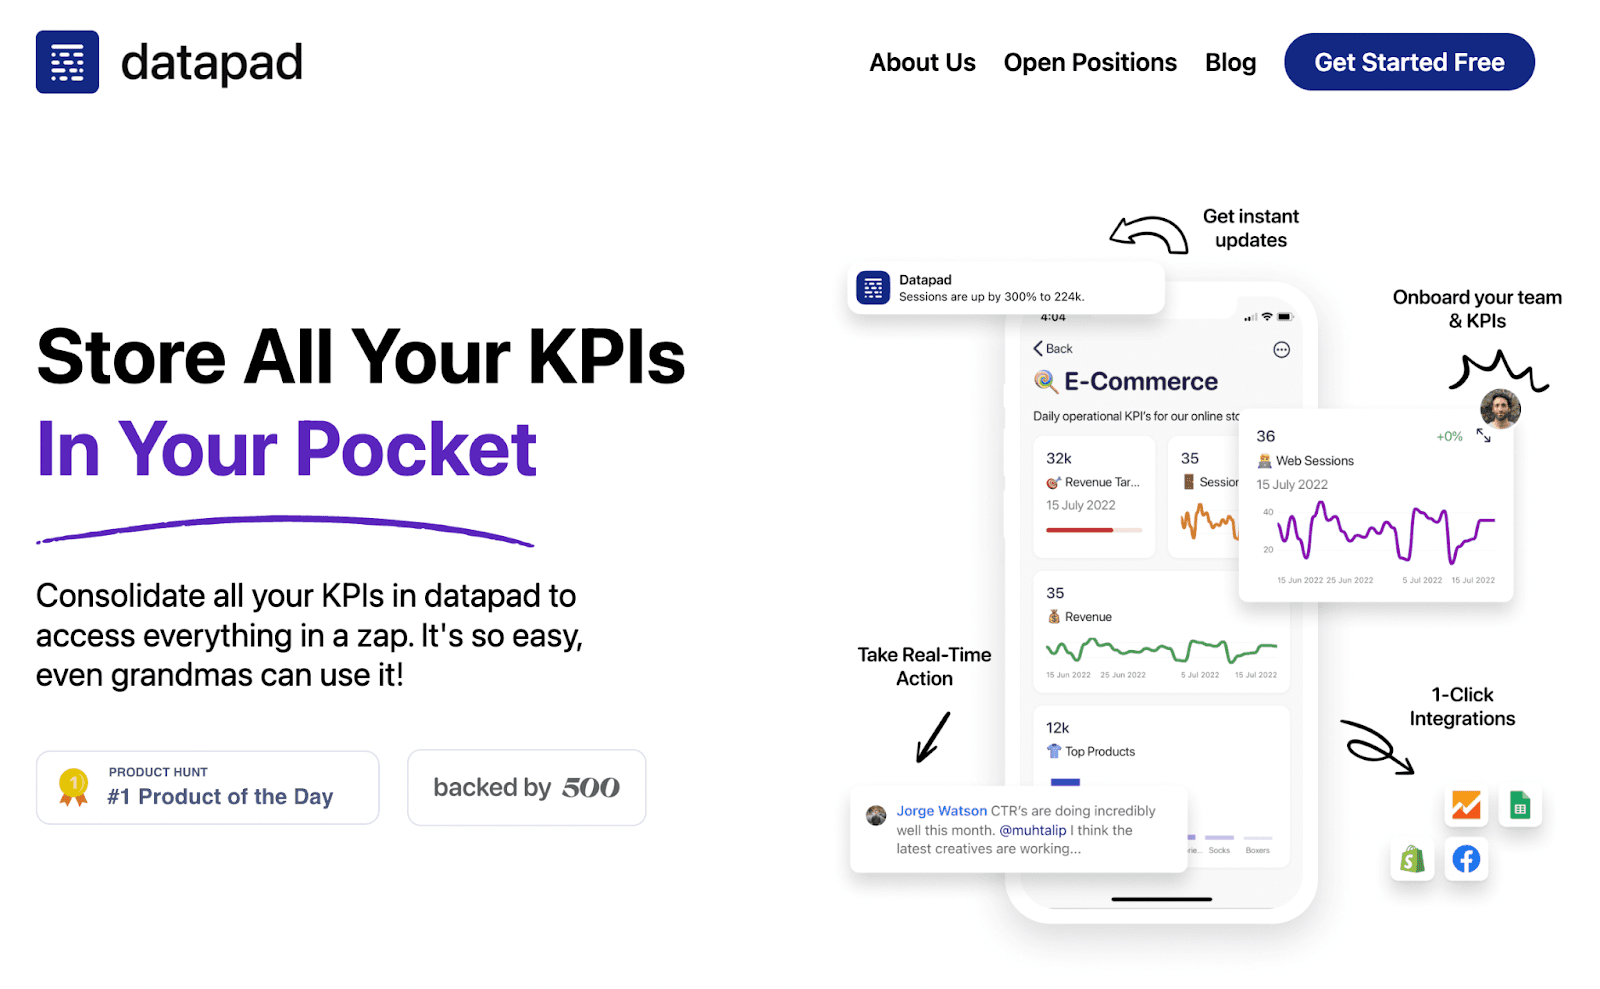
Datapad is a mobile-friendly dashboard creation tool that allows coders and software development managers to collect, monitor, and analyze DevOps data.
Development operations have a cluster of data waiting to be nourished and transformed into easy-to-understand data visuals.
And our tool offers precisely the same USP.
With Datapad, you can manage your development processes through your smartphone. All you need is a reliable network connection and the right KPIs to stay on top of the development process.
Here's how you can create a software KPI dashboard in Datapad in three easy steps.
Create Software Dashboard in 3 Easy Steps
Step 1: Get the Datapad App
Our app is available on both the play store and app store. It's convenient to download as it's just the size of another delivery app on your mobile.
Furthermore, our app is compatible with all known small-screen devices, so screen optimization will not be an issue here.
Anyways, after you have downloaded the app, quickly Sign Up with your preferred email address.
Here, you are invited to create your personal workspace (simply add a name to it).
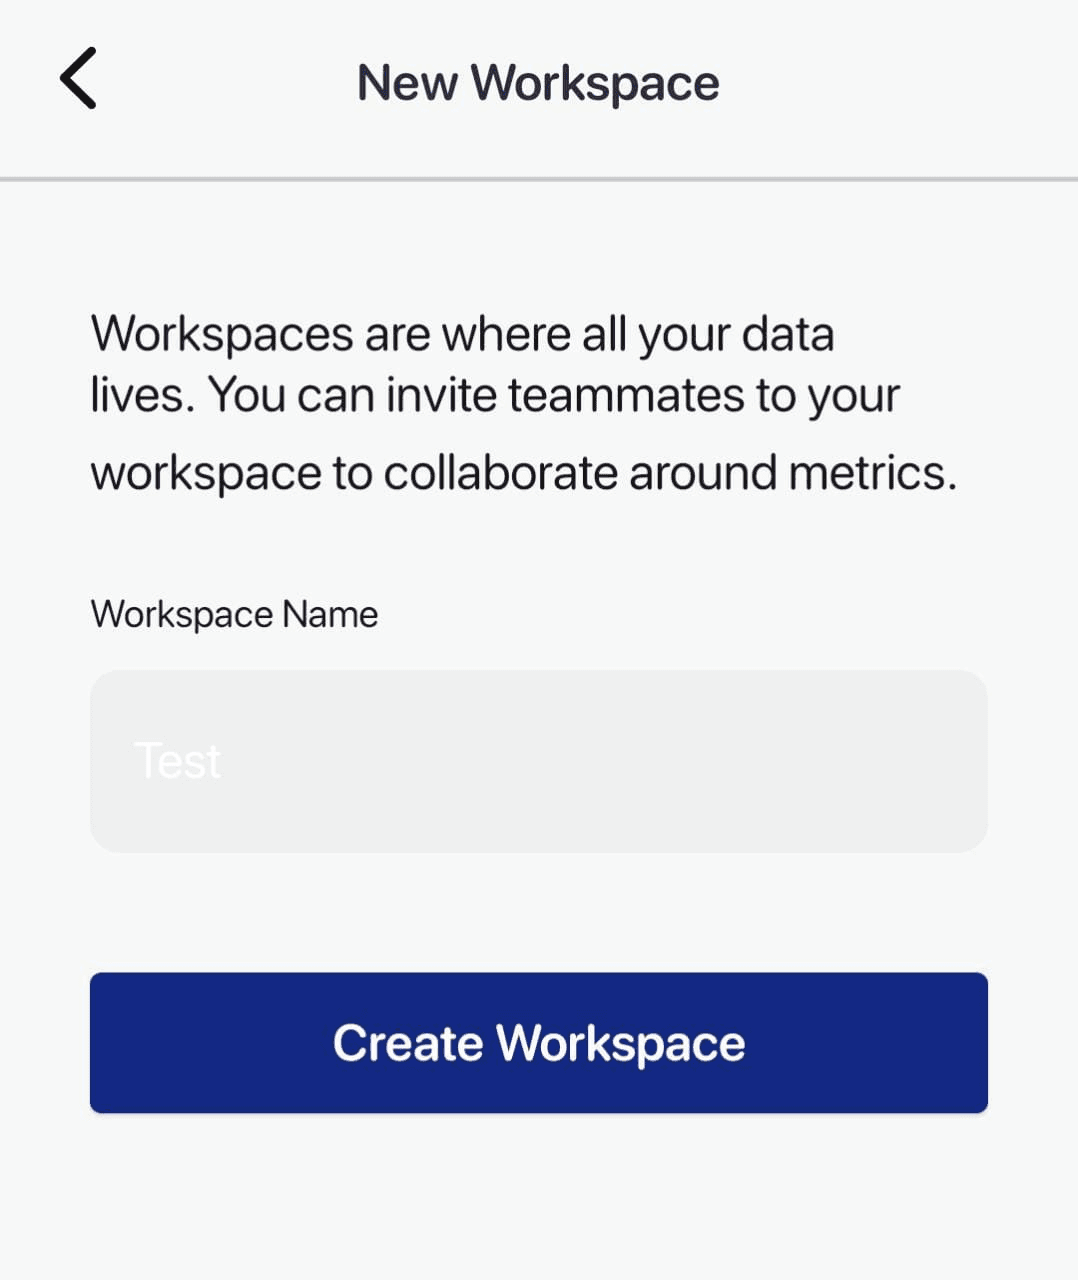
Then, press the '+' sign on the top right corner to create a brand new dashboard.
Name it, describe what the dashboard's for, and use an emoji if you want. Click on Create when you're done, and that's it!
Step 2: Data Import
Once you have created a software KPI dashboard, it's time to fill in with primary data. Our tool offers both automatic and manual data import.
If you have data stored in various CRMs and SQL Databases, we suggest you opt for Datapad's one-click integrations. Here's how you can leverage Datapad to import data with a click:

In case of data sampling or if you missed out on some data and want to add it back, you can enter them manually. Here's how you do that:

Step 3: Onboarding Developers and Stakeholders
Once your dashboard is ready for action, it's time to onboard your team and key decision-makers.
Our tool comes with a seamless team onboarding process. It's not going to be a tiring, week-long drill.
Instead, it's a matter of minutes before your development team is ready, set, and good to start with KPI tracking. You can send an email invitation to people who you want on your dashboard.

Plus, you always have admin privilege. You can manage who can view or edit the dashboard.
What’s more, you have complete freedom to change the look and feel of your dashboard.
Besides, you can:
-
Customize KPIs and dashboards to fit your brand color, mission, and vision
-
Search specific KPIs via the search bar and track them on the go
-
Set measurable goals for each KPI and treat them as benchmarks
-
Assign tasks to employees and communicate in real-time
So join us in this amazing journey of software KPIs tracking by signing up to our free-to-use mobile platform, Datapad.
Top 13 HR KPIs & Metrics You Should Track For Your Team
13 Most Important SEO KPIs Every Business Owner Should Track in 2022
13 Email Marketing KPIs Every Marketing Professional Should Track
15 KPIs for Logistics Every Logistic Manager Should Measure
15 Best KPIs for Operations that Are a Must for Every Business to Track
13 Best Product Manager KPIS You Should Be Tracking In 2022
15 Important Retail KPIs & Metrics to Track For Better Understanding of Your Business
10 Startups KPIs You Need to Track [We Asked to the Experts]